backtesting margin of error

I’ve often wondered how much of my backtesting results is simply random. Well, I’ve figured out a way to quantify it by performing a simple test (see below). These are my results, in which I’m not terribly confident, but which feel right to me. The number on the right is a rough margin of error caused by randomness. This margin of error will probably get a lot higher the farther away from the benchmark you go.

1000 stocks bought and sold: ±26% annually [no, that’s not a typo—a few crazy stocks can easily do this with such a small sample]
2000 stocks: ±3.5% annually
3000 stocks: ±2.3% annually
4000 stocks: ±1.8% annually
5000 stocks: ±1.3% annually
7500 stocks: ±1.25% annually
10,000 stocks: ±0.85% annually
20,000 stocks: ±0.6% annually
30,000 stocks: ±0.5% annually

Just for reference, here are the number of stocks bought and sold in some common backtests:

5-yr backtest, 15 stocks, 4-wk rebalance: 975 stocks
7-yr backtest, 20 stocks, 4-wk rebalance: 1820 stocks
5-yr rolling backtest, 15 stocks, any rebalance: 3900 stocks
5-yr simulation, 15 stocks, 1000% turnover: 750 stocks
10-yr simulation, 20 stocks, 1200% turnover: 2400 stocks

5-yr ranking, 20 buckets, R3000, 4-wk rebalance: 9750 stocks per bucket
5-yr ranking, 100 buckets, R3000, 4-wk rebalance: 1950 stocks per bucket
10-yr ranking, 50 buckets, SP500, 4-wk rebalance: 1300 stocks per bucket
10-yr ranking, 20 buckets, SP500, 3-mo rebalance: 1000 stocks per bucket

In my opinion, any backtest that doesn’t have more than 2000 stocks bought and sold is basically meaningless. The margin of error is too big.

To run a backtest that will tell you that a difference of 1% per annum between two options is meaningful, you need a margin of error of ±0.5%, or 30,000 stocks bought and sold. A rolling backtest of the top 60 stocks over a 10-year period will give you that. If you want that degree of accuracy over a 5-year period, you’ll need a selection of 120 stocks at a time. Another option is to run, say, six different rolling backtests of a different number of stocks at a time over different holding periods. That’s what I do, along with using an Excel spreadsheet that converts rolling backtest results into annualized excess returns. If you’re using the performance button on a ranking system and you break the Russell 3000 down to 10 buckets, rebalancing every four weeks, for fifteen years, you’ll be totally fine—that’s 58,500 stocks per bucket. If you want that degree of accuracy for a 15-stock simulation, you’d better use the rolling simulation that P123 rolled out last year. A simple 15-stock simulation with a 1000% annual turnover over 15 years is only 2,250 tests, so a rule that gives you a 5% annual improvement in your sim is basically meaningless. One that gives you a 8% improvement, though, is probably a keeper.

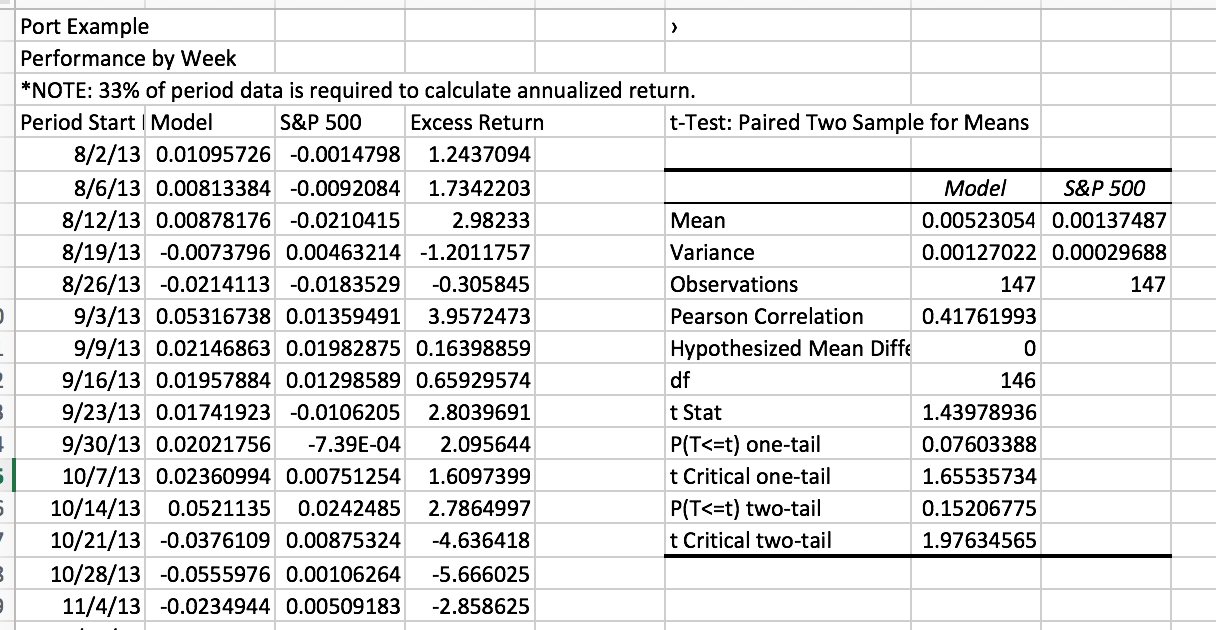
Here’s my method for calculating. I used a ranking system that consists of one factor only: “Random.” I tested the Russell 3000 over a ten-year period using the rolling backtest for a holding period of 52 weeks. I varied the number of stocks in my basket, tested each number ten to twenty times, and noted the largest and smallest average results. I then compared those to the average result of the entire Russell 3000, with the biggest difference being my outlying number. Not the most scientific method, I admit. But I couldn’t come up with a better one.

All this, needless to say, tells you nothing about out-of-sample performance. It simply tells you how reliable your in-sample results are.

If I’m understanding correctly, the study was looking to explore # stocks in and of itself without regard to how they are chosen (i.e. your one-factor ranking system called “Random”).

If that is what you did, then your results make sense. When you work randomly, you probably need the law of large numbers to make it sensible. (My statistical vocabulary is not up to stating it more eloquently.)

But random selection has nothing to do with what any of us are doing. We are (or should be) looking to develop and test strategies/ideas that are extremely non-random. It would seem to me, therefore, that you would have to study number of stocks with selections determined in a manner that reflects something along the lines of what we do.

While I do think you would still wind up finding that very small numbers of stocks allow for too much error, I strongly suspect the number you’d find acceptable would be well below 2,000. (I judge that based on the numbers of stocks in the sample backtests you presented, all of which strike me as being very reasonable.)

I was trying to quantify how much randomness will affect aggregated results. But there was a flaw in my approach which I now see. The perfect, error-free result of my rolling tests would be using the entire Russell 3000 and testing it over 500 weekly periods for a total of 1,500,000 trials. That would give us a 0% margin of error. Obviously, 1,000 trials out of 1,500,000 isn’t enough to give us a good idea of what’s going on, and 2,000 is quite a bit better but only barely satisfactory.

When testing over a five-year period, however, you need only half the number of trials, and if your universe is smaller, you need even fewer. So if you’re testing a strategy for the SP500 over a five-year period, for a 0% margin of error you’d need only 130,000 trials, and you’d want to adjust the number of tests needed accordingly–to about 1/10th of the number I gave above. In other words, perhaps 200 trials would give you a margin of error of 3.5% and 1000 trials would be more than sufficient for a low randomness factor.

And I agree that there may be a much better way to test randomness and trial size than the one I’ve come up with . . .

I found a better formula for sample size: take the z-value (confidence level) times the standard deviation divided by the desired margin of error and square the whole thing. (From Statistics for Dummies.) So let’s say the standard deviation of the Russell 3000’s annual returns is about 56 and you want a 90% confidence level (z = 1.645) and a margin of error of plus or minus 2%. Then the sample size is 2,122. For a 1% margin of error, you’d need a sample size of 8,487. For a 5% margin of error you only need 340 samples/trials. If your universe is the S&P 500, though, you have a much smaller standard deviation (about 24), so the sample size for a 2% margin of error goes down to 390, for a 1% MOE to 1,560, and for a 5% MOE you only need 63 samples.

Be careful about bringing mathematics/statistics into an unsuitable area. Quantity of sample can be much less important than quality of sample. If you’re testing tampons among a sample of men, there is nothing in terms of confidence interval, z-score, etc. that can lead you to a valid study. Similarly, a study of sales trends in an effort to assess the desirability of a frozen meatball entrée would not be valid unless one pre-qualified the territory to assure that vegetarians are not disproportionately prevalent in that particular neighborhood and if that is not done, nothing involving statistical technique could rescue the study.

Most of the problems I’ve seen on p123 in terms of quants going awry have to do with specification. This shouldn’t be a bold assertion. I’m not an engineer, a scientist, etc. But I imagine that in those and other professions, isn’t proper specification critical? To me, the three most important aspects of the scientific method are specification, specification, and specification. Is it different in other areas?

For example, I rarely use the ranking-system performance test and on the few occasions when I do, it’s most often for presentation purposes. That’s because I never have occasion to run a rank against an unconditioned universe. For example, I don’t rank value metrics because I have no expectation that they will lead me to a successful portfolio aside from luck. For something more substantive to happen, I’d need to run value metrics against a pre-qualified subset that eliminated companies whose ideal metrics are less likely to be pushed downward by considerations involving risk or growth. Or, I might not rank by Value at all in a value model. I might instead filter the universe by stocks having lower valuation metrics and then, rank based on growth and/or risk considerations and/or add growth-risk factors to the screen. So I never care about whether a ranking system “works” on its own. I only care about the total model of which the ranking system is one inseparable element. And this is why most of the ranking systems I use for real-money work are the generic ones I created for p123, Quality, Value, Growth, Momentum, Sentiment or some combination thereof. All I need to make them usable in this way is confidence that they represent, for better or worse, their respective styles.

Any study of appropriate sample size would need to be specific to the kind of model you’re trying to create. My guess is that you would not have to test every possible variation but I do think any test would have to work with and a ranking system working together to express a non-random idea.

But let’s move on to another aspect of your study question? Why is a 20-stock portfolio likely to be less error prone than a 5 stock portfolio? How can we develop a plausible hypothesis that it should be 20 and not 50 or 175? Whatever the results of empirical study, there are always reasons why the results were what they were.

I once did something like that in the contest of a low-priced ($3-$10) stock portfolio. I started with a very non-random model that made sense and which I had reason to know would work if properly specified. The desirable number of stocks, therefore turned on how many would give me a portfolio whose overall fundamental-technical characteristics would most likely match what I was looking for in the model. Few, if any companies can give you everything you can possibly want. All companies give you some things to better degrees than others due sometimes to the underlying realities of the respective companies and other times to data oddities (unusual unsustainable levels of something at a particular point in time). In the high-risk highly heterogeneous nano-cap universe with which I worked, I would up with a 40-stock master portfolio. That gave me a good chance of having a portfolio (i.e. view it as an artificially created prototypical stock) that gave me enough of the qualities I sought without going so far as to cause large numbers to exert their own push toward the market average).

Another consideration: rebalancing interval. Different investment cases need different amounts of time to play out. So you can never be indifferent to 1-week, 4-weeks, 3-months, etc. Just as there are some models that perform best with 1-week rebalancing, others do best with 13-weeks and collapse if rebalanced weekly. So it would be necessary to test only one rebalancing interval, the one most compatible with the investment case articulated by the non-random model. (In the aforementioned example, I was running a 4-week strategy, no sample size would have worked with 1-week or 13-weeks),

Marc,

Thanks for this. Indeed, the entire concept of “margin of error” brings up a problem. If you’re comparing the efficacy of two or more systems (a necessity in any optimization process), with a larger sample size, the difference between results is much smaller; with a smaller sample size the difference is greater. If the two systems are very similar, the difference is always going to be less than the margin of error; if they’re very different, it’s always going to be greater. Therefore, beyond a certain minimum, sample size isn’t going to matter when comparing two systems: the only thing that matters is how different the systems are. In other words, the question I began this thread with is the wrong one.

While the question of specification is indeed paramount, I’m working on the assumption that one’s specification is solid (though I agree that this often isn’t the case), and trying to look beyond that to the right combination of optimization and robustness.

What you say about the performance test resonates with me. I resisted using the accrual ratio (net income minus operating cash flow divided by average total assets, lower better) because the performance test shows a dramatic drop-off at the right of the ten-bucket graph. But my guess is that if you’re only testing stocks with high growth, the performance test would look very different. On the other hand, I view the advantage of using P123’s ranking systems over the normal stock screener one can find at finviz or on Fidelity as a method of EVALUATING a stock choice on the basis of a multitude of factors at once. So the question is, for example, does one evaluate the debt load of a company based on its debt-to-equity ratio or its debt-to-EBITDA ratio? The results are completely different. And that’s where the performance test can be extremely helpful. Here’s another example. I assumed that a year-by-year increase in the operating margin would be a good thing. But the performance test shows a very high bell curve. That spurred me to do some deep thinking about what happens on the high and low ends of changes in operating margin. Either sales are dramatically increasing and operating income is dramatically decreasing, or vice versa. Neither is good at all. A stable (or slowly growing) operating margin is best; so is a stable ROA, for very similar reasons. Without the performance test, I wouldn’t have come to these conclusions.

You write, “Why is a 20-stock portfolio likely to be less error prone than a 5 stock portfolio? How can we develop a plausible hypothesis that it should be 20 and not 50 or 175? Whatever the results of empirical study, there are always reasons why the results were what they were.” Indeed, but when one of the reasons is simply randomness, a factor one should never entirely discount, a 5-stock portfolio is more likely to be affected than a 20-stock portfolio. In any ranking system worthwhile using, the companies that rank the highest are going to perform better than those that rank lower. In creating the ranking system, it’s therefore best to minimize the kinds of errors that arise from randomness by using a larger sample size than the one you’re actually going to be using for investing. I like to invest in about fifteen or twenty stocks at a time, choosing primarily from the top five to ten stocks in my ranking, which, since I hold stocks for a while, will change often enough to give me that level of diversity. But I’m going to run tests on the top twenty or thirty stocks rather than the top five just to make sure that one or two stocks aren’t wildly skewing my results.

As far as rebalancing intervals go, since we rely primarily on financial reports for most of our factors, and since those only change quarterly, doesn’t testing on a 3-month rebalancing model make the most sense? Perhaps if you’re using lots of value or momentum-based factors, in which price plays a huge part in the equation, or if you’re relying on market timing, shorter rebalancing makes more sense. But intuitively, I think a 3-month rebalancing interval is optimal, especially since the quarterly earnings report is such a huge factor in stock price changes. That way you’re sure to get an earnings report in every trial.

Anyway, the most robust model would probably be an average of models tested on the basis of a variety of portfolios varied in size, in rebalancing intervals, and in the length of time tested.

Yuval,

What you said is good. A very easy way to see if your results are better than random is to download the Excel spreadsheet under “Statitsics>Performance Stats>Monthly returns since xx/xx/xx” for weekly or monthly returns. If you want you can do this for a second port or sim.

You can then use Excel to do a paired t-test. You would compare the weekly (or monthly) returns to the benchmark or you could compare the returns of one sim/port to the returns of another sim/port.

As you know a paired t-test is generally more sensitive. You may get results when your t-test or z-score are not significant. And again, it is easy.

You can see an example of a live port below. The p-value (p=0.15) suggests that maybe I should just go back to investing in SPY, go to another port or perhaps watch this port closely: preferably over a predetermined time period.

This port has gone through a lot of changes and my Bayesian prior based on the sim is not bad so I will not bail on it now.

Marc,

I cannot tell you how much I agree with this. I am not sure of all the reasons Yuval is doing thus. But when I do this I am only hoping that the statistics confirm this. I am hoping my results were very non-random and that this lack of randomness shows up in the statistics. If I have used the DDM then perhaps the world will not turn upside down in the future and maybe the port will continue to work.

Still, I will have to make sure that the port continues to make sense in a rising interest-rate environment, however. And of course rising interest rates may not be the only thing that changes from my past sample that I have to consider. And something could change that I really just do not understand or think about: maybe some institutional investor has just started doing the same thing and will begin to affect the market, for example.

You are very correct in your points regarding past and future samples, IMO.

Regards,

Jim