I’ve been studying the performance of different ranking systems over different time periods with different numbers of stocks, and measuring the correlations of the results. I thought I’d share my conclusions in case anyone’s interested.
When testing a ranking system, test the top 150 stocks, not the top 10 or 20. In my tests I compared the backtests of a portfolio of 15, 20, 30, 50, 75, 100, 150, 250, 350, and 500 stocks using weekly rebalancing (with a decent rank tolerance) over various initial time periods to a test of a 15-stock portfolio over subsequent time periods. There was a low correlation for the lower numbers, but for the portfolios of 100 stocks or greater, the correlation was high, and was highest for portfolios of 100 to 150 stocks. See attached Excel file for a correlation matrix.
Use long testing periods. Six years or more is ideal. Three years gave me low correlations except when I used 500 stocks.
Use either weekly rebalancing or rolling backtests for the largest number of tests.
If a ranking system gives you very good results with 150 stocks over a long time period, it’s likely that the top five to fifteen stocks will perform best OOS. In other words, just because you’re simulating a huge number of securities doesn’t mean that they’ll all perform just as well–the top-ranked stocks still have a strong advantage.
In addition, I wanted to give some additional advice about creating ranking systems, based on hundreds of observations. I call this the used car method. These conclusions are entirely separate from my above observations.
A robust ranking system should aim to evaluate all possible investments on every criterion that matters to you. It’s the same principle as buying a used car—you don’t buy it based solely on MPG or brake condition or age or price. You take everything into account. This is a must for risk management.
Break down your factors into components and use as many points of view as possible. Ranking on PE and growth may be better than ranking on PEG. Ranking on asset turnover, profit margin, and assets to equity may be better than ranking just on ROE. Ranking on four different growth measures, four different value measures, and four different ways of looking at free cash flow is probably going to work better than just using one. Don’t be afraid to assign low weights to ranking factors—the more factors, the more robust your results will be. There will be companies with high free cash flow margins and low free cash flow yields, or vice-versa—why not use both measures to be on the safe side?
If you have two different ranking systems that both work well, combining them into one ranking system using average weighting will usually perform significantly better than investing equal amounts in both systems.
To minimize risk, minimize risky investments. Diversification leads to diworsification, to use Peter Lynch’s term. Think of it this way: you are going to choose some used cars to buy from a lot of 200, and you have a comprehensive evaluation system. Which will be riskier, buying the top ten or the top fifty? If your evaluation system is really sound, and if you buy the top fifty, you’ll be getting a lot more duds than if you stick with the top ten.
Here is what you would really want to know, I think: If you ran an ANOVA test on the trades for each decile of your ranking system then is there a significant difference? Or alternatively, are the weekly returns from each decile of your ranking system significantly different. If so, what is the R^2? Actually pretty easy with Excel. I was doing something similar this weekend comparing the trades of several different ports to see if one port was truly superior to another. Just line up the realized trades or weekly returns for each decile next to each other and pull up the ANOVA test on the data analysis. It was educational.
Specifically I learned that it takes a lot of trades to find significance even for ports that look clearly different with very different CAGRs. But you don’t just want to know if it is significant. You also want to know the R^2. If the R^2 is low then your port may take a long time to show a profit as there is a lot of variance outside of that accounted for by your ranking system.
A linear regression with the R^2 will give you some information too.
My guess. The ranking systems with the highest R^2 and highest statistical significance will have a higher correlation to future performance–unless the market has changed.
You may think I am a statistics nut. Well, I am. But also I was doing my own sample problems after helping my daughter with her college statistics class.
I love statistics too, but I’m self-taught, so running an ANOVA test is completely beyond me. And it isn’t clear from your post what R2 (I prefer running simple correlation tests since R2 will convert negative correlations into positive ones) you think should be run. A linear regression of what exactly? I’d love to hear your ideas. Maybe I should be running more decile and ventile tests.
I did not really get ANOVA until this weekend. To make matters worse there is a between-group ANOVA and within-group ANOVA.
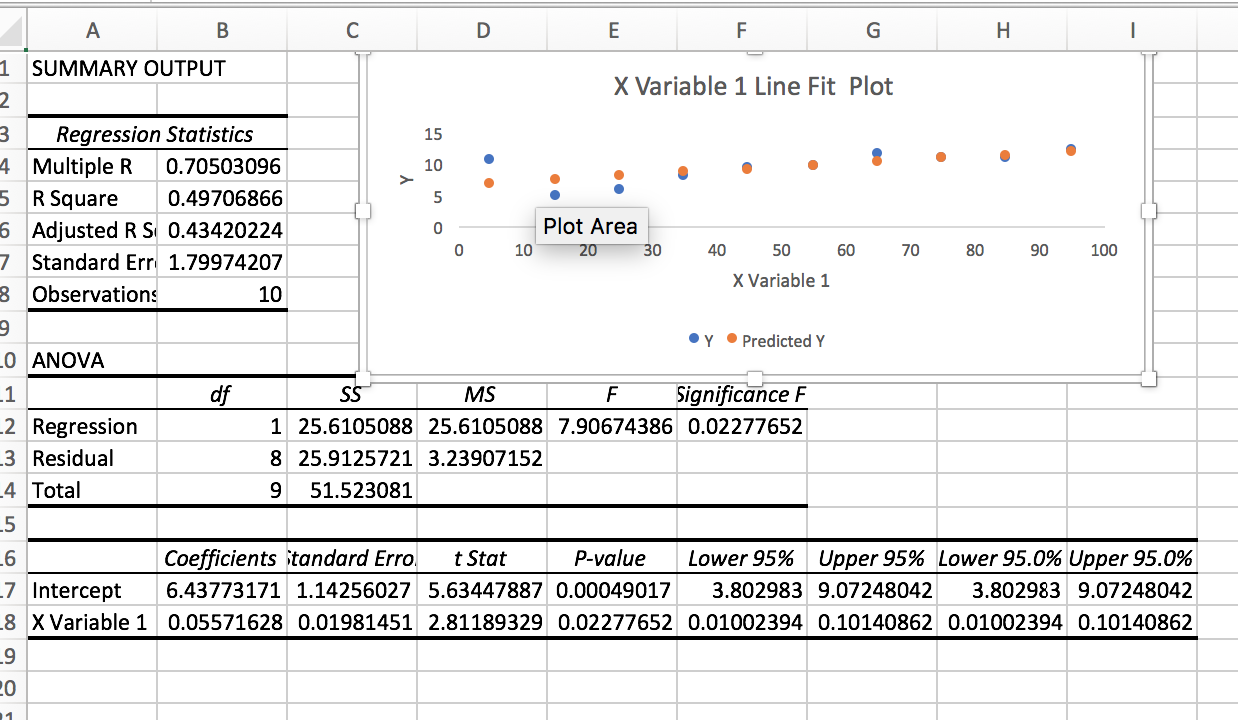
With regard to linear regression, the attachment is the regression of a 10 bucket test of the Prussell 3000 universe for the P123 Basic: Momentum ranking system.
I contend that a better p, Better R^2 and better X Variable 1 coefficient will have a better correlation out-of-sample. Not tested; just my conjecture for now. Done on Excel.
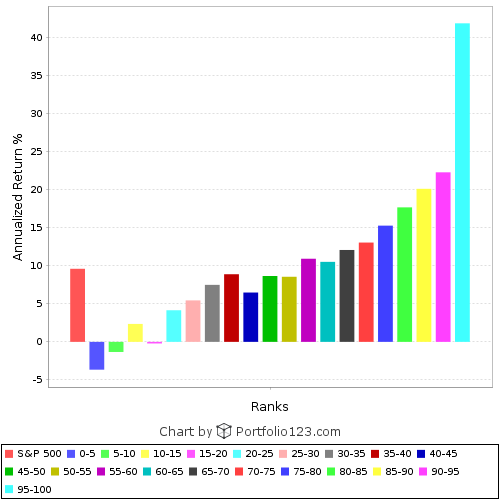
Ah, now I see what you’re saying. It’s an interesting conjecture. But when your ranking system produces results like this, a linear regression won’t give you a very good fit.
Yes. Part of the reason for the ANOVA. No linearity assumed just a test to see if the buckets are significantly different statistically and an R^2 can be calculated.
Also one reason for 10 buckets. This can be reduced somewhat by placing the Z-score rather than the percentile on the X-axis. It becomes more linear with the Z-score but obviously it will not make this system linear.
I have been using it for this question. I have 5 ports of a similar style. 2 are doing better than the others. One is doing particularly well. Should I start transferring money to the better performing ports? Turns out the best performing port is statistically better. But the second best port is not significantly better than the others. I have tested this in several different ways (including t-test) and I have already begun transferring money but only to the best port.
You just now got me thinking about whether the buckets are really different in a ranking system and if so the R^2 of the ANOVA helps determine how much of the variance is explained by the ranking system. Magnitude is important too, obviously.
So my finding for the ports was that about 6% of the variability in monthly returns was due to the port (the R^2). This is comparing ports with a similar style. Seems like a small number but it has been adding up.
Interesting post! Thanks yuvaltaylor and Jrinne for sharing your knowledge. If statistical tests could use the transactions to predict OOS results, it would be great if P123 added it as a standard output to improve returns for all members and help users pick better R2Gs.