He everyone! I am trying to create a formula to calculate the 5-year low of the Price to 5Y average earnings and then plot this against the current 5-year low in the fundamentals page of stocks. Can anyone assist me in this. Thank you! ![]()
The 5-year low of price to 5-year average earnings is fhistmin(“price/epsexclxor5yavg”,130,2).
In a fundamentals chart you can click on “formula” and add that formula there. The current value will be on the right.
I haven’t tested this, but creating a formula something like this should give you the low price for a security over the past 5 yrs
$Price_low_5yr:
Min(PriceL, FHist(“PriceL”,52), FHist(“PriceL”,104), FHist(“PriceL”,156),FHist(“PriceL”,208))
For earnings you could use something like EPSExclXor5YAvg or calc the average eps over your 5 yr time range if you want something different.
Again, I haven’t tested the PriceL above to make sure the ranges of time are working, but I think that approach may get you there for a 5yr low.
Thank you @SpacemanJones.
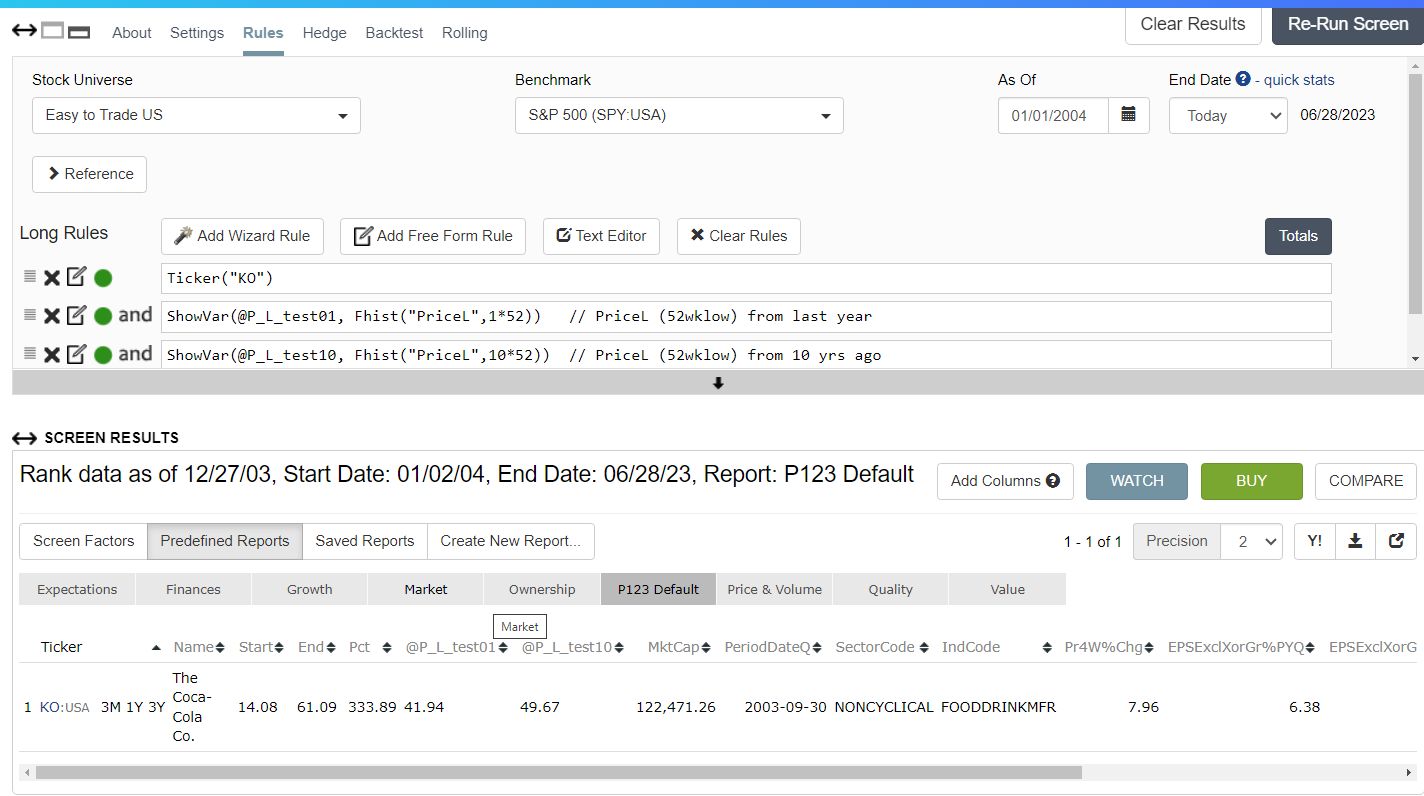
Unfortunately it doesn’t work. The part of the formula FHist ( “PriceL” ,XX), does not work as intended (go back XX weeks and take the preceeding 52 weeks low into consideration. The results I get on a graph point to erroneous prices (for example I tried FHist ( “PriceL” ,52) on Coke (KO) and I get that its lowest price in 2003 was $41.14 on March 10, 2003 which is definitely incorrect. The rest of the plot is also incorrect in a similar way - i just get a rangebound curve). The function PriceL on its own works well though, but the lookback is only 52 weeks. Anyway, thank you for trying to help!
Thank you @yuvaltaylor. I tried it but unfortunately it does not work. I tried
fhistmin( “Price / EPSExclXor5YAvg”, 130, 2 )
But unfortunately I get similar results to @SpacemanJones formula. Prices going back 20 years are incorrect. But thank you for trying to help!
For some reason with a lookback array using Fhistmin or FHist, the results are not the intended ones. A standalone function though (PriceL) works ok but the lookback is too short - 1 year.
I’m just thinking out loud here - but I’m wondering about split/dividend adjustment - I do recall conversations in differences in split adjusted prices vs. actual prices at the time - and I am a bit rusty as I haven’t done serious significant formulal building in a while - but that pops into my head as possibility if prices are off going back in time. Again - I’m just totally thinking off top of my head - I haven’t tested anything - but it makes me wonder if split adjustment or dividend adjustments are contributing.
====
edit: PriceL indicates it is a series adjusted for splits/dividends. If you want unadjusted there is the Price series that you may be able to work with.
I’m pulliing from this reference. You may already have this link, but if not maybe useful info here:
https://www.portfolio123.com/doc/doc_index.jsp?vocabType=&cids=&what=P
Prices are adjusted for dividends and splits. That’s why some prices appear to you to be “incorrect.” In addition, the formula I gave you checks the price every two weeks, not continuously.
If you need something more exact, let me know and I can probably figure something out.
I didn’t mean to, but you got me curious so I did a small test, lol. ![]() Very rough - just eyeballed things
Very rough - just eyeballed things
Used KO as ticker.
https://www.portfolio123.com/app/screen/summary/284501?mt=1
Did PriceL one year ago and ten yrs ago for KO. Prices returned were 49.74 and 25.58. Roughly match yahoo’s historical numbers although I didn’t look for precise.
Fhist() looks like it only goes back maximum of 10 yrs (520 wks) - won’t accept input larger than 520, so if using that be aware of lookback limit to fhist() approach. I didn’t test anymore, but hope this is helpful…
All the best,
FHist is only needed for five years in this case. If you use it with an as-of-date in the past it’ll look over the five years prior to the as-of-date, so it actually looks back in a backtest a long time.
Hi Yuval, I mentioned 520 wk in fhist because OP mentioned a KO quote from 2003, so wasn’t sure how that number was arrived at, whether in backtest or some other way. I couldn’t think of how I’d get that number. edit: When I run the screen I linked w/ as of date 6/28/2013 the 52wk low from 10 yrs prior (@2003) comes to 13.91 which I think from memory is in ballpark of what I’d expect, but haven’t checked. (edit2: I was remembering a numer around 11 and just checked, so maybe this 13.91 is bit higher than I expected, but don’t know if there are reasons to trust yahoo over factset and I’ve never really looked into matching any of it. Maybe my timing is even off).
… I kept messing around with that screen and was able to generate a 41.94 priceL for 2003 timeframe.
edit: seems like with older as of dates something different may be happening w fhist. As of date 2013 seems to be ok, when i change to 2008 results become unexpected. just my experience
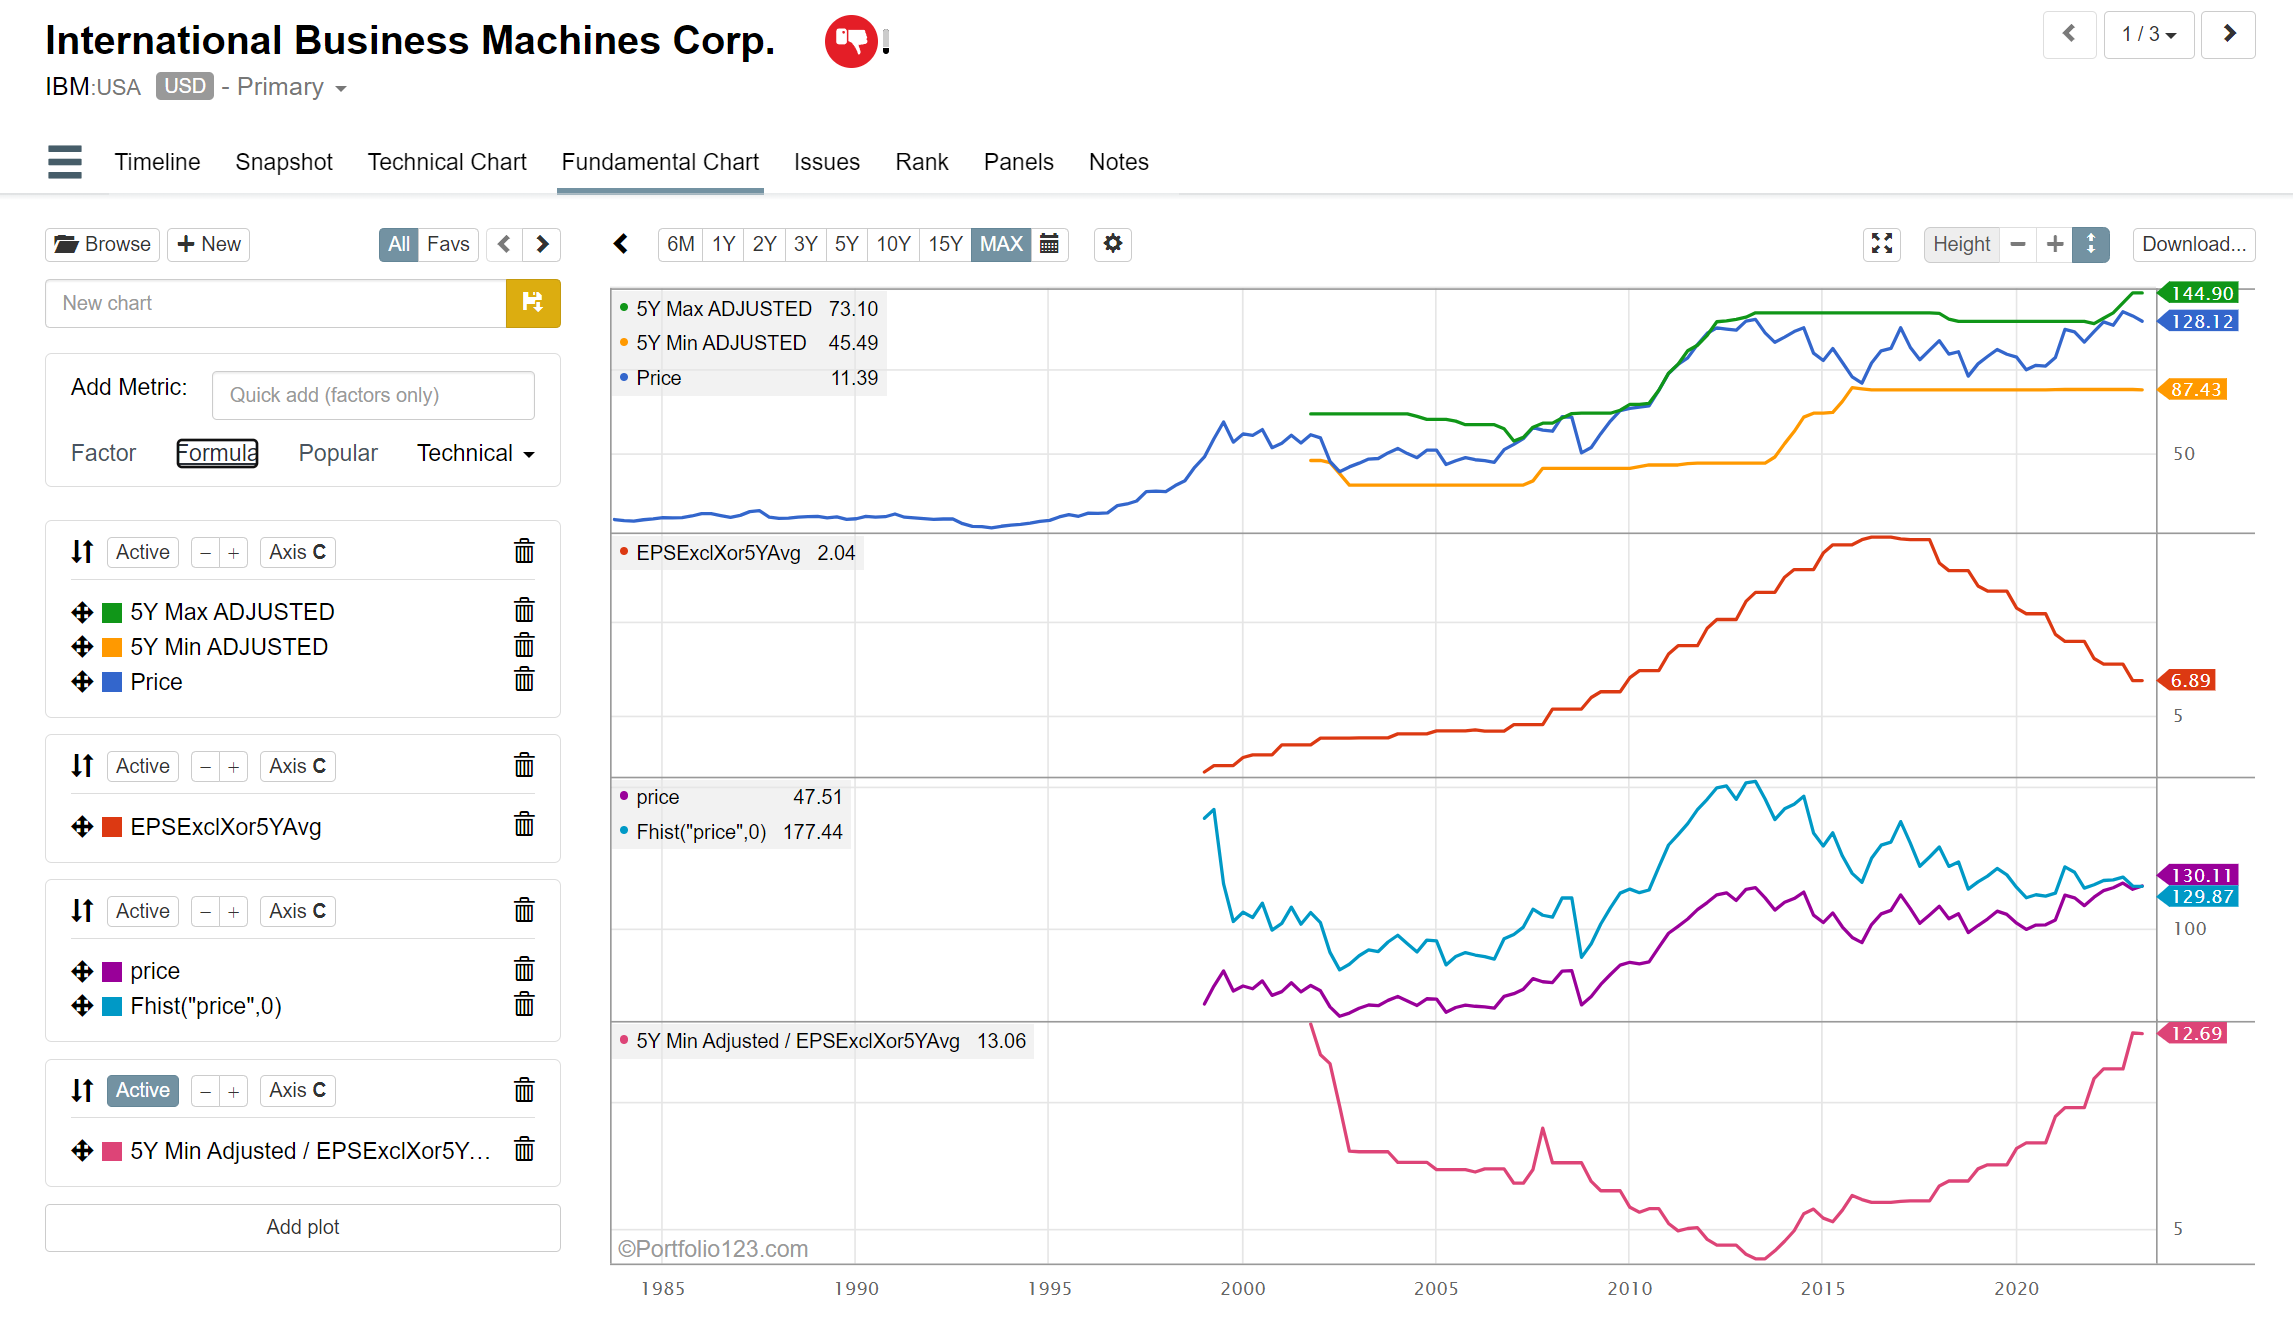
FHist functions need to be tweaked to be usable in the Fundamental Charts. A little background:
The fundamental chart shows data fully adjusted for all splits and dividends. This was done so that things like # of shares are displayed as a continuous series even when there are splits. However, FHist functions operate like they do in the screener: in the past they output historically adjusted values.
You can easily see the effect in the fundamental chart below. IBM pays dividends regularly so past FHist(“Price”,0) are higher than Price, and they converge to the same value only in the recent data where there are no future dividends. NOTE: Price is the same as Close(0)
We will have a fix for FHist used in fundamental charts this week
In the meantime , to do what you want , you can adjust the output of Fhist as follows:
For the 5Y Min/Max Price (ADJUSTED) use this:
FHistMin(“Price”,65,4) * Price/FHist(“Price”,0)
FHistMax(“Price”,65,4) * Price/FHist(“Price”,0)
I used 65 samples every 4 weeks which works out to 5Y (13 samples each year).
For 5Y Min Price / 5Y EPS Avg use this:
FHistMin(“Price”,65,4) * Price/FHist(“Price”,0) / EPSExclXor5YAvg
NOTE: Once we have the fix for FHist in the fundamental chart you no longer need to adjust it yourself and Price/FHist(“Price”,0) will return a 1
Is this what you seek?
One problem is that there are two ways to interpret this request. It could mean the 5-year low of (the price to 5y average earnings) (which is how I interpreted it) or (the 5-year low of the price) to 5y average earnings (which is how Marco interpreted it).