Dear All,
There was a problem using FHist in the Fundamental Chart that was reported in Calculate and plot of a customised 5-year low of price to 5Y average earnings. You no longer need the workarounds mentioned in the post.
Briefly, the fundamental chart is a “Point in Time” chart but shows values fully adjusted for splits and dividends so that things are “smooth”. This was not working with FHist which resulted in this:
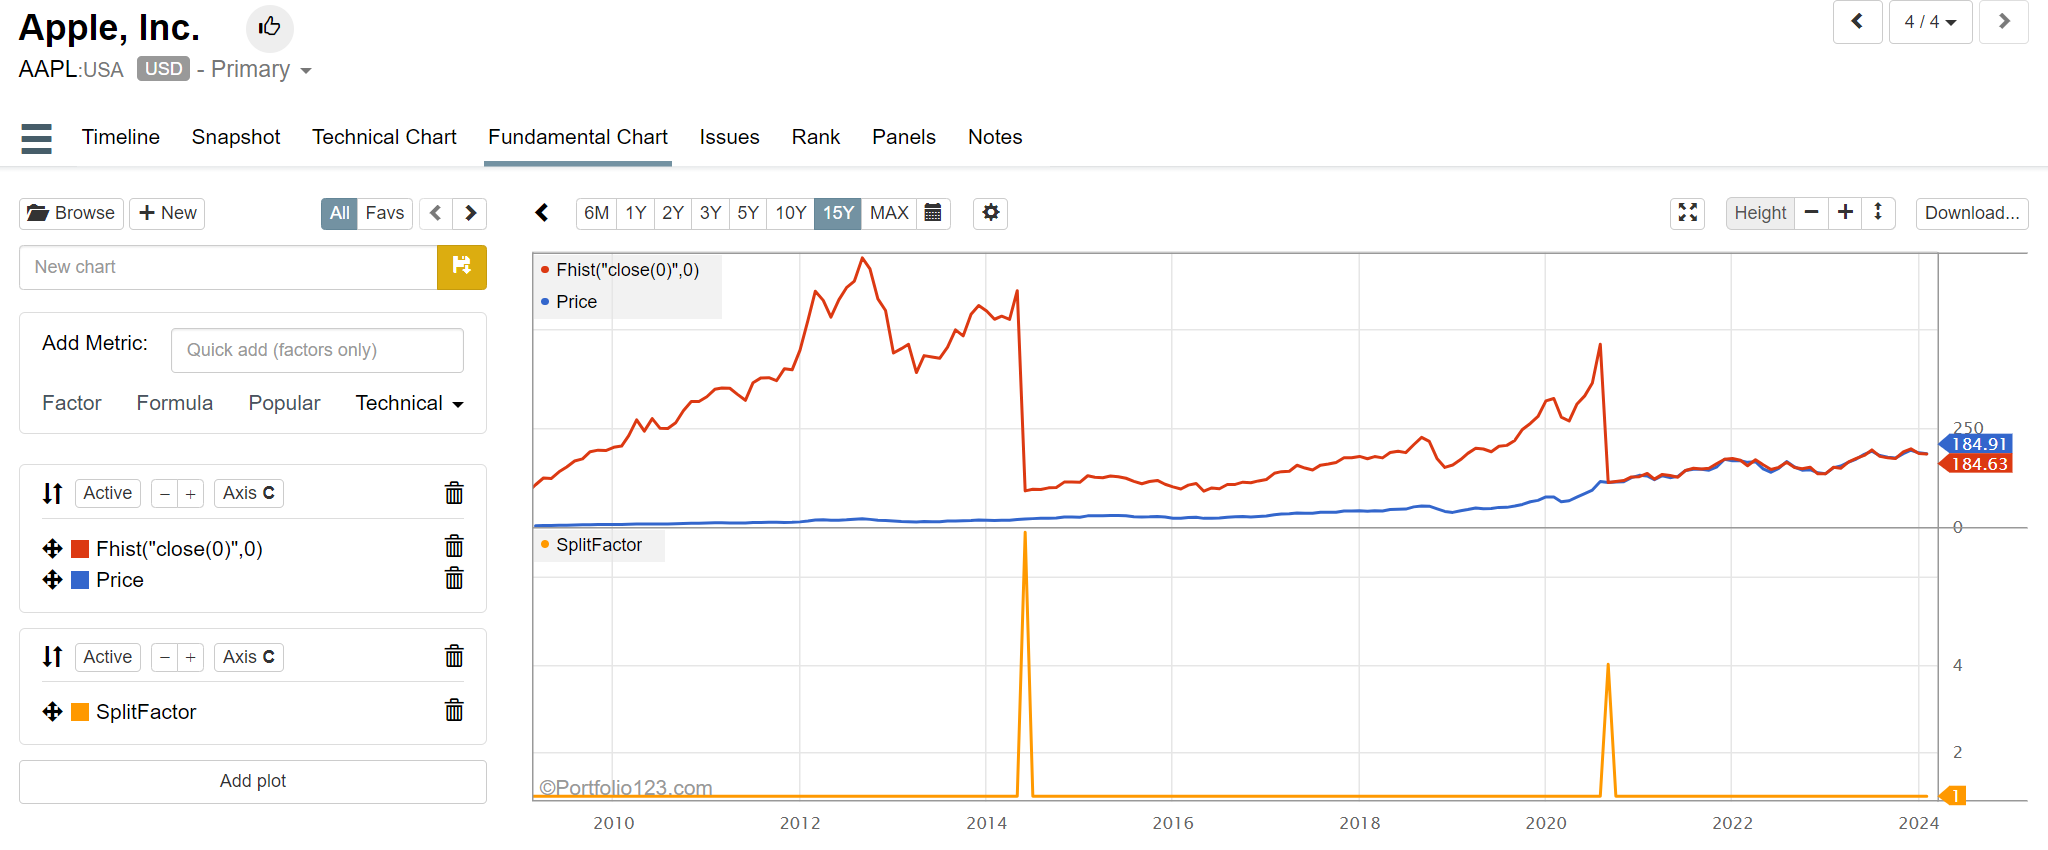
The red line is FHist(“Price”,0) which is point in time and therefore shows big jumps when AAPL split.
This has been corrected and now looks like this
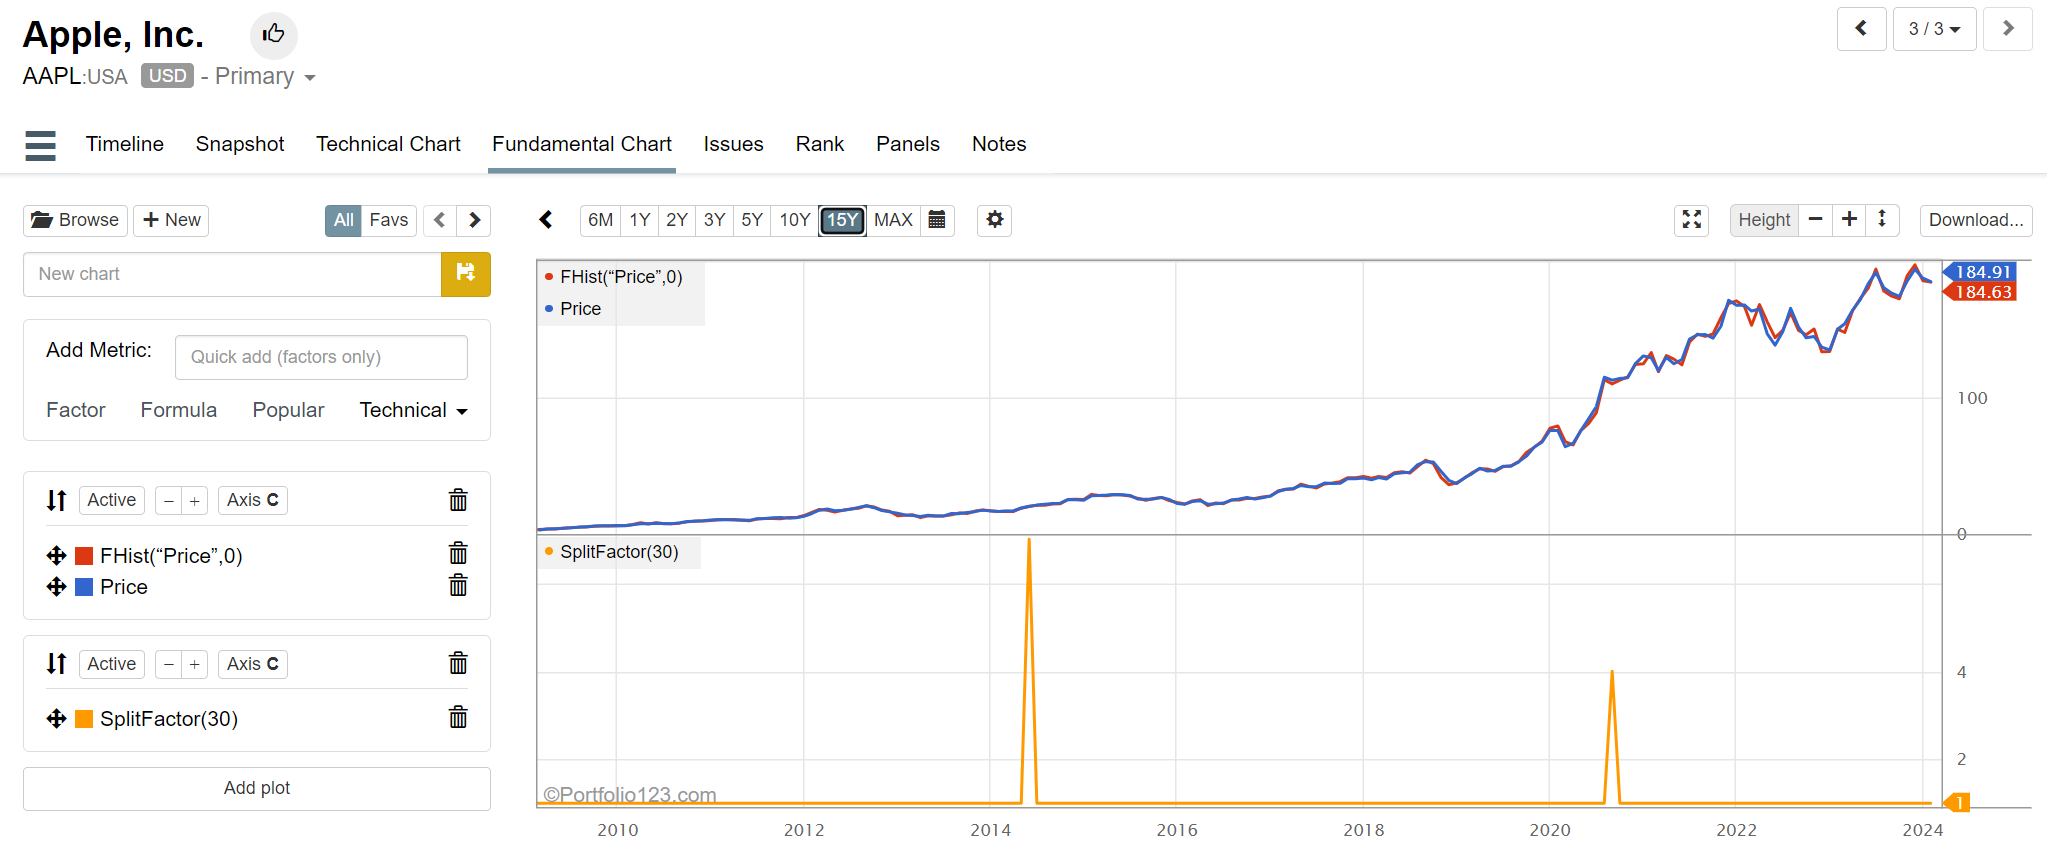
This should make it easier to plot complex formulas in the Fundamental chart w/o needing the workarounds.
Thanks
PS. We also added FutureDivSplitfactor and FutureDivFactor to complete the set with FutureSplitFactor in case you want to see point in time values in the fundamental chart.