Mgerstein/Experts,
Expert’s comments using STOP LOSS (at Sell Rule: GainPct < -10) on deep value system is appreciated.
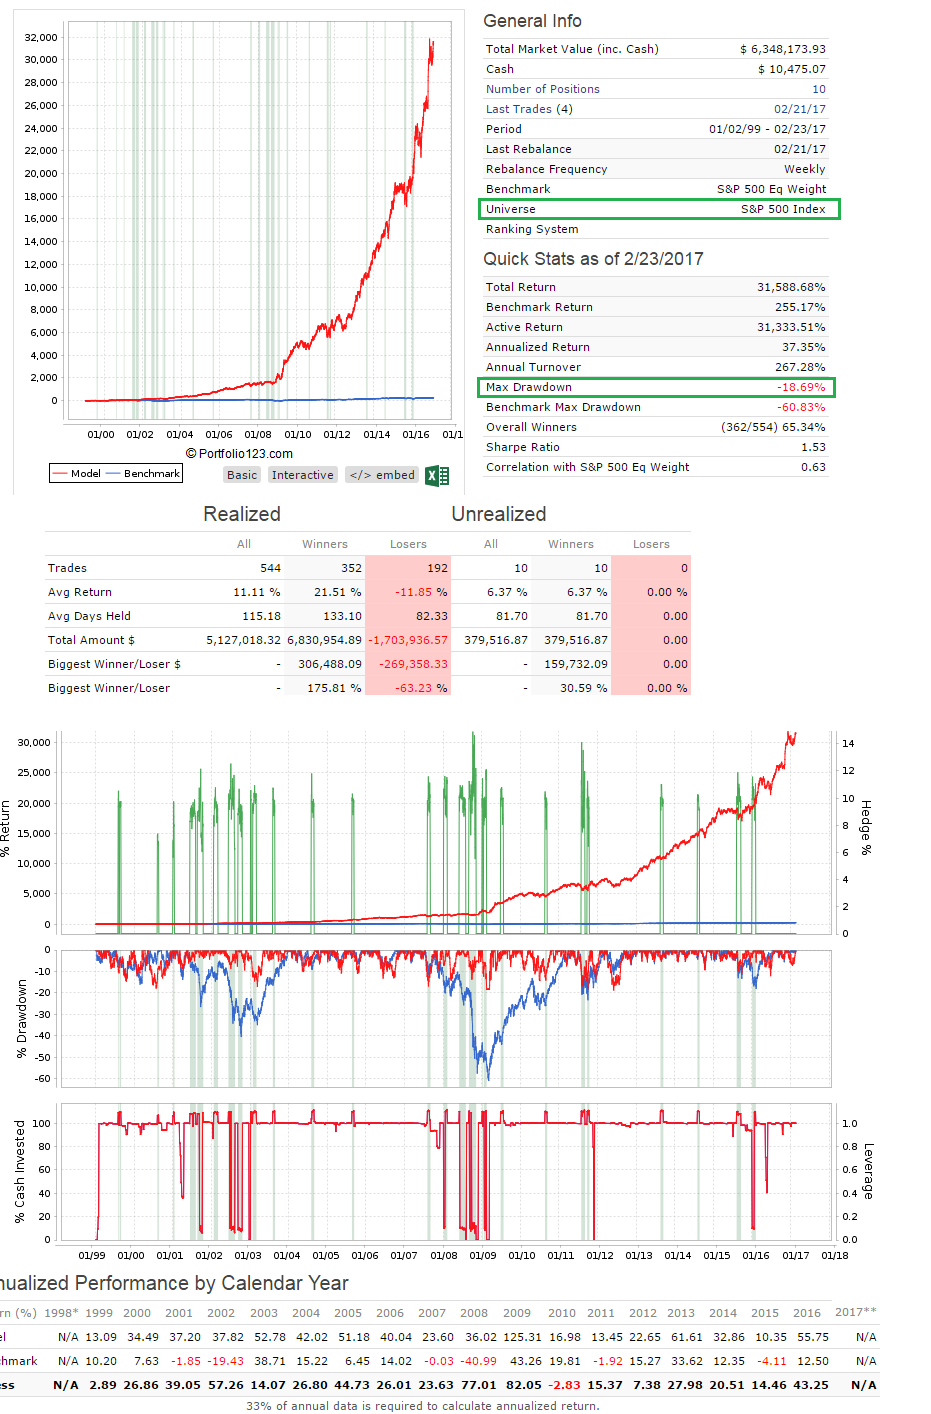
The stop loss is executed on Monday in the attached simulation screen using the Sell rule.
Thanks
Kumar
Mgerstein/Experts,
Expert’s comments using STOP LOSS (at Sell Rule: GainPct < -10) on deep value system is appreciated.
The stop loss is executed on Monday in the attached simulation screen using the Sell rule.
Thanks
Kumar
Hi Kumar,
I don’t think Stop Loss is a valid way of reducing your big losses, and here’s why:
Imagine there is an earnings report at 5 pm with bad news. You have a -10% stop loss and the stock opens the next morning with -20% lower price compared to the previous day. Your broker will execute the trade following the stop loss rule, but the only price the system can get is the -20%. So the stop loss didn’t work…
Even worse, imagine the stock rises back to a level -5% at the end of the trading day. Then you have sold the stock at the worst time, while a hold strategy would not have created nearly as much damage.
Testing I’ve done in the simulation confirms that stop losses, although great discussion topics in seminars and blogs, don’t work in real-life markets. Sevensisters’ post above outlined a very realistic scenario, one that happens a lot.
You can never ever never never never protect yourself against big losses in a stock through a long-only model. You can get some protection on a portfolio level through a model that aims at low volatility factors and has reasonable diversification.
You can get protection on a portfolio level through broader asset diversification (although you can’t use testing to help you evaluate this because the great diversifier of the past 35 years, fixed income, no longer has the same role – but it can do so in different ways going forward – flat or moderate declines as opposed to steady gains).
You can probably do more to protect your downside with market-neutral long-short modeling, where you aim to remove the market and profit from factors; that can be evaluated in the simulator. That can be important because a significant amount of the big volatility comes from the market, as opposed to stock-specific issues. This won;t protect you against the occasional company-specific thing, but with proper diversification, a decent number of holdings, and a good market neutral model, you can accomplish quite a lot at the portfolio level.
And of course you can enhance what you do on p123 through off-platform activities such as use of options; i.e. buy puts on potentially volatile stocks you own. You’ll cut into your return (through the premiums you’ll pay to get the puts), but you can recoup part or a lot of a 50% loss with profits on rising puts (but this will require a lot of off-platfdorm analysis lest you spend so much in puts that expire as to nullify your positive stock returns).
And you can experiment with on-p123 hedging; as with long-short, it works best against market volatility rather than stock-specific, but if you can’t/don’t want to deal with the extra work of options and don;t want to hold a ot of individual short positions this is something that can help you. (I’m talking about permanent always-on hedges, not market timing unless you have a model yopu beleive can be truly forward looking and not simply predicting the 2008 past).
Thank you for your detailed comments on stop loss usage.
My system not using stop loss as average holding time is between 3 to 4 months. ![]()
More holding time to recover.
I don’t want to explore option as it is high-risk game. many complex strategies; not just buy and sell.
Few months ago, i have started to experiment dynamic hedge 10% TZA. Here, screen shot for reference.
I will continue to work further.
Thank you for open ideas to stay with big loss position and reduce draw down in portfolio using a hedge.
Thanks
Kumar
This is exactly how I look at hopeful results from a model. I never commit a dollar unless I’m content with accepting half the Alpha and Double the DD.
As for filtering large losers. That’s not an easy answer. The way I see it is that you have to address where and when your losses occurred. Stats alone don’t tell you the entire story. What events may have triggered the loss, was it foreseeable? Did any of the other losers suffer from a similar situation? Was it market timing that held the brunt of the responsibility? There are many reasons why you end up holding a large loser but I also agree with Marc that sometimes that’s just part of the game and accepting large losses when everything else looks copacetic is something we all face. Hence the saying “don’t put all your eggs in one basket” ![]()
I am currently following 64 stocks (& a few ETFs) in 11 Ports used in my 5 accounts (IRAs, Joint, etc.). I ALLWAYS use stop losses. However, not to maximize performance, but to minimize drawdown and to protect capital.
In 1973 I was invested in a few mutual funds and 20 or so stocks. Due to the oil embargo and following recession in 1973 & 1974 the S&P 500 lost 48%, and I lost 35% in my funds but over 60% holding small cap stocks before I got out. It took me 2 1/2 years to recover (I missed the first 20% market rise before I got back in). Since that time I have used stop losses to protect capital.
That saved my butt in 2001 on 09/11 when many of my MicroCaps fell between 60 and 80% in less than an hour. I had a 30% stop loss on all my holdings and they were stopped out between 35 & 45% before I could even get my computer turned on (prices were falling so fast that the prices I got were below my stop). I was then able to sell the rest of my holding before they closed the market for trading that day. A loss of 40% requires a gain of 60% to recover, but a loss of 70% requires a gain of 233% to recover. The first will take a few years to recover, but the second will take over a decade.
So if using a stop loss causes me to forfeit a few % on my annual return, I’ll take that while trying to save my butt during the next major world disaster.
Denny/Mgerstein,
Believe, SP500 universe works different from Microcap.
Value stocks works different from Momentum stocks.
P123 stocks selection works different from other stocks selection system.
I am using SP500 price series and SP500 EPS trend to time the market; (no economic indicator, no individual pct gain stop loss).
It looks like my system works around 20% to 25% draw down; it recover 100% within 3 to 6 months each time after the draw down.
I will start another thread to compare our best model performance around 09/11/2001 event. ![]()
Thanks
Kumar
Instead of stop-loss orders on individual holdings (which seems geared towards idiosyncratic risk protection), how about addressing systemic risk with deep out-of-the-money put options on something like the SPY?
Walter
Much to my surprise, I’ve never found that any kind of stop loss increased performance in any way for any of my models.
Walter,
We can’t test option strategy; it requires some experience.
Hedging the model with 10% inverse ETF FAZ (strongest candidate in bear market) dynamically will be easy to follow and will have a p123 backtested edge.
I don’t have any experience in option; the only knowledge i have is; it is not for beginner;
and high-risk activity and stay away;
can illustrate with example how to peroform
deep out-of-the-money put options on something like the SPY ?
scenarios:
I buy and hold 100 SPY for 100 dollar = 10,000 dollars.
How to take option to protect this 10,000 investment (before taking put option; i am assuming all 3 unexpected scenario).
Scenario1:
SPY stay the same = 10,000 (Current investment remain) in 3 months because of unexpected flat market.
Scenario2:
SPY down 10% = 9,000 (Current investment become) unexpected downtrend in 3 months;
Scenario3:
SPY up 10% = 11,000 (Current investment become) unexpected uptrend in 3 months;
How the Just same put option will work in all 3 above 100% unexpected cases.
Thank you for sharing knowledge and experience.
Kumar
The inability to simulate option strategies in P123 shouldn’t preclude their use.
https://www.thefelderreport.com/2016/08/15/worried-about-a-stock-market-crash-heres-how-you-can-tail-hedge-your-portfolio/ covers some of the mechanics of using puts for tail-risk hedging. Curiously, it doesn’t mention portfolio beta. There are other articles on the CBOE website that do, however.
Since I’m working my way towards tail-risk hedging my portfolio, I’m curious about the general opinion of this strategy. The obvious downsides are initial setup cost and the cost and time of rolling the position each month. But what else?
Best,
Walter
Walter,
You are obviously an advanced trader. There are good reasons for protection for advanced traders.
But the good reasons are pretty complex involving volatility drag, optimal Kelly or plans to take money out of your account in the near future. Usually there is leverage involved. The leverage increases the volatility drag or puts you above optimal Kelly.
For many–including me in my SEP-IRA account that does not allow leverage—making a bet with negative expectations just reduces your returns.
It is like taking insurance in blackjack. It might make sense to take insurance if you got overly excited and have bet most of your stack. Otherwise, if you are counting cards and making smaller bets (less than optimal Kelly), you should only take insurance when the count says the odds are with you on the insurance bet. The insurance bet should be looked as a separate bet unrelated to your other bets.
That is the specific advice that Ed Thorp gives in his book “Beat the Dealer.” But then again, Ed Thorp made most of his money from the mis-pricing or warrants. He did short stocks while buying warrants for the same stock. So there is a place for this.
It may be a good idea for you. But most retail traders do not have enough of an edge to throw money away on bets that are expected to lose.
-Jim
Hi Jim,
I wish I had more option experience. So far it been limited to covered calls and long calls.
I agree that protective puts will reduce returns but only if they’re never needed. The popular analogy is insurance … like for a home or a large wager. One doesn’t buy it with the desire to actually use it - and it is a drag on your overall return - but if the consequences of loss are too great, it becomes a requirement. Tail-risk protection should be cheap now with volatility low. I’m going to look into it for my IRA.
Best,
Walter
Walter,
I fully agree on your insurance analogy. It can be useful to stop a loss that you cannot come back from.
And to make your point. I have insurance on my house and business but I never get the insurance when I buy something at Best Buy.
I should probably take a little time to quantitate just how large my tail risk is.
Thanks!
-Jim
So, I have been making claims without really looking at the numbers. I thought I would focus on one small aspect of the big picture. I thought I would actually look at the volatility drag of one of my ports and see how much hedging/options might help with this.
My understanding is that the geometric or compounded return = arithmetic mean - 0.5 * Variance. Where 0.5 * Variance is the volatility drag.
So for one of my ports I calculated: 100 * 0.5 (Monthly Variance of Returns)/(Monthly Arithmetic Mean). This should give me the reduction in my returns due to the variance (in percentage).
I get 7.41%
This tells me that even perfect hedging that reduces my volatility to zero will reduce my overall returns if it costs more than 7.41% of my average monthly returns (per month). I will spare you (and me) the calculus on this for a closer look.
This is, of course, based on backtested volatility which may not hold up in the future. And it is over a long period (Max). And it is my port, not yours. So this may not apply to you if you have a shorter time horizon, think volatility may be different in the future or if you use a different port (which I hope is the case).
And there are issues other than the volatility drag. Including the most important consideration: What will it take to prevent me from getting scared out of the market at the bottom? I do not mean to diminish the importance of the other considerations.
-Jim
Jim, I may be missing something but it seems to me that a perfect hedge that costs 7.41% of average monthly returns would reduce the returns by the same amount, rather than insure the average monthly returns stay the same. Unless the perfect hedge also compensates for the 7.41% cost. Just trying to understand properly.
Bob,
Thanks for the comment. Volatility drag is really hard to understand. And I think it is easy to find errors about this on the Web. For example, some of the Monte Carlo simulations do not get this right. Also, I am probably making some errors and would appreciate any corrections.
My assumptions are pretty simplified. But the most we could expect from any hedge (even a dynamic one) is that we would reduce the volatility to zero. This would mean no drawdowns whatsoever.
The only other assumption is that there is some cost to the hedge. For some there may not be a cost. Professional may be shorting stocks and hope to make a profit (not a loss) on the shorted stocks. But if you have a constant hedge or continue to buy puts in all types of markets then there will be a cost in a market that grows over a long period.
P123, being as great is it is uses annualized returns. This means they are using the geometric mean of the returns (or log returns). There is no volatility drag with geometric returns. Or more accurately, the geometric returns include the information about the volatility drag.
When you use average returns then what you actually get as far as returns is: Arithmetic mean -0.5 (Variance). Google volatility drag and leveraged ETF for over 78,000 hits on this. It is a real issue.
But the equation shows you that if you can reduce variance you will increase your annualized returns. But to be beneficial to your bottom line it has to cost less than the benefit you receive.
In very smart hands using hedging will improve returns. Especially if these investors use leverage which increases the volatility.
I have calculated a limit to the benefit of hedging for me. In my case and in my port, any hedging method that costs more than 7.41% of my average returns will cause me to lose money—given certain assumptions.
I can use this to see if options or constant hedging would help my overall returns.
Sorry, probably about as clear as mud so far. I am happy to try again or answer any specific questions to the best of my ability.
-Jim
I fully understand the difference between arithmetic and geometric, or compound, returns and your desire to reduce or eliminate volatility. What I don’t get is the calculation of a maximum cost related to the pre-hedge variance or standard deviation of arithmetic returns. If it is true that a perfect hedge will eliminate all variation, then it must also offset it’s own cost. If that holds, then it would follow that the cost of the hedge is independent of the non-hedged volatility. In essence, it would not matter how much the hedge cost as long as it covered its own cost plus the desired variance offset.
Bingo! This is the essence of successful hedging.
Yes. A matter of different definitions or poor wording on my part, I think.
Let me start over. If I found a hedge that reduced variance to zero. How much would that hedge cost me?
In my search for a hedge, with my limited abilities, it would cost me. Trust me on this. For example, putting a constant short on SPY would cost in the long run. I could try to time the hedge. But with my limited market timing abilities it would end up costing me. There is no reason to think I will ever come up with a good, low-priced hedge in my lifetime.
And a zero cost hedge? Forgetaboutit! Not me anyway
So there is no perfect hedge. Not for me.
But if I got very lucky and had a period with no variance, then even under these great circumstance I would lose money if the cost of shorting SPY was more than 7.41% of the average return of my port. This is the best case. In practice I would lose even with a lower cost hedge because I would never reach zero volatility: not with my limitations.
And I agree if you put the port and the SPY short into a book the number might be a little different than 7.41% but it would be close.
All this does not apply to those who short specific stocks and make money on the shorts. Hmm… Maybe I should try that: see above regarding my limitations.
But Walter says puts can be low cost. So maybe there is hope for me. I am not holding my breath but maybe. It would, I think, have to cost less than 7.41% of my average returns for those puts is all I am saying.
So maybe. And maybe I do it anyway just because I do not want to take a big loss—even if it does cost me a little bit. Walter is probably on to something. I just want to do the math before I do it.
An equivalent way to express most of this in very few words is: I think I am way below optimal Kelly in my non-leveraged ports.
-Jim
This discussion took a very interesting turn.
I will just add that the I used to be perplexed at volatility drag, but it turns out that volatility only exists due to the percent metrics we use, because expected returns of random normally distributed stock price follow a Weiner Process.
E*(S_T) = S_t + mt + sZ*sqrt(t)
so:
E*(Ln(S_T/S_t)) = Zs(T−t)^.5+m(T-t)
therefore:
E*(S_T/S_t) = e^(Zs(T−t)^.5+m(T-t))
which should be familiar because:
(S_T-S_t)/S_t = S_T/S_t - 1 = “percent change”
where:
E* is the expected value;
S_T is the terminal price
S_t is the initial price;
Z is a random Gaussian variable;
s is the variance;
T-t is time elpased; and,
m is the logarithmic drift (i.e., instantaneous rate of return) equal to the mean - .5*variance.
Another way to think of this is that you cannot add percents together because the denominator changes. When you are measuring instantaneous change, the denominator changes instantaneously. However, you can add logs of the same base together because math.
So, volatility drag only exists because we measure things in terms of percent returns. If we were to look at logarithmic returns, volatility drag would cease to exist. Although I acknowledge that it is impossible to actually measure instantaneous rate, this is what the “root time” volatility model are built upon. So, it’s a model…