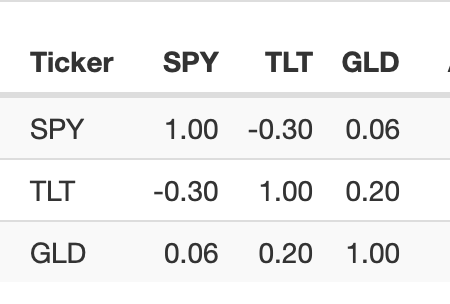
For anyone interested in the correlation of assets here is the data on SPY, TLT and GLD. As you can see GLD has very little correlation to SPY and TLT has negative correlation.
This can be done for free at Portfolio Visualizer. But also P123 data can be downloaded and this can be done in Excel or with Python.
My point here is that you can do this with your ports too.
Even those advocating strategies of long-only-stocks are often well aware of the correlation of their strategies. You may find–in retrospect–that some members changed their strategies (based on the strategies correlations) without sending you an email. Or maybe they know their strategy has alpha and can take a short-term drawdown. But make no mistake, most people at P123 know the correlation of their strategies and many members act on that information. Often with additional data, additional methods, and discretion which I am all for.
Thank you. Can you also show people specifically how to do that with the historical holdings of their port/sim?
Perhaps through books? I do not use books because of the errors that gives when adding cash to ports.
There have been multiple feature request to which P123 has replied if there are any questions about this. It may have been fixed. I might have missed that post.
Some people really serious about this will not use SPY as a proxy for the port but will use the port itself instead. So it is a serious question.
Thank you. That is an excellent idea that would broaden the discussion on risk I think.
Is this an example of what your are considering? I am not married to any single idea. I am married to a broad discussion on the topic.
And again, ideally, one should be able to do that with ports without having to upload data to Portfolio Visualizer or Python. Even if building a portfolio was never a priority at P123. As it is a book of ports can be wildly misleading when cash is added. Unless I missed that this has been fixed.
Jim,
I was thinking of dumping a sim/port transaction data, making a few format edits and then uploading the result into an aggregate series. From there one can run a correlation against $sp500, for example.
I’ve done the aggregate series build before. The correlation factor will be new.
This is all a bit of a hack and not nearly effortless. Oh, well.
Walter
EDIT: Thinking about it more, that plan is more than what’s needed.
Ok, that was a failing idea. Using transaction data to build a Universe just provides the port/sim constituents over time. That’s not enough since I also need allocations. And even that may not be enough, since I really need the equity curve.
Or just upload each series, for industry or sector or whatever, into Portfolio Visualizer on Pyportfolioopt (Python) until P123 develops a different understanding about risk than it seems to have now.
P123 is free to correct me or expand or just add more risk management tools at any time. But you might just use an outside source–especially if you add cash to your ports. New tools, or expansion of the present tools, or fixing the old tools could take a while. P123 is free to make the business decision to ignore much of professional finance if it wants. I have no problem with that.
There are outside tools for people who want to use them and there is nothing wrong with P123 specializing.
As was pointed out in another thread, we offer a correlation matrix. Simply enter the command ShowCorrel([period],[samples]) in your screen and you’ll see it.
Is a covariance matrix preferable to a correlation matrix? The covariance can be easily derived from the correlation by mutliplying the correlation by the standard deviation of the two stocks, using the same period and samples as the correlation measure. If this is unsatisfactory, please let me know. I’m also curious how you use the covariance matrix; to me, it’s not as intuitive as the correlation matrix, but I’m sure I have plenty to learn.
I’m not sure which one is preferable. Correlation is derived from covariance so I think it’s application is broader for what we are trying to do. We can use our own forecasts of volatility to determine the degree to which they vary. CoVariance is of paramount importance in financial markets so I just don’t understand how these values aren’t used as inputs into our models. Showing a small correlation matrix in a screener is akin to have rankings in a screener only, i.e. no portfolio or sim functions.
A big area of research is forecasting volatility and direction. You need independent forecasts to arrive at an optimal portfolio. Correlation just stuffs them together using historical data and normalizes it.
The last time I used an IB backtest it had a a couple of simple weighting options for the stock holdings based on the correlation matrix (and volatility).
So this is far from a radical idea unless IB is to be considered radical in some sense. But in addition there are hedge funds who have talked about using this. Not to mention the use of beta for decades to determine the weights of assets by the most boring institutions and mutual funds on the planet.
Korr should be given credit for presenting a mainstream idea in this forum while P123 simply says they are not going to do it. No ridiculous debates about the potential value of this of this for some investors using quantitative strategies (or even classic strategies at financial institutions), please.
Riccardo has designed a new feature for optimizing ETF portfolios using covariance matrices, and we hope to implement it around the end of the year. Please go to the Trello board https://trello.com/b/KUhwBd6g/portfolio123-product-roadmap and vote for the various projects there. I’ve just added this one to the Brainstorming column as “Portfolio ETF Optimizer.”
Thank you. Curious why this is not being done across all securities in the p123 database? I’m sure there must be a good reason just don’t know what it is.
Hi, I was checking in to see if there was an update in having this correlation matrix / optimizer / covariance matrix available for simulations? Thank you.