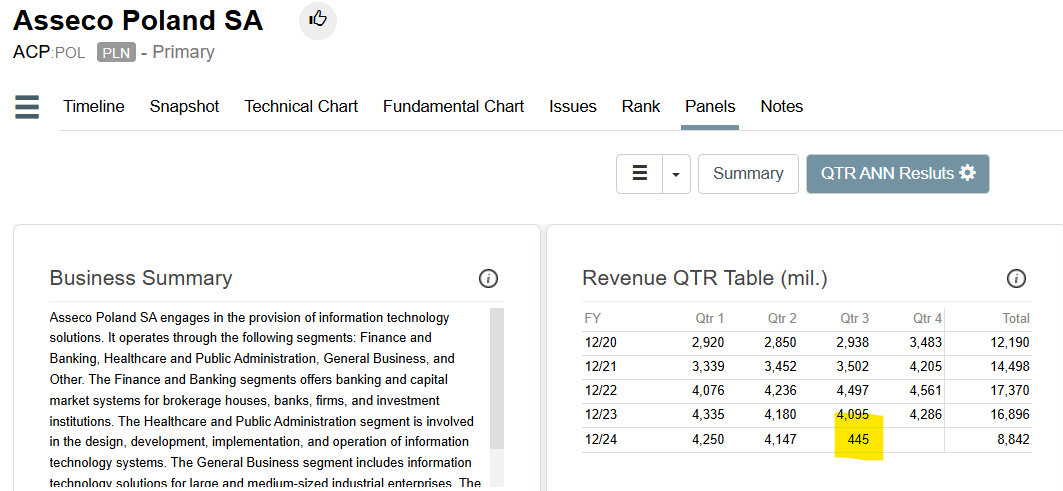
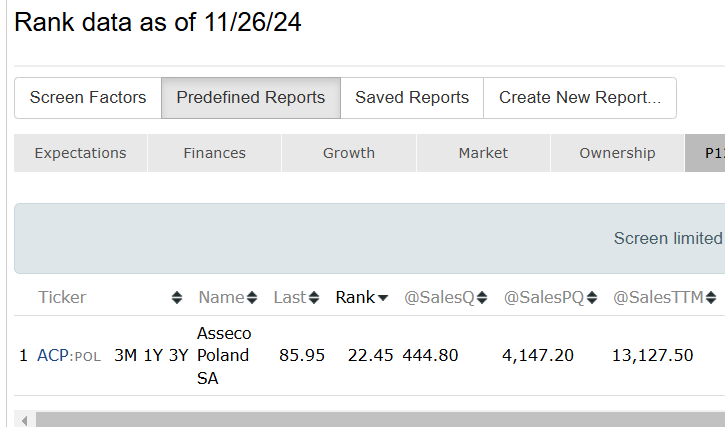
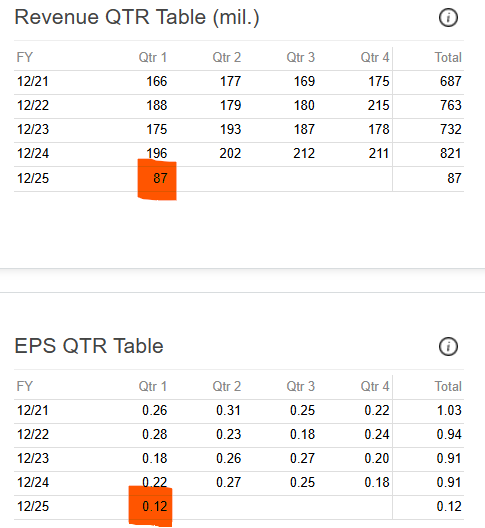
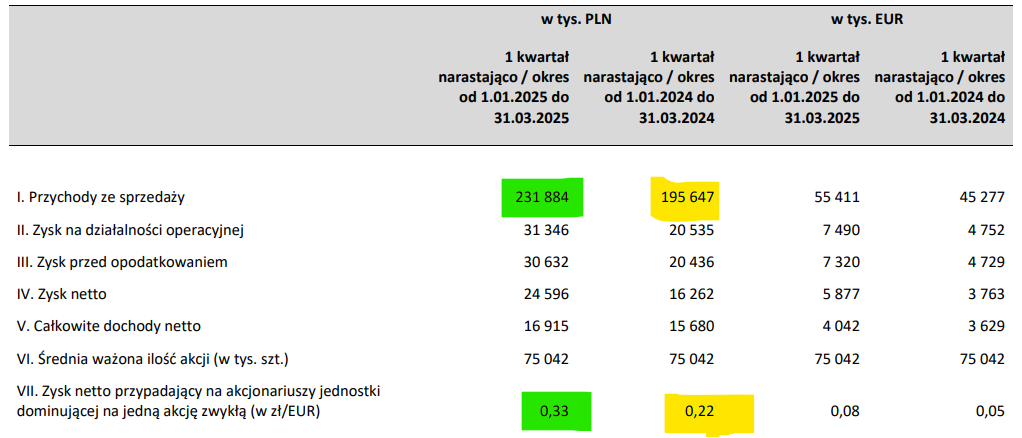
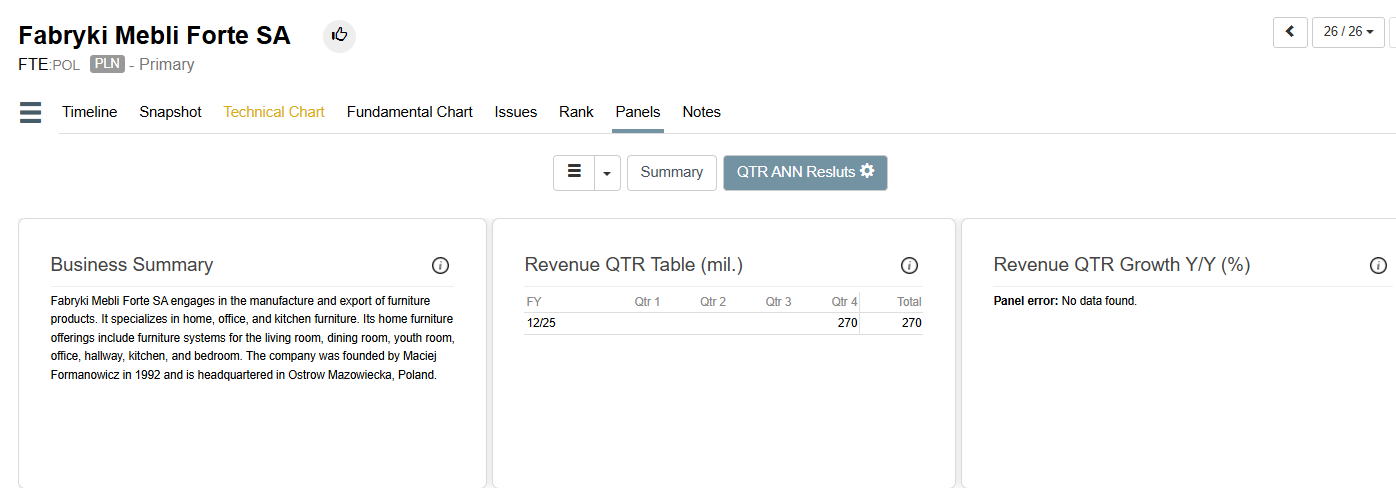
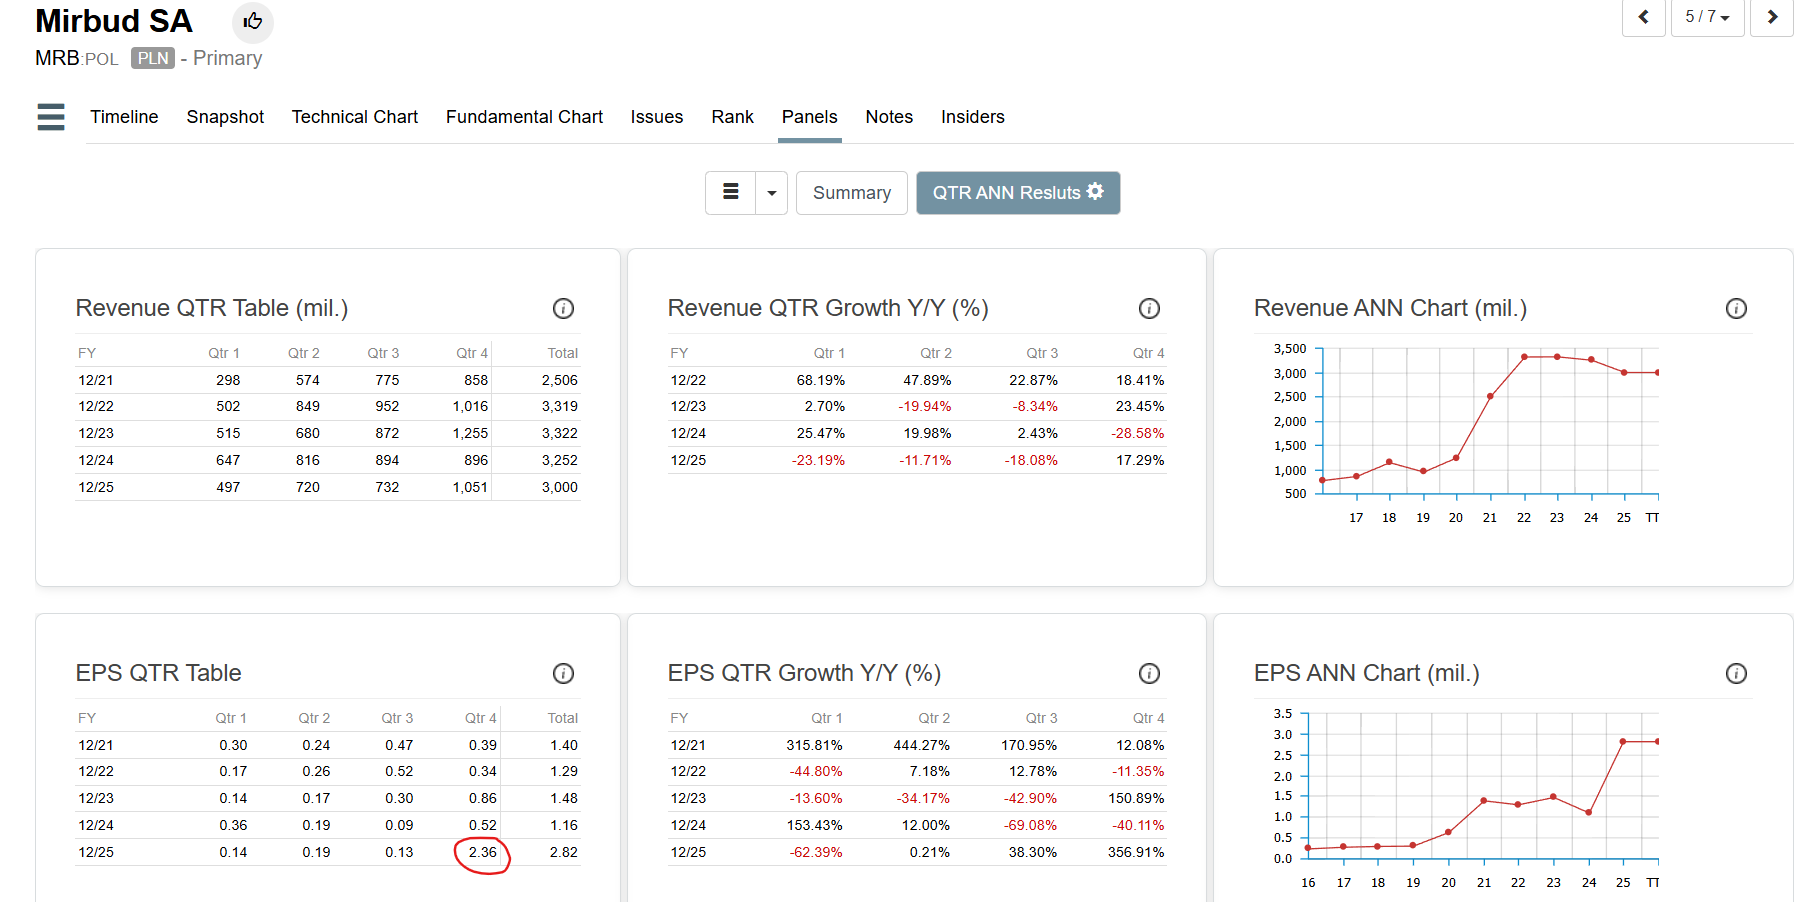
Found this incorrect period for one stock:
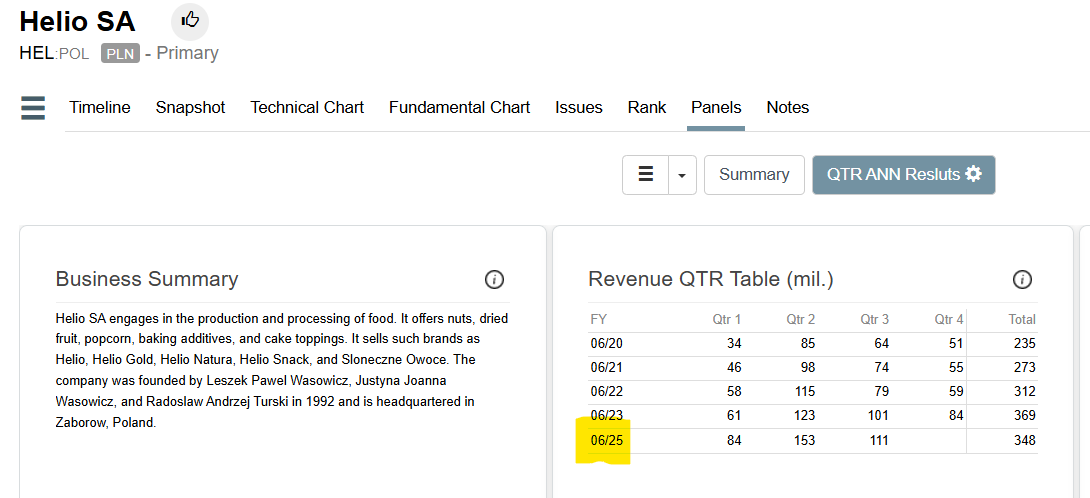
and this one ... ACP has not yet published 3Q financials.
I'm also looking at a European company and I have some trouble understanding the financials compared to what FactSet reports.
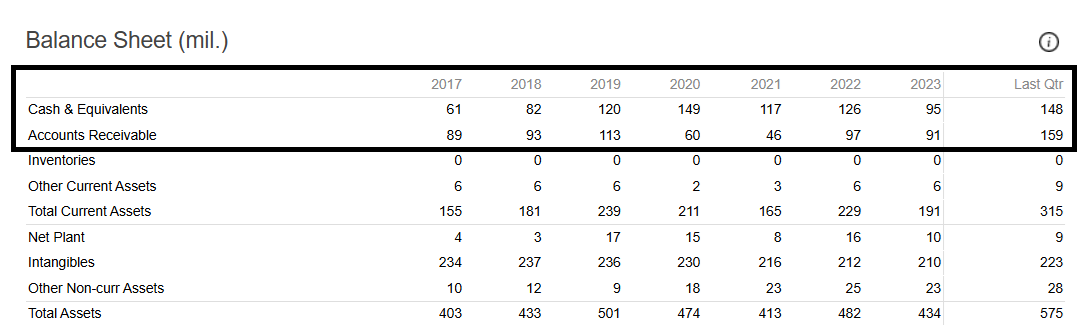
It's the company LMN:CHE. Looking at the latest quarter, I see Cash & Equivalents of 148 and Receivables of 159 within the Balance Sheet Panel (https://www.portfolio123.com/app/report/panels/LMN:CHE)
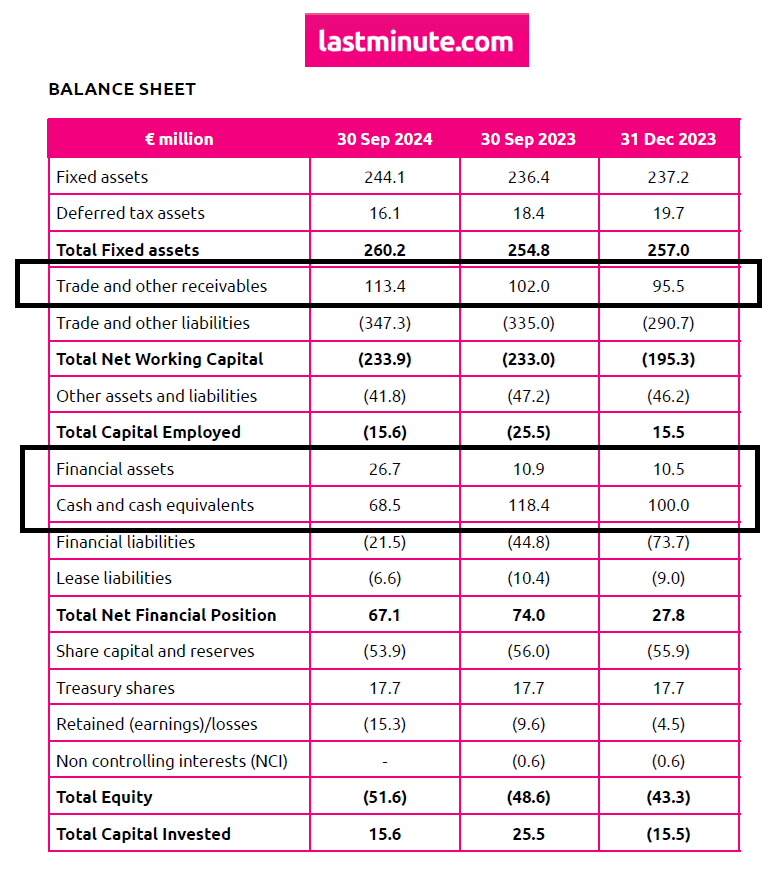
However, checking their latest financials (Reports - lastminute.com group), I see:
The financials they report are in euro, the panel is in CHF. But this should lead to a difference of only 6% (CHF = 1.06 EUR). Obviously, the difference in Cash & Equivalents would have a significant impact on for example the calculation of the companies' Enterprise Value.
FactSet must have its own definition for Cash and equivalents and Receivables, but I believe that these methodologies are only available if you pay for the data yourself. What would be a good way for me to explore a bit more what the 'right' numbers are or to form my own opinion about it?
For LMN, FactSet must be using Interim Report 2024 for semiannual ending 2024-06-30, the latest interim. It has 153.718 for Trade and other receivables and 153.406 for Cash and cash equivalents. The company's latest report is not the sort that is processed at least for our subscription.
Thanks so much, appreciate it.
My question here would be the following:
If this current error (May25) gets corrected in the data base let's say next month (Jun25) by FactSet, a live strategy would also get this "corrected" signal earliest after 1 month and would act on the updated signal. No big deal, data errors happen.
But if let's say 1 year from now, I backtest a simulated strategy on Polish stocks, will the simulation still use the incorrect data for May and updated data in June? Or will the incorrect data occurrence be completely wiped from the database history? The latter would be problematic regarding interpreting backtest results vs. out-of-sample performance (look-ahead bias). Of course I assume that's not the case?
Unfortunately, the incorrect data will indeed be wiped from the database history. This does not happen frequently, but our FactSet datafeed is not strictly point-in-time.
Ok, good to know. I think my rankings systems and sims are still comparatively robust in that regard because low frequency signals, combination of independent technical and fundamental composites, not reliant on outliers, etc.
Still, I should keep this in mind especially dealing with exUS microcaps... I also assume that data quality / error-proneness somewhat correlates with #NA's in the single stock datasets... That's one reason why I use the NA_negative method...
In a case like this, where FactSet made the mistake and not the company itself in its filing, IMO it's not so bad that the old incorrect data is wiped from the database history. Reason: market participants were aware of the correct data on the backtest date (since only a very small percentage of investors use FactSet data to make their trading decisions).
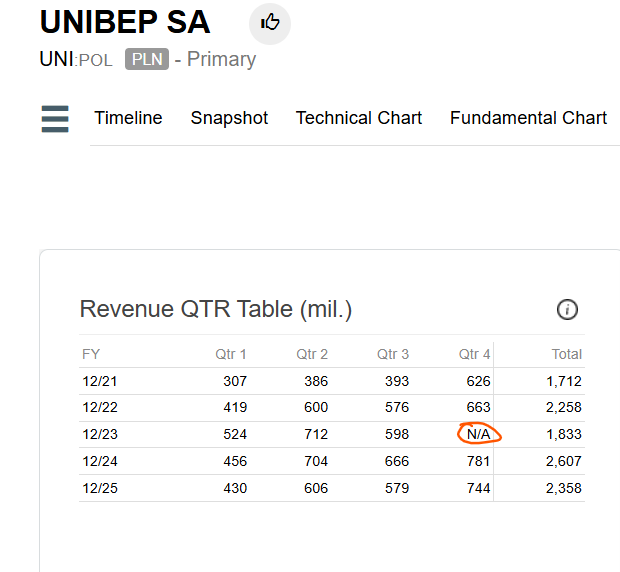
I noticed a recent change in the data model framework: 'N/A' values are now permitted.
Previously, if an 'N/A' appeared, the prior historical data was deleted or rendered unavailable.
How might this impact our current models?
By the way, it is very strange that sales data is unavailable, as this is a key input for any financial statement. Could this be a FactSet issue?
We are working on two things 1) Do a better job with delays which are much more common in Europe 2) Smoothly handle companies that switch quarterly to semi annuals, and vice-versa (and multiple times!).
Allowing gaps is not something we planned to permit. Those should be reported to FactSet to fix. With gaps all TTM ratios are out the window and should be N/A. I'll investigate UNI:POL.
Our new logic will be released shortly. It "fixes" around 150 companies in Europe where the point in time history was being cut short due to changes in filing periods. The current logic does not allow mixing semi annuals with quarterlies, and simply resets and starts over when a company switches. When we did the current logic, we took the easy approach because we didn't anticipate something like the example below. As you can see FactSet just gives us whatever data they can collect, and it's up to us to make sense out of it.
This is an outlier, most are ok in Europe. It's UniCredit SpA (UCG:ITA) and they are now reporting quarterly data. Once in a while FactSet throws us a semi annual, not sure why, like in 2023-06-30 (this one looks like an error since value is too small). From 2014 - 2019 it was only semi annuals. Not sure what's going on in 2004 where a "0" is reported for sales (0 is not N/A, it's 0).
Our new logic should handle this "beauty" much better and produce nice clean history for TTM ratios from 2004 onward. It will be released today or tomorrow.
Let us know what you think. Thanks
| Period | SalesQ | SalesSA |
|---|---|---|
| 2025-12-31 | 6,164 | |
| 2025-09-30 | 6,152 | |
| 2025-06-30 | 13,055 | Fishy value |
| 2025-03-31 | 6,550 | |
| 2024-12-31 | 6,003 | |
| 2024-09-30 | 6,142 | |
| 2024-06-30 | 6,518 | |
| 2024-03-31 | 6,371 | |
| 2023-12-31 | 5,978 | |
| 2023-09-30 | 5,981 | |
| 2023-06-30 | 6,098 | 2,410 ??? |
| 2023-03-31 | 5,929 | |
| 2022-12-31 | 5,972 | |
| 2022-09-30 | 4,830 | |
| 2022-06-30 | 4,867 | |
| 2022-03-31 | 5,019 | |
| 2021-12-31 | 4,416 | |
| 2021-09-30 | 4,444 | |
| 2021-06-30 | 4,469 | |
| 2021-03-31 | 4,688 | |
| 2020-12-31 | 4,353 | |
| 2020-09-30 | 4,192 | |
| 2020-06-30 | 3,977 | |
| 2020-03-31 | 4,767 | |
| 2019-12-31 | 12,723 | |
| 2019-06-30 | 13,036 | |
| 2018-12-31 | 13,021 | |
| 2018-06-30 | 13,324 | |
| 2017-12-31 | 12,440 | |
| 2017-06-30 | 13,277 | |
| 2016-12-31 | 11,145 | |
| 2016-06-30 | 16,084 | |
| 2015-12-31 | 15,521 | |
| 2015-06-30 | 17,289 | |
| 2014-12-31 | 17,135 | |
| 2014-06-30 | 17,806 | |
| 2013-12-31 | 7,314 | |
| 2013-09-30 | 5,885 | |
| 2013-06-30 | 6,605 | |
| 2013-03-31 | 6,222 | |
| 2012-12-31 | 5,888 | |
| 2012-09-30 | 6,243 | |
| 2012-06-30 | 6,382 | |
| 2012-03-31 | 7,212 | |
| 2011-12-31 | 6,256 | 0 |
| 2011-09-30 | 5,868 | |
| 2011-06-30 | 6,568 | 0 |
| 2011-03-31 | 7,032 | |
| 2010-12-31 | 6,718 | |
| 2010-09-30 | 6,605 | |
| 2010-06-30 | 6,601 | |
| 2010-03-31 | 6,907 | |
| 2009-12-31 | 6,443 | |
| 2009-09-30 | 6,731 | |
| 2009-06-30 | 8,109 | |
| 2009-03-31 | 6,562 | |
| 2008-12-31 | 6,088 | |
| 2008-09-30 | 6,746 | |
| 2008-06-30 | 7,763 | |
| 2008-03-31 | 6,449 | |
| 2007-12-31 | 8,222 | |
| 2007-09-30 | 5,765 | |
| 2007-06-30 | 6,636 | |
| 2007-03-31 | 6,803 | |
| 2006-12-31 | 6,119 | |
| 2006-09-30 | 6,128 | |
| 2006-06-30 | 6,484 | |
| 2006-03-31 | 5,955 | |
| 2005-12-31 | 9,914 | |
| 2005-09-30 | 2,803 | |
| 2005-06-30 | 5,475 | |
| 2005-03-31 | 2,712 | |
| 2004-12-31 | 0 | |
| 2004-09-30 | ||
| 2004-06-30 | 4,027 | |
| 2004-03-31 | 2,488 |
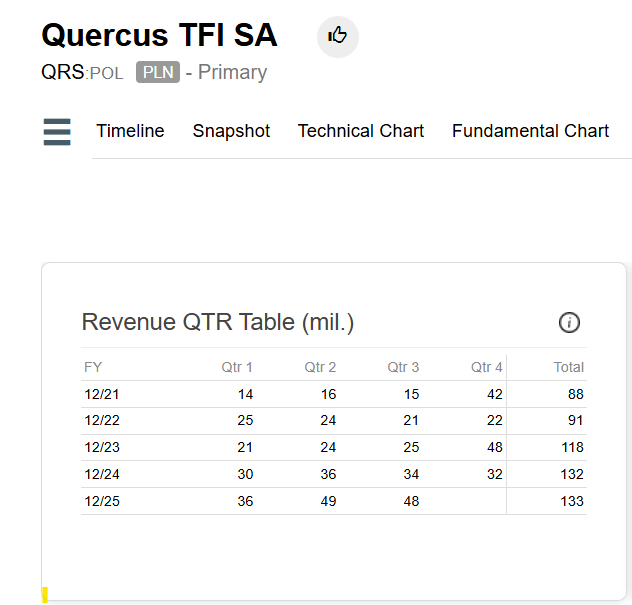
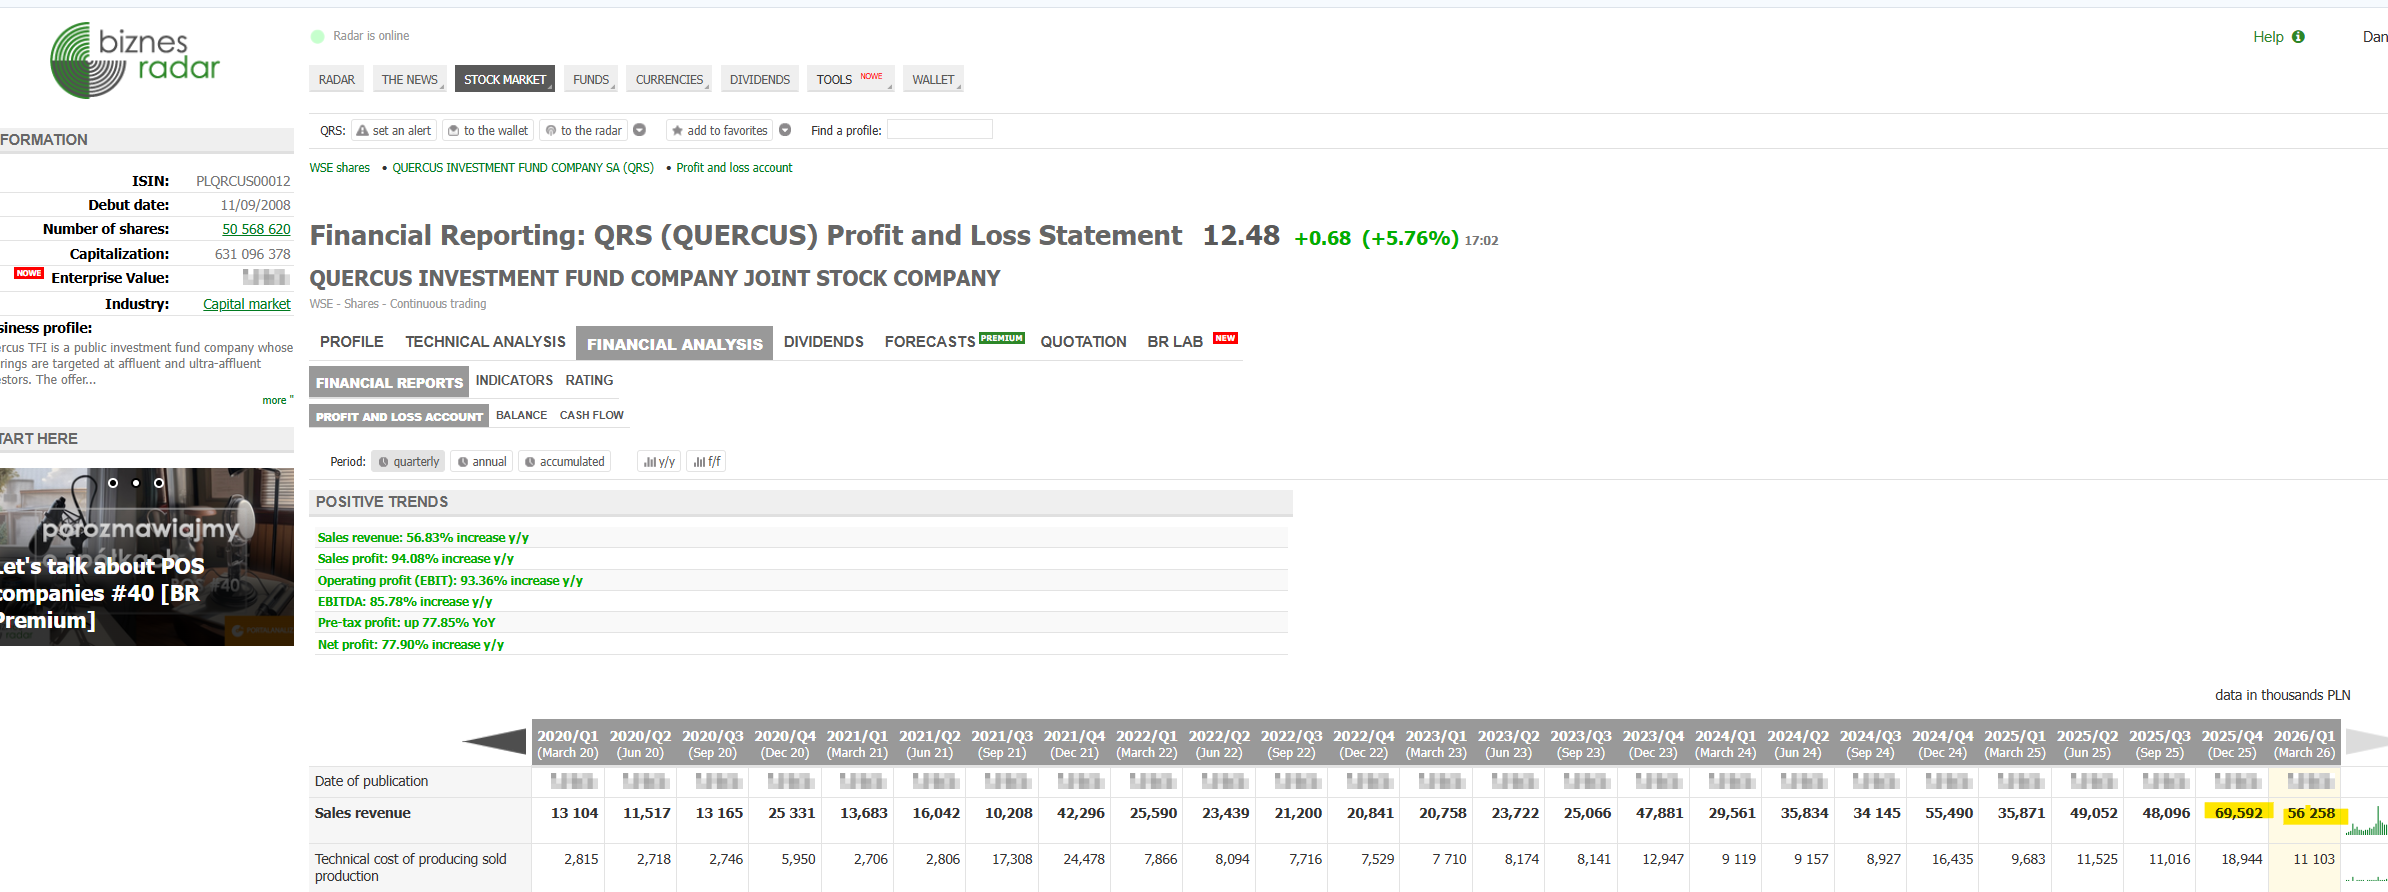
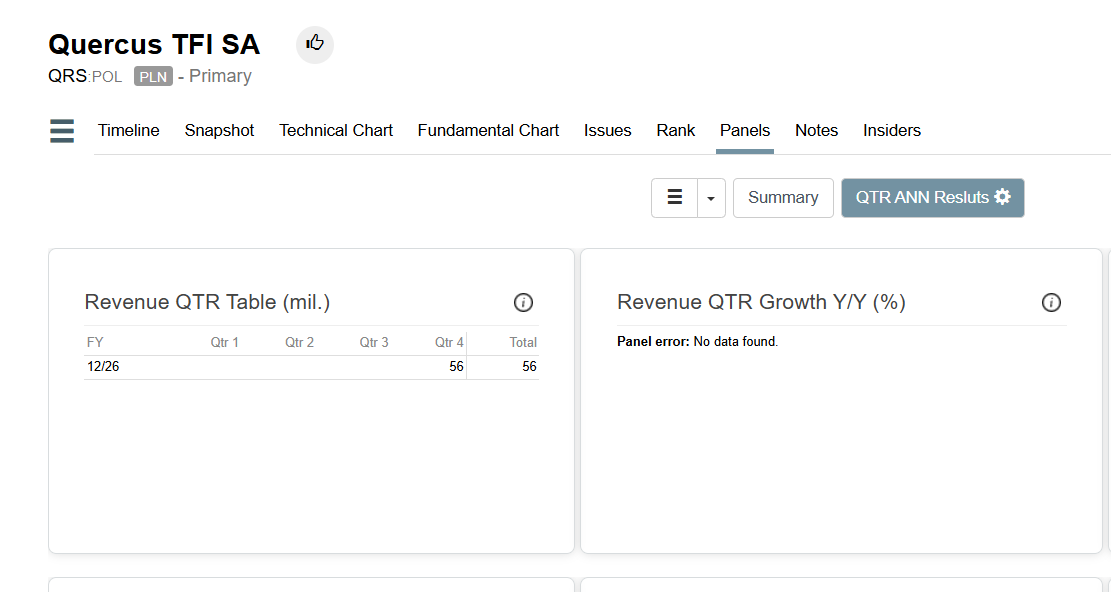
However, the problem with delayed financial statements still persists. Here is an example of a 2-period delay for a European mid cap (QRS:POL). This is the first time I have seen FactSet delayed by as many as 2 periods — both Q4 2025 and Q1 2026 are missing in P123, while the small Polish local data provider already has Q1 2026 figures parsed automatically within hours of publication.
To be fair, Quercus did publish Q1 2026 results only today — but Q4 2025 has been available for weeks. Something is not right here.
Yes, its me again ;]
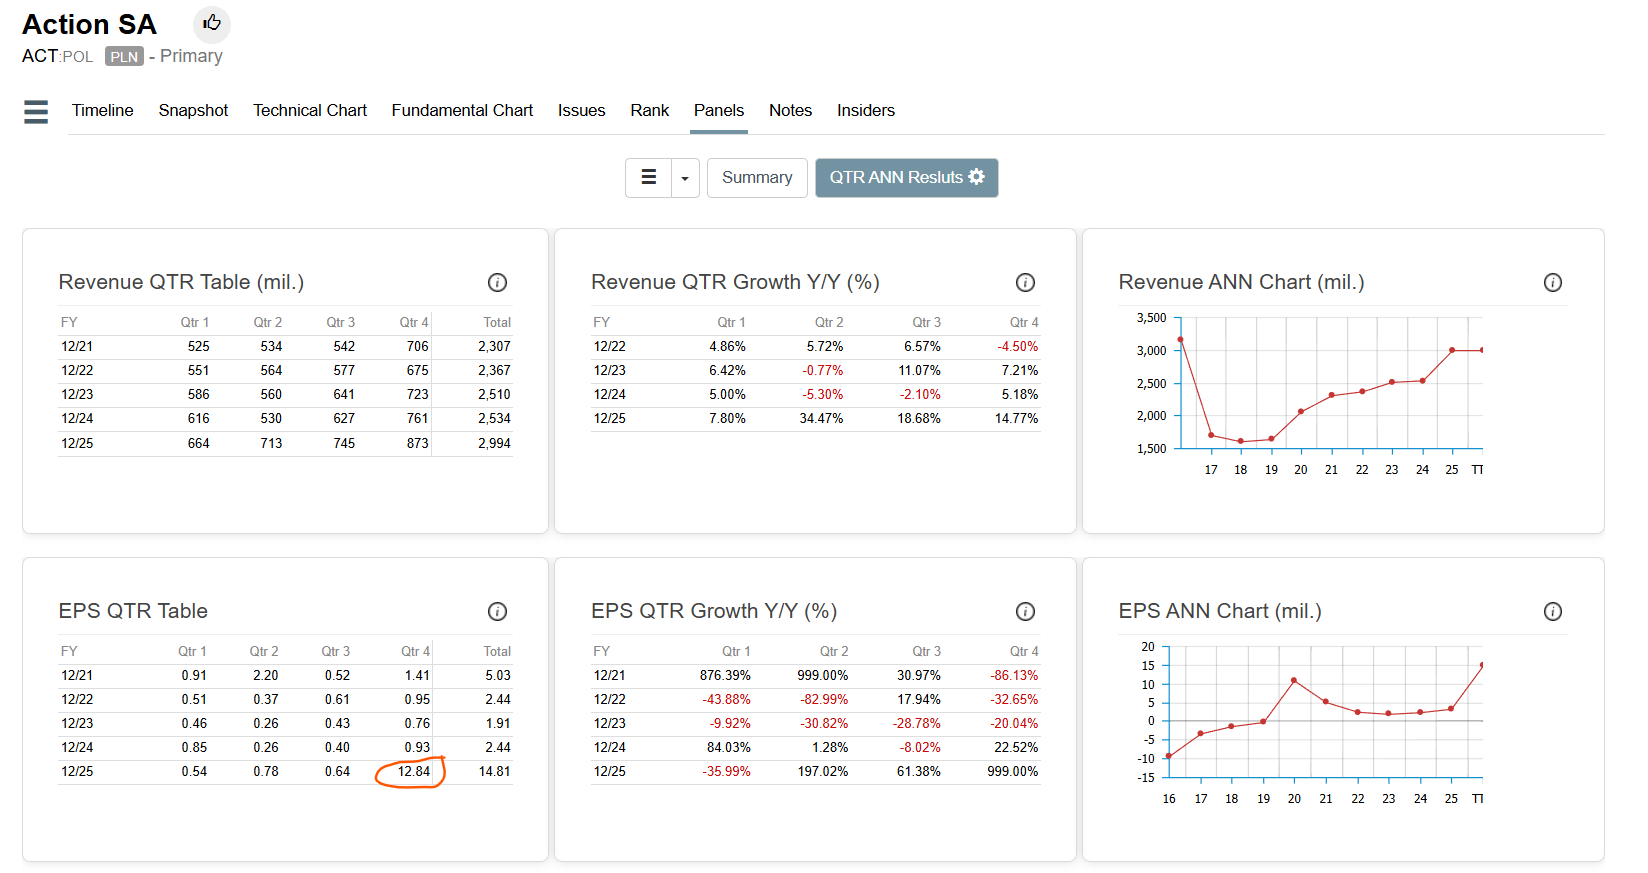
Q4 2025 Preliminary earnings posted on 13 March shows net income of PLN 45.72 million, which translates into ~ 3.2 EPS for Q4 2025. It seems like EPS for Q4 on p123 is multiplied by 4.
source : Action miał wstępnie 18,11 mln zł zysku netto w IV kw. 2025 r. - Stooq
So ACT:POL reported PLN 18.11 million consolidated net profit on revenues of PLN 873.02 million in Q4 of 2025. Those numbers are in Factset.
I'm seeing 14M shares outstanding, so EPS = PLN 18.11/14 = PLN 1.294. The number reported in Factset is about 10x that. I'll report.
Right, 3.2 EPS is for the whole FY2025
Thanks for reporting this.
Report submitted to Factset.
The same issue here.
Based on the preliminary results:
This suggests that Polish preliminary data is inconsistent (I haven’t checked all stocks yet, but the pattern is concerning).
What’s your experiencce with other European stocks? Is this a broader issue, or are Polish names particularly affected?
Source: Investor Relations | MIRBUD S.A.