CapSp5YCGr% is one of those factors that does well in the middle of the distribution. Would it take a lot of work to add that as an option on top of lower/higher? I currently can't find a way to exploit this. Small cap/IWM, 10y backtest, higher the better.
I know @yuvaltaylor touched on this in his webinars, but i just can't believe this basic option is not available. And i could not implement any of the methods he suggested.
P123 profile on X suggested i post this here for the devs to see it.
While there are no settings to handle middling natively in ranking system nodes, you can use formulas like this: Abs(CapExGr%5Y - FMedian("CapExGr%5Y")). This formula will fold values around the median, so Ranking would need to be set to Lower values. (CapExGr%5Y is equivalent to the deprecated factor CapSp5YCGr%.)
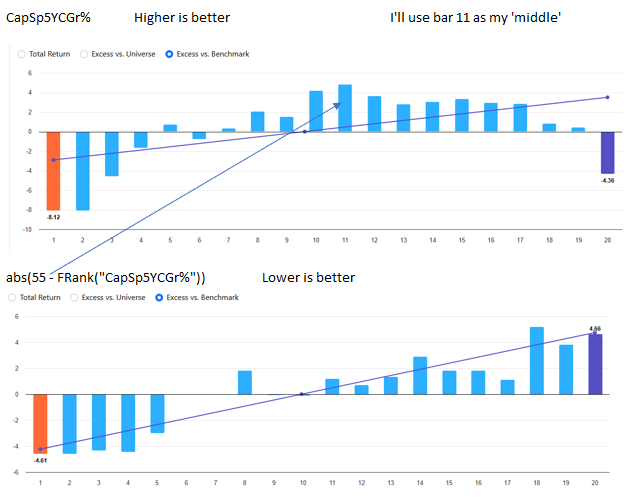
I believe this method came from Yuval, but I don't know if it was in the webinar you mentioned. The first step is to run rank performance for the factor to determine which of the middle bars is the best. I used 'higher is better' for CapSp5YCGr% and got the results in the top chart. In the example below, the best bar is bar 11. Use that information to create the formula abs(55 - FRank("CapSp5YCGr%")). Important - always use lower is better for this formula. I also tried using 50 and 60, but 55 gave the best results.
If you want to keep NAs neutral you should really use Abs(55 - FRank("CapExGr%5Y",#all,#desc,#exclna). Without that, the NAs will always get very low scores.
There's also an alternative method, but it's time consuming. Add three lines to a screen: CapExGr%5Y <> NA, Between (FRank ("CapExGr%5Y", #previous), 90, 100), and showvar(@medcapexgr,fmedian("CapExGr%5Y",#previous)). Backtest it, jot down the results for the showvar and the backtest results, change the between line to 80, 90, then 70, 80 and so on, and create a scatterplot chart with the showvar results and the backtest results. Find a polynomial curve that fits and use that formula, with higher better, as your ranking formula.
There are advantages and disadvantages to both methods. It depends on whether you believe that there is an optimal level of capex growth (say 5%) or whether you think the optimal thing to do is to find companies with middling capex. Capex growth has a pretty normal distribution, but there are other factors with very different distributions. If, for instance, you find a factor whose 90th percentile performance is absolutely horrible but whose 10th percentile performance isn't that bad and whose optimal performance is around the 50th percentile, using ABS(50-x) isn't going to be as good a formula as using a polynomial trend line. You can also combine the two approaches by ignoring the showvar and using 95, 85, 75, 65, and so on in the left column with the backtest results in the right when coming up with your polynomial formula.