A very interesting new research paper https://papers.ssrn.com/sol3/papers.cfm?abstract_id=2900447 concludes that most common stocks do not outperform T-bills. I’d be curious what conclusions, if any, can be drawn for our purposes from the results of this study.
Powerful opening statement:
“Most common stocks do not outperform Treasury Bills. Fifty eight percent of common stocks
have holding period returns less than those on one-month Treasuries over their full lifetimes on
CRSP. When stated in terms of lifetime dollar wealth creation, the entire gain in the U.S. stock
market since 1926 is attributable to the best-performing four percent of listed stocks. These
results highlight the important role of positive skewness in the cross-sectional distribution of
stock returns. The skewness in long-horizon returns reflects both that monthly returns are
positively skewed and the fact that compounding returns itself induces positive skewness. The
results also help to explain why active strategies, which tend to be poorly diversified, most often
underperform.”
Will be interesting reading…
That is why one needs a market timer. The inflation rate is a good indicator. Stocks perform poorly when inflation is on the rise. The empirical data is supported by theory. Rising inflation means that interest rates are increasing and the discounted value of future cash flows is driven down, lowering equity prices.
Sell Rule for stocks:
INF > 6-mo SMA(INF) + 0.75% and INF>2
Sell when the inflation rate exceeds its 6-month moving average plus 0.75% and also exceeds 2.0%
Buy Rule for stocks:
INF < 6-mo SMA(INF) – 0.20%
Buy when the inflation rate becomes less than its 6-month moving average minus 0.20%.
The backtest from 1953 to 2017 confirms the validity of those rules.
http://imarketsignals.com/2017/updated-timing-stock-market-inflation-rate/
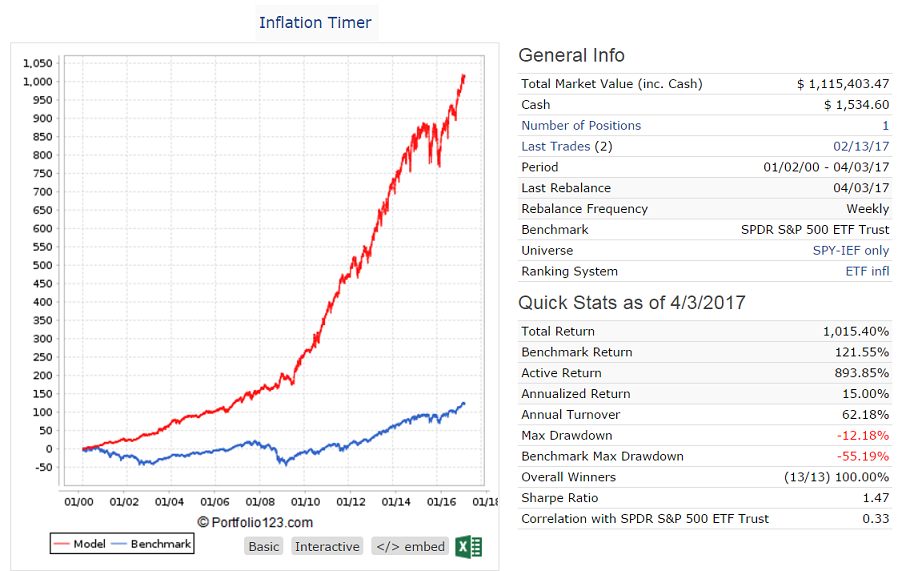
Here are these rules applied to switching between SPY and IEF modeled on P123.
Buy1: ticker(“SPY,IEF”)
Sell1: ticker(“spy”) & ($infl>($infl6+0.75) & $infl>=2)
Sell2: ticker(“IEF”) & $infl<($infl6-0.2)
A one node ranking system is applied to a universe holding SPY and IEF.
Annualized return from 2000-2017 = 15.0% with mx D/D= - 12.2% and only 13 trades, all winners.
The model holds IEF since Feb-13-2017.
The link to the paper didn’t work for me. But really . . . can we get real? You don;t have to be a Phd to know that stocks have very dramatically outperfomed treasuries under any meaningful and legitimately chosen time frame. It also doesn’t take much to replicate the pro-treaury data conclusions or refute it by strategically defining test parameters that will allow one to demonstrate the the conclusion on one’s choice; and if one wants to get published, it’s a good bet that one would be better off concluding t-bills are better. That said, I support such research efforts. Academic life and politics suck so anyone who can game the publication-tenure system, more power to them!
This reminds me vaguely of an old research task I was once given to study risk premiums. I quietly abandoned it when I realized the project was a piece of #&%* and that I could produce any premium I wanted by rigging the start and end dates.
I’m not sure the comparison even makes sense – 58% of stocks don’t make up 58% of the stock market. A $200B stock is hardly the same as a $1M stock. I’d bet a random pick of 58% of stocks would make up a very small portion of the stock market. Probably less than a few percentage points.
An out-of-sample test would have been more effective at confirming the validity.
For example, what happens if the first 30 years were used to develop the rules and then applied to the other 34 years? Or a random 30 years, then compared to the remaining 34 years?
Otherwise, it’s more or less a self-fulfilling prophecy.
Really?
Rising inflation is bad for stocks. A 65 year long backtest confirms this.
A slightly negative correlation on the 65 annual periods.
This backtest has far more data points:
Would you trust a system based on it?
I found the information in the original article, regardless of Georg Vrba’s simulation, of interest. The key points I came away with were, in no particular order:
a) if you look at the one-month historical performance of a randomly chosen stock, it is more likely to have fallen in price than to have risen in price
b) the median lifespan of a stock is just over seven years
c) he ran a bootstrapping simulation of 10,000 tries of buying a random stock every month for ninety years; the average return exceeded the return on the t-bill, but the median return was terrible, and only 27% of his results exceeded the t-bill
d) small stocks more frequently give negative returns than big stocks, no matter the time frame
e) only 42% of lifetime stock returns are higher than t-bill returns
In other words, while the stock market in aggregate certainly has produced high returns, individual stocks are likely to produce negative returns.
What are the implications of this in terms of our strategies?
-
It’s important to diversify enough that the outperformance of some of our holdings can outweigh the probability that more than half of our holdings, if selected randomly, would give us negative returns.
-
We should pay just as much attention to eliminating stocks that are likely to fall in price as we do to choosing stocks that are likely to rise in price.
-
We might want to pay more attention to the left side of our ranks and less to the right side. In other words, we normally focus only on the 0.5% of the stocks in our universe that we’re actually going to buy and not on the 99.5% that we’re not going to buy. But perhaps we should pay attention to that 99.5% and make absolutely sure that all the real losers out there fall into that camp. One idea might be instead of simulating all the stocks that we’re going to buy and making sure the results are high, we might want to simulate all the stocks we don’t want to buy and make sure those results are as poor as possible. Coming up with a system that will minimize the returns of 98% of our universe might be an interesting and profitable challenge.
-
I did my own test, and in the period 1999-2017, only 47% of monthly returns of non-OTC stocks have been negative. In the entire 90-year period being tested, though, according to the article, that number was over 50%. That means either that stock market returns are far better than they used to be, that the period covered by P123 is rather exceptional, or that one of us is wrong.
From the web and my previous reading: “for data which follows a log-normal distribution, the geometric mean should be same as the median.”
One of the things we are doing at P123 is buying multiple stocks and capturing the mean return (arithmetic mean) over a short period and compounding that return: by rebalancing and reinvesting. Note: the arithmetic mean return is always higher than the median return in a log-normal distribution.
Compared to buying and holding one stock: we are converting our compounded returns from the median to the mean of the “average” stock price. This is a factor in why we make money and how the author makes buying stocks look like a worse idea than it is: at least the way we do it. We are also getting some time diversification. So, no matter what you think of the paper, some of it may not apply to us.
This is discussed in detail in William Poundstone’s book “Fortune’s Formula.” Shannon’s demon, from the book, is an extreme example of this. “Shannon’s demon” is able to make money using this principle even though the price of a highly volatile stock, in this example, fluctuates around one value.
But here is how “Shannon’s Demon” would work at P123. If this demon had control of P123 he would simply change the statistics>trading to logarithmic returns. Then when you looked at that trade statistics with “Realized winners” = 50% you would be making money even if the “Avg Return” for the winners and losers were equal.
It is like that little demon can turn volatility-drag in his favor. Admittedly, this is a small factor for us with the volatility we are dealing with. This is the same as saying for small percentage returns the percentage return and the log return are nearly equal. But you might consider looking at the volatility of individual stocks (not the portfolio as a whole) in your ports and seeing how that correlates with your annualized returns.
With absolute certainty this is why a port with just your highest rank stock usually does not do that well but the trade statistics can look good. You are not getting the benefit of rebalancing and putting the stocks in your portfolio near equal weight. Obviously, different ports will behave quite differently when you try this (law of small numbers). But I have never seen a single stock work all that well with any ranking system and this part of the reason.
Like Marc, who uses a Mac too, I cannot pull up the link on Safari. I will try it at the office. But is sounds like the author already knows this and is playing with us a bit. But, in a way, he is pointing out what Poundstone wrote about–and proves it.
And BTW, one of the reasons you should use log returns—for the port as a whole--if you ever bootstrap.
All things considered, I think Marc said it best. I try to stay away from the punctuations keys (“#&%*”), however. Marc should have a little more leeway on this.
Also, I keep following Yuval around on the posts because he has such great posts: detailed, mathematical and with evidence that can be discussed. He is spot on with regards to diversification, IMHO.
-Jim
I want to apologize for spending too much time on this.
I did want to show that while I developed the idea of the potential significance of “Shannon’s Demon” to P123 while reading Fortune’s Formula it is not new or too strange.
This article calls it “Volatility Harvesting” and is probably a little clearer:[url=https://www.investing.com/analysis/on-volatility-harvesting-and-the-critical-importance-of-rebalancing-114757]https://www.investing.com/analysis/on-volatility-harvesting-and-the-critical-importance-of-rebalancing-114757[/url]
There are other articles that explain “Shannon’s Demon” better but are less good at discussing investing. There are other investing articles that make my eyes glaze-over in boredom but may be more realistic as far as the magnitude of the effect: I was too bored to finish them and know whether I could recommend them, however.
I think it is an open question, for me, as to how much I really benefit from this. And, if the benefit is potentially significant, what type of ports benefit most. But not too strange and I will use the term “Volatility Harvesting” in the future.
I wish you the best in your investing.
-Jim
Jim -
This is very interesting indeed. I’ve never looked into active rebalancing, preferring to let my positions in winning stocks get huge and my positions in losing ones shrink. I think I should–it makes more sense, and conforms to the principle of short-term mean reversion. So thank you!
Shannon’s demon assumes extreme volatility and a total absence of trends. I’ve been studying trends and have come to the conclusion that unless you’re looking at long terms (over six months), they don’t really exist–they’re an optical illusion. So the thought experiment seems to me to be more than just a thought experiment–it may have some practical value. This article seems quite convincing at first glance.
The article refers to a “dynamic volatility weighting method,” but the link is broken. Do you have any idea what that might be?
- Yuval
Yuval,
Thanks. I think it has value but I probably hyped it more than it deserves. If you look closely you will find it alluded to in any moderately-in-depth discussion regarding diversification: they do not usually go so far as to even call it “Volatility Harvesting” but it is usually mentioned. So, again, people already know it and I have overhyped it.
I just looked at the trade statistics of one of my random (realistic) sims. My “Avg Return” for winners was 10% and 7% for losers. There should be noticeable benefit with this level of volatility: IF THE STOCKS IN THE PORT ARE NOT TOO CORRELATED. In round figures, if your stocks have no correlation to each other you may be making close to 1% over the average holding period.
Specifically, if a stock goes up 11% one day and down 9.009% the next day you have made no money: this is the “volatility drag.” But if your portfolio has a large number of uncorrelated stocks where half go up by the above amount and half go down by the above amount you make about 1% (exact: [(11-9.009)/2]% = the arithmetic mean of the return) each time they make this level of change and you rebalance. This is the “volatility harvesting.”
Note Ln(1.11) = 0.10435. Ln(.900901) = -0.10435
ABOUT 1% OVER YOUR AVERAGE HOLDING PERIOD. Assuming no correlation of the stocks in your port. Emphasis (and any excitement) mine alone. But this is not trivial even if the actual number is lower due to correlation amount the stocks.
I admit to kind of just liking the math and the relation to entropy: the demon comes originally from a physics thought experiment where the demon was able to stop the increase in entropy. I guess, something so unnatural that only a demon could do it. But also unnatural is making money on a stock that does not increase in value (practical or not). For me that is about as cool as it gets.
If we are rebalancing like we do at P123, the idea that this has a meaningful effect cannot be dismissed. But my last post was to just show that it is a serious issue and not some weird math idea of Shannon and me.
I could not make the link work either.
-Jim
I just performed a quick test comparing simulations (no rebalancing of current holdings) to screens (rebalancing of current holdings). Using the same ranking system, the same number of holdings, the same dates, and the same rebalancing frequency, with rank tolerance set to approximate the difference between the buy and sell rank, the screens give higher returns on the whole, no matter which ranking system I use. I don’t know if they’re higher enough to justify the increased transaction costs, though. But the message seems to be that when a stock you’re holding appreciates a lot, sell some of it, and when it depreciates a lot, buy more–just as Shannon’s demon recommends.
Just a quick note. Exact rebalancing is not necessary. For most it is just an inherent benefit of using P123 and rebalancing regularly: whether exact or not. Nothing special needs to be done. Kind of like selecting from an equally weighted universe of stocks. You do not need to do anything special or even understand why it is a better.
But it is, IMHO, one of the reasons that a serious effort at joining P123 and using it is likely to work for most people. Just a little edge that you might have sometimes even if the stocks you pick do not outperform the benchmark on average.
I brought it up because it is, I think, an important reason the paper sited has little meaning for us. I got the benefit of getting a ballpark number for what this benefit is for uncorrelated stocks: something I had not calculated before (and probably would not have done if I were not posting about it). And I learned a new term: Volatility Harvesting.
Thanks.
-Jim
Yuval,
There are some differences with how Sims and the Screener trade the holdings. To better get a true apples to apples result, compare two Sims:
Set one of the Sims to simulate the backtest of the screener (They WON’T be equal);
- Set “Allow sold holdings to be re-bought at current rebalance” to Yes.
- Use a Sell Rule that sells all stocks every rebalance, such as; Rank < 101 (or just a 1, the fastest way is to add a 0 to the default Rank < 60 rule).
This allows you to just copy your stock Sim and make the above changes to simulate the Screener.
Also, that way anything that is in your Sim setting that you can’t set in the screener will still be effective. Such as:
Set commission fees & use margin,
Constraints % From Ideal Size,
Force Positions into Universe,
Use the stop loss, Hedge/Market Timing, & Restrictions pages,
I remember you saying that you have been using the Screener for some time, but are new to the Simulator.
I think you will find the Sims & Ports will serve you better once you get familiar with them.
The ability to have sell rules different than the inverse of buy rules is very powerful.
That allows great stocks to remain in the holdings even though they are no longer the highest ranked which increases average holding time.
When I rebalance my Ports I still use the screener when I don’t feel comfortable with a buy recommendation to review and select from one of the next few lower ranked stocks.
Denny -
Thanks for the tips. I’m not sure how this would work for me. I buy stocks when they’re ranked highly and don’t sell them until the rank is lower. If I were to sell at rank < 101 I would be buying the stocks anew each time and paying the transaction fees accordingly. I know this would give me lower returns, and wouldn’t really simulate very well what I do in practice, nor what I might do with rebalancing. Also, I have been using simulations extensively for years and have experimented with various sell rules, and the pure simple rank-based sell rules work best for my sims. You’re right that the screener doesn’t allow me to force positions into my universe, which is one drawback; the screener also doesn’t accept rankpos sell rules and forces me to estimate with rank tolerance, another drawback since the universe size changes a lot over time.
My strategy at the moment consists of ALWAYS buying anything in that appears in the top ten of my ranking system and selling the worst-ranked stocks when I need the cash to buy more. No simulation or screen can simulate that strategy the way things are set up, but you can get an approximation by using fixed-amount simulations with the buy rule being rankpos <= 10 and the sell rule being rankpos > 30 and then calculating a hypothetical CAGR from the transaction record (which I do in Excel, but it’s approximate and cumbersome). I’d love to be able to run a simulation with a fixed percentage position, a buy rule of rankpos <= 10 and no sell rule but automatic selling of the lowest ranked stock, and I’ve put in a feature request for that. Then I’d like to add an additional rule that says that if the weight of a position exceeds a certain percentage of the portfolio, sell a little, and if it goes under a certain percentage, buy a little more, thus simulating a rebalance. But those are features that aren’t available at the moment.
Yuval,
My comments were addressing your quick test using a Sim compared to the screener.
I was suggesting to re-run the test comparing a Sim (no rebalancing of current holdings) to a Sim (rebalancing of current holdings) using the 2 mods to the first Sim to simulate how the Screener trades.
Denny -
I tried your mods to the sims and it doesn’t work. The sims don’t actually rebalance. When a holding is “rebought,” it is actually “not sold.” You look at the transaction record, and it shows holding lengths and holding amounts that are no different from the previous sim.
So I don’t know if there’s a way to get a sim to actually rebalance. We may have to use the screener for that.
Let me know what you think.
Thanks,
- Yuval
Yuval,
When the Sim (the one designed to simulate the Screener) rebalances, it sells all stocks, and buys the highest ranked stocks that meet all the buy rules, all stocks equal weighted. If any stocks are rebought additional small # of shares are bought or sold depending on which stocks had gains or losses before they were sold. The Sim only charges fees and slippage on any delta shares bought or sold. That is what the screener does.
If You are seeing no difference, either the stocks have no gains or losses, and are still top ranked, thus rebuying the same number of shares of all the same stocks at the same price they were originally bought for (no gain or loss in the holdings), or the Sim is not setup correctly to simulate the Screener.
Be sure you have at least 1 sell rule that forces all stocks to be sold at each rebalance, and that the setting; “Allow sold holdings to be re-bought at current rebalance” set to YES.