Are today EPS numbers correct? Very big jump for one week
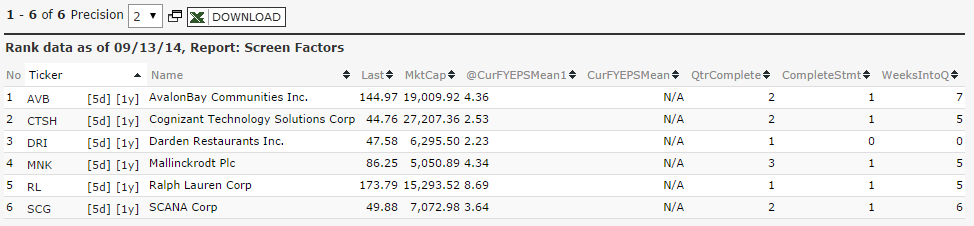
Looks like there are 6 stocks in the SP500 with NA for CurFYEPSMEan, whereas they had values one week ago (see attachment)
We think it’s because it’s Saturday and Compustat updates significant amount of estimate data on Sunday. But further investigation is needed
Also, there’s a project underway to refresh the SP500 series data found in the “Fed Model” pages (#SPEPSCY, #SPEPSNY, etc) on Sunday. Currently, once calculated, it is not updated on Sunday. Once we complete the project we will rebuild those series. You can preview the changes this will cause in the enclosed spreadsheet.
Thanks
NOTE: you can find the series that recreates #SPEPSCY here .
SPEPSCY comparison.xls (69 KB)
When I recalculate the EPS estimates for 9/13/14 they are now filled in. So it looks like the estimate numbers where inserted by Compustat after our Sunday 2:30AM update process. Since we only recalculate the EPS estimates twice for a weekend, once on Sat & once on Sun, the ended up staying as N/A in our snapshot.
There’s no point in moving the Sunday update even later as it would make all rebalance emails (including r2g) too close to the market open.
We’ll just have to do a follow-up update of estimates on Monday night to make sure we catch all the late weekend data. Naturally the Monday rebalances could end up using stale data that is over-written on Monday night. For ports relying heavily on estimates this will have to be something to look out for.
IMPORTANT
We will recalculate and re-snapshot the weekend estimate data for the past few weeks.
I do think there was something peculiar with 9/13/14 as many other stocks have N/A in estimates, also in the quarterlies.
This has come up before. I thought one reason we were going to do the snapshots was to avoid the non-PIT look-ahead bias of CompuStat.
I guess I would prefer not revising statistics. If we do go that route, I would like to have a way of getting some idea as to how much the look-ahead bias is affecting ports. One possible method might be to start comparing out-of-sample RTG results to sims over the same time period.
One would expect a sim to do well if it uses information that was not really available at the time.
Right now I have to wonder whether some of my ports are down because the Russell 2000 is down for the year or because they are poor sims that are based on earnings estimates with a look-ahead bias. I really do not know.
The question should be: How would I have done if I had followed this trading scheme at P123? Not: How would some top-level investor, that has better access to information than I do not, have done? I know CompuStat might say that information was out there but not really for me as I do have a daytime job.
Am I missing something? I’m hoping this really is just something strange with 9/13/14 but I would like to have some idea how big of a deal it is.
BTW, I have noticed that most of my S&P 500 sims do not do better with earnings estimate revision in the ranks. Is this because the S&P 500 information is better and not revised later? If so, I would like to know and I would probably start using more Ports with the S&P 500 as my universe.
I have become unsure enough of CompuStat that one of my ports uses estimates data from another source (in-list) and the same port but with P123 estimates revisions. This port uses stocks with earnings estimates revision > x% in the universe. I have a port that has a universe with P123 earnings revisions and the same port with a universe that uses earnings revisions > x% for the other source of earnings revisions. So far no difference in the port from P123 and the port that uses another source for estimates revisions. So, P123 earnings revisions may be okay but I takes a long, long time to get statically relevant data.
Jim, to see if your ports have a look ahead bias you can re-run them as sims and visually compare the equity curve of the sims with the ports.
Chaim,
Great point and I do this to the extent possible. This does not work on the ports that I rebalance on Tuesday, Wednesday, Thursday or Friday. Also I am still pretty new here and I have been makings changes in my ports until about July of this year. Going forward, I have resolved not to change my ports so that I can do as you suggest. Even so, getting statistically relevant results takes a lot longer than one thinks subjectively: especially, if you are looking at the power of a study.
That is why looking at the RTG data in the manner you describe would be helpful. There may be enough data there to get statistically relevant data. I had thought this was resolved with the snapshots.
Deleted by author.
Edited after Chaim deleted his comments:
With regard to statistical significance, I was thinking of a study I did where one port did twice as good on Friday as Monday over a year period. I thought this might be real if more people, like those at P123, trade on Monday than on Friday. In any case, the p value on this is very large: not statistically different
I just want to know the situation on earnings estimate revisions without having to gather 3 years of data, if possible. If earning estimate data is no good, I will move to S&P 500 ports with no earnings estimate revision or at least add them.
There are two problems:
-
We got 6 NA’s in estimates for SP500 stocks last week that should not have been there. This caused a bump in the #SPEPSCY series
-
We might not get the freshest estimate numbers on Sunday ~2AM if Compustat flows through the latest data later than usual.
For now , I will only make these changes:
1- Going forward I will update the SP500 estimate series (#SPEPSCY, #SPEPSNY, etc,) twice: on Saturday AND Sunday
2- I rebuilt all estimate data for past two weeks to get rid of the NA’s
3- I rebuilt the SP500 estimate series for all of 2013 & 2014 to make sure we’re picking up Sunday’s updates
The main goal is to get rid of NA’s for SP500 stocks from last week and going forward. I think last week was a Compustat glitch, and the rebuild of change 2 filled them in. Updating the series twice (change 1) should avoid them in the future.
Change 3 will generate slightly different numbers for the estimate series for 2013 & 2014 but it should not be a major change. I will post a spreadsheet with the differences. The rebuild is necessary to match our new process that updates the SP500 series twice
Thanks
Chipper,
Every live port I have will be fairly different if re-run as a sim with the same start date and ‘previous close’ for price for transacations. For example one of my ‘best ports’ show 97% from 6/21/13 to now as a port. As a sim, shows 85%.
Another from 6/13/13…6% as a port, 9.74% rerunning sim from same date.
Another sim I opened as as port 3 months ago shows 4% as a sim and 2% as a port. They are all buying (and holding) different stocks.
I am curious what settting you are using and if you are getting sims that are re-run to 100% match the transactions of ports. I didn’t think this would ever be the case. If it’s not the case…systems without a large number of positions likely have many sources of ‘drift’ that have nothing to do with ‘look ahead bias’ in the data.
Best,
Tom
Jim,
To check a portfolio to see if there was look-ahead bias in the design, you just rerun the portfolio as a sim with the same start date. If the equity curve is different then it is statistically significant. No further statistical analysis is necessary. So I’m not sure what you mean. (On the other hand if you are trying to measure the degree of difference then you may need to do the statistical analysis.)
Chaim,
Good point. I think you are right about that.
Deleted. I will look at this in detail.
Jim,
I should mention: A sim treats dividends a little differently than a portfolio. So there will be slight differences even if everything is okay. But the overall shape of the curve should be very closely correlated.
Chipper,
I have just tested 8-10 portfolios that I have been running and/or monitoring for a year or more. The holdings range from 5 stocks to 100 stocks. If I re-run a sim with the exact same start date as the port…they are never the all the same. Usually not even really close.
I have some ‘factor tracking port’s’ that buy 100 stocks, once a quarter (or a year) based on some ‘factor’…say highest yield, or earnings upgrades or momentum, or whatever. Re-running a sim is typically fairly far from the ‘port.’ For example…the last one I look at shows port return of 23%, sim re-run shows 6.5%. It’s an annual hold of 50 hi-yield stocks. This is as simple a test as there can be. Large number of holdings…but systems end up holding different stocks. And returns end up fairly different. Why? Can’t say I know for sure…but -
Even when the systems are ‘starting’ on the same day…and rebalancing on the same day…they are making different ‘choices’…so they are clearly using different data on ranking (maybe this has to do with the data update frequency on sim’s vs. ports, I would guess it does)… This particular system bought 100 stocks on 5/7/13 in both the sim and the port…but chose very different stocks (very little overlap) in each.
For some systems that have non-weekly rebalance (i.e. monthly or quarterly), the actual rebalance dates often end up one week off. For others, that are weekly, they are making mostly similar trades, but not all…and returns still vary a lot. It would take more digging on a system by system basis to know all the reasons they differ (I am setting sim’s to same start dates, and using previous close prices.
But…just looking at this quickly…there is no way this seems like an effective test to isolate ‘is there look ahead bias’ in the data. It may be another test for ‘robustness’ in a system…after it’s been running a while, who knows. But…there are multiple things going on. Not sure what. Data differences…maybe…different rebalance dates (sometimes)…and who knows what else. Would love to hear a full list of ‘what’s different’ if people have taken the time to untangle it.
It does appear that with a) larger number of holdings, b) more rebalances and c) longer holding times…the two tend to converge…but still can be 15% annual return difference in AR after 5 years on 50 holding, quarterly rebalance systems (i.e. 13% vs. 15%).
Best,
Tom
Tom,
When trying to re-simulate the returns of quarterly rebalance ports it is not surprising that the results should be sensitive to the different start dates. Especially if you start a portfolio in the middle of the week you should not expect the results to be the same as a sim. You also have to watch out for subtle changes that you made in the sim over time. Changes to it’s buy rules, sell rules, position sizing, timing of the trades, slippage settings, ‘allow holdings to be rebought’, universe, ranking system…changes in the universe or ranking system themselves etc. Just today I had to delete a number of my public sims used to track the PIT issue and start over because I may have accidentally changed something in the universe somewhere along the way.
Over a year ago we ran backtests on hundreds of individual factors. Upon studying the best performing factors I discovered that many of them had issues which made their performance look much better than it really was. (It seems that they were not the best performing factors by coincidence). Short interest, EVPS, estimate revisions, CloseAdj and probably some others that I don’t remember offhand had issues. I have to give Marco a lot of credit for allowing me to speak up and for fixing the issues.
Checking some results:
Short Interest seems fixed now ![]() .
.
Estimate revisions over the past six months was broken although I vaguely remember something about a recent fix to estimate revisions (maybe having to do with foreign currencies and/or a/b shares?)
Net Income change over prior year quarter is similar but not the same.
Some have excused this by saying that if the port drops a lot when rerun as a sim then it shows that it’s not robust enough. I’m not sure what they mean at all. If the data is getting retroactively changes then it’s not PIT. What does that have to do with robustness?
Chaim,
Thank you for your comments.
I have a port that has only one sell rule: RankPos > 5. This makes it easy to compare the sim and the port as they should always have the same holdings. It does use earnings estimates revisions. The holdings are almost always different for each week: generally 1-2 different holdings in a 5 stock portfolio. I have not looked back every week to give an exact number yet but I have looked at enough to to convince me that there is a significant discrepancy. Ironically, I did not sell this port as it has good out-of-sample results and is rationally based.
I sold 5 other ports with bad out-of-sample results and backtesting that I can no longer trust.
Can you please share a little more regarding what backtesting we can trust? Are S&P 500 results more reliable? You mentioned EVPS is that fixed now? Did you test OCFPSTTM?
Your comments have already been a big help. Those 5 ports have been a big drag on my portfolio but I assumed they would perform better in the future. Now I know they might, but also they might not.
- Short interest seems fixed 100% now.
- EVPS was fixed as far as I know.
- I did not test the rest of the PS series because I don’t use them. They introduce rounding errors and assumptions about which share count you want to use.
- Price data seems pretty stable. (Although I was recently made aware that all adjusted price data from every source can never be completely PIT. The reason has to do with dividends. If the current price is $10/share and it has paid out $15 of dividends over the past ten years then what is the adjusted price ten years ago? -$5? Therefore there is some formula to estimate adjusted prices to keep it always positive. This issue affects mostly older adjusted prices and is only for big dividend players. If you are comparing the price trend over the past twelve months then this should rarely be an issue.)
- I assume that volume data is fine too but I never tested it.
- Most line items and fundamentals do not change, although adjusted earnings may change retroactively. That’s why my Greenblatt port (which uses the built in Greenblatt RS) has had issues but I deleted it yesterday and started a new one because of the universe issue that I wrote about before.
- Estimated value seems roughly okay so far.
- Estimate revisions are the biggest area that I have found where ports and sims have different picks.
The most likely reason for ports failing now is not because of faulty PIT data but for the same reason that the Russell 2000 is falling. It’s possibly that it’s because of the end of QE2 and/or the seasonal anomaly. Although I am not sure about QE this time around. The Fed did learn from their mistake and is ending it gradually–with a taper, and this tapering process as been ongoing since January with no negative results in the first months. Also, the ECB learned from it’s mistake in 2011 and started it’s version of QE to pick up the slack this time around. (When QE2 ended it was abrupt and caused credit problems to the Euro sovereigns). Perhaps in a couple of years we will have enough data and analysis to do a postmortem and figure it out retroactively. When a port was designed based on faulty PIT data then it doesn’t fail, it just under-performs expectations, since probably the factors that you are using do work it’s just a question of the right blend in the RS. So I would not be quick to blame faulty PIT data for failing ports.
FYI, I have a series of public ports set up to do this sort of PIT testing. Instructions for using:
- Click here and do a search by username Chipper6.
- Click on one port.It should bring up a summary of results.
- Duplicate the browser tab.
- Save as a new Sim. Copy the RS too.
- Rerun making sure to set the sim start date to the start date of the port.
- Compare the equity curve of the two open tabs.
- Make sure to share your findings.
I don’t usually compare the actual trades because even if there were some differences it may not be ideal but it does not bother me. What I would be concerned about is a noticeable difference in the equity curve. That could lead to chasing some fool’s gold during optimizations, or perhaps ignoring a potentially lucrative factor.
Chipper,
Thanks for sharing. I still don’t think this method really works. Looking at:
Estimated Earnings Yield - Current Year - 7 Stocks - 03/03/14
One of the 7 holdings is different between the port and the sim. You likely have too few holdings in these ports. It’s still a question what makes the stock ranks different…but with only 7 holdings in these ‘tracking ports’, the differences should compound over time significantly.
Not clear if more holdings will help or not…at the root is what causes the different ranks…likely different ‘time’ for the updates in sim’s vs. ports.
Already a 15% different in returns after 6 months. In terms of ‘measuring alpha’…not precise enough likely.
Best,
Tom
Tom,
There is a sell rule of RankPos > 7 and a weekly turnover. So each week is a new test. Over time if the differences are random then the equity curve should be similar. But if the differences are biased then the equity curve will look very different. That’s how I uncovered the issue with short interest.
As for why only 7 stocks? Partially it’s because I can’t compare too many stocks at once over time. Partially it’s because I figure that people are looking for outliers. Why buy your 100th idea if you can get more of your best ideas?
Anyways, the point is that if the database is truly PIT then the results should be exactly the same.