[quote]
Create a new universe with the Starting Universe S&P 500 Index. Run Screen and download. All the info is there.
[quote]
Create a new universe with the Starting Universe S&P 500 Index. Run Screen and download. All the info is there.
[quote]
[quote]
[quote]
…the S&P500 Index downloaded from P123.
[/quote]I have not found this data on P123. Do you have a link?
[/quote]Create a new universe with the Starting Universe S&P 500 Index. Run Screen and download. All the info is there.
[/quote]I suspect that most differences are because the S&P 500 index is not strictly weighted by market capitalization. To quote S&P: [quote]
The majority of S&P Dow Jones Indices’ market capitalization-weighted indices are float-adjusted.
[/quote]So, comparing market caps of S&P 500 stocks to SPY weights, is like comparing apples and oranges. Instead, you need to compare float adjusted weights, which can be obtained by making a custom screen. See attached spreadsheet.
However, P123 does not have accurate float numbers for stocks with multiple share classes (such as Google). So many of the remaining differences are most likely caused by data errors on P123.
SPY_All_Holdings.xlsx (111 KB)
There is an emerging area of quant finance referred to as “stochastic portfolio theory” which begins to address the questions of optimal position weighting. One of its precepts says that the arithmetic mean return underestimates the long-term CAGR by one-half its variance. I.e., legacy estimates of small cap outperformance may be over-estimating the long-term rate of return due to the phenomenon which has become known as “volatility drag”.
Of course there is no such actual thing as volatility drag, but the risk of ruin is indeed much higher for under-diversified small cap holdings.
delete
Chaim is right, by the way.
While SPY can “rebalance” for any number of corporate actions (buybacks, share issuance, treasury actions) which can affect the public “float” in addition to a number of adjustments due to additions and removals of constituents, it is definitely not actively managed as per George’s suggestion.
David,
I think there is.
Volatility drag is just a definition: “The difference between arithmetic returns and geometric returns is the ‘volatility drag.’” Just as real as anything we can calculate in a spreadsheet.
And I agree: Geometric Return= Arithmetic Return -.5*Variance. I am not sure if this assumes a normal distribution or not, however.
It is “volatility harvesting” that seems like it cannot be real. But that too is real.
Thanks.
-Jim
I did not say that the ETF is actively managed, but the weights of the stocks in the fund seem to be.
BTW, I made a mistake with the GOOGL weight. The under-exposure is $576 Million.
Which fund specifically?
I am referring to SPY.
[quote]
I think they are actively managing the weights of the S&P500 stocks in the SPY portfolio
[/quote]Geov, given the fact that SPY claims to track the index, and given the fact that they are regulated by the SEC, how could they get away with different weightings?
Furthermore, why is SPY tracking error so low if they own different weights?
Furthermore, since the P123 market cap data is not always accurate (as you can see for yourself if you dig through the SEC filings for the individual stocks), why do you trust the P123 weightings?
Chipper, I don’t know what is going on with the weights. Also the weights in the float-adjusted Index differ substantially from the weights in SPY.
BTW where does one find the float numbers?
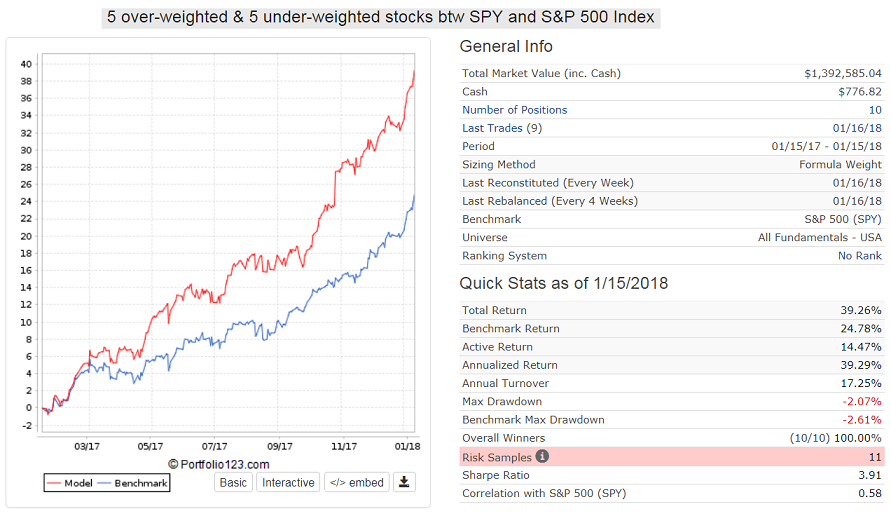
Here are the top 5 under-weighted and top 5 over-weighted stocks. Put them into a screen and you will see how they out-perform SPY. In fact one would do quite well checking the weights monthly and running a port with them. The 1-year return of these 10 stocks was 39% versus 25% for SPY.
under-weighted:
WMT
BRK.B
AMZN
FB
GOOGL
over-weighted:
XOM
JPM
JNJ
MSFT
AAPL
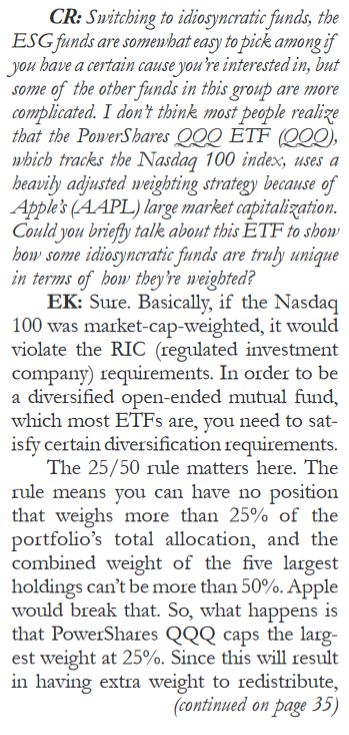
I do not know if this is directly relevant to the SPY mystery here but there was an article in Aug 2017 in AAII “The Four Groups of ETFs - An Interview With Elisabeth Kashner”
I assume I can’t post the whole article (copyright) but the screenshot is the relevant bit. Maybe a similar issue here?
Jerome
Jerome, thanks for posting this. There is obviously no requirement for the fund manager of SPY to match the index’s weights. So all they have to do is to match the daily returns of the index with dividends. How they do this is their business, and my assertion could be correct that the mis-balance is actively managed to provide additional profits for the manager.
Here is a scenario how the fund manager can earn additional income by managing the weightings.
Currently SPY has Total Net Assets= $281,049.38-M and an Expense Ratio =0.0945%. So all expenses are covered by this including a fee for managing.
If one uses a position weight formula: pow((mktcap),0.9), reconstitute and rebalance every week, you can outperform SPY every year except in 2006, but you would have plenty of money to cover this small under-performance from the previous excess performance.
So far this year (15 days) you would have an excess return of 0.10% = $281-M.
[quote]
under-weighted:
WMT
BRK.B
AMZN
FB
GOOGL
over-weighted:
XOM
JPM
JNJ
MSFT
AAPL
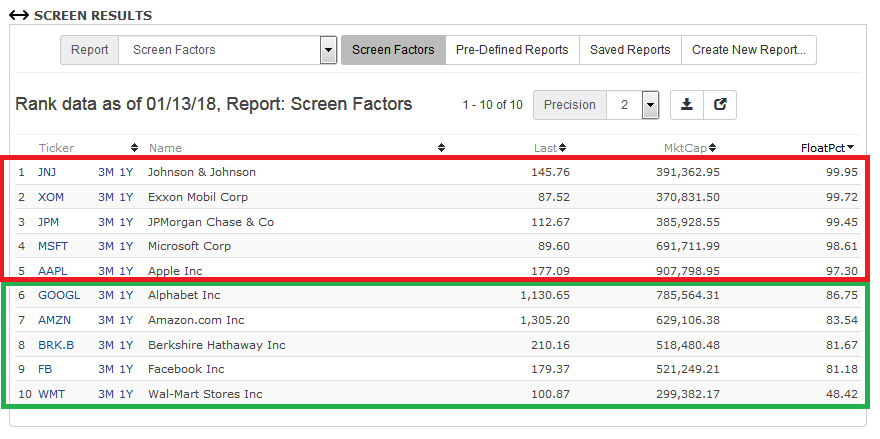
[/quote]Check out the attached screenshot. You should see a correlation between FloatPct and under/over weighing. That makes sense. FloatPct measures the percentage of shares outstanding that are publicly traded. Companies with a smaller FloatPct are smaller weightings in the index compared to their market cap and vice versa.
Here is a screen to calculate mktcap and float for S&P 500 stocks.
There are issues with accuracy. For example, GOOGL is showing a float of 602.70M shares according to P123 but only 297.20M according to morningstar.com. Some other stocks probably also have different float numbers for different data sources, which would explain why SPY weights don’t perfectly match P123’s version of float adjusted market cap.
Chipper,
Thank you for the screen.
Logic dictates that the under-weighted stocks should perform better than the over-weighted ones, which is indeed the case.
The 1-year return for the 5 under-weighted is 44.7%.
The 1-year return for the 5 over-weighted is 33.7%.
The 1-year return for SPY is 24.8%.
Good discussion.
It surprises me that this argument has drawn out with no one actually referencing the Prospectus.
From the SPY (S&P 500 SPDR ETF) Prospectus (https://us.spdrs.com/public/SPDR_500%20TRUST_PROSPECTUS.pdf):
With regard to RICs:
On prima facie, it would appear as though the index is purely a float-weighted passive vehicle. On deeper inspection, regulatory distortions may compel some limitations only on very large issuers (e.g., AAPL).
Despite the discrepancies, the SPY does not qualify as actively managed.
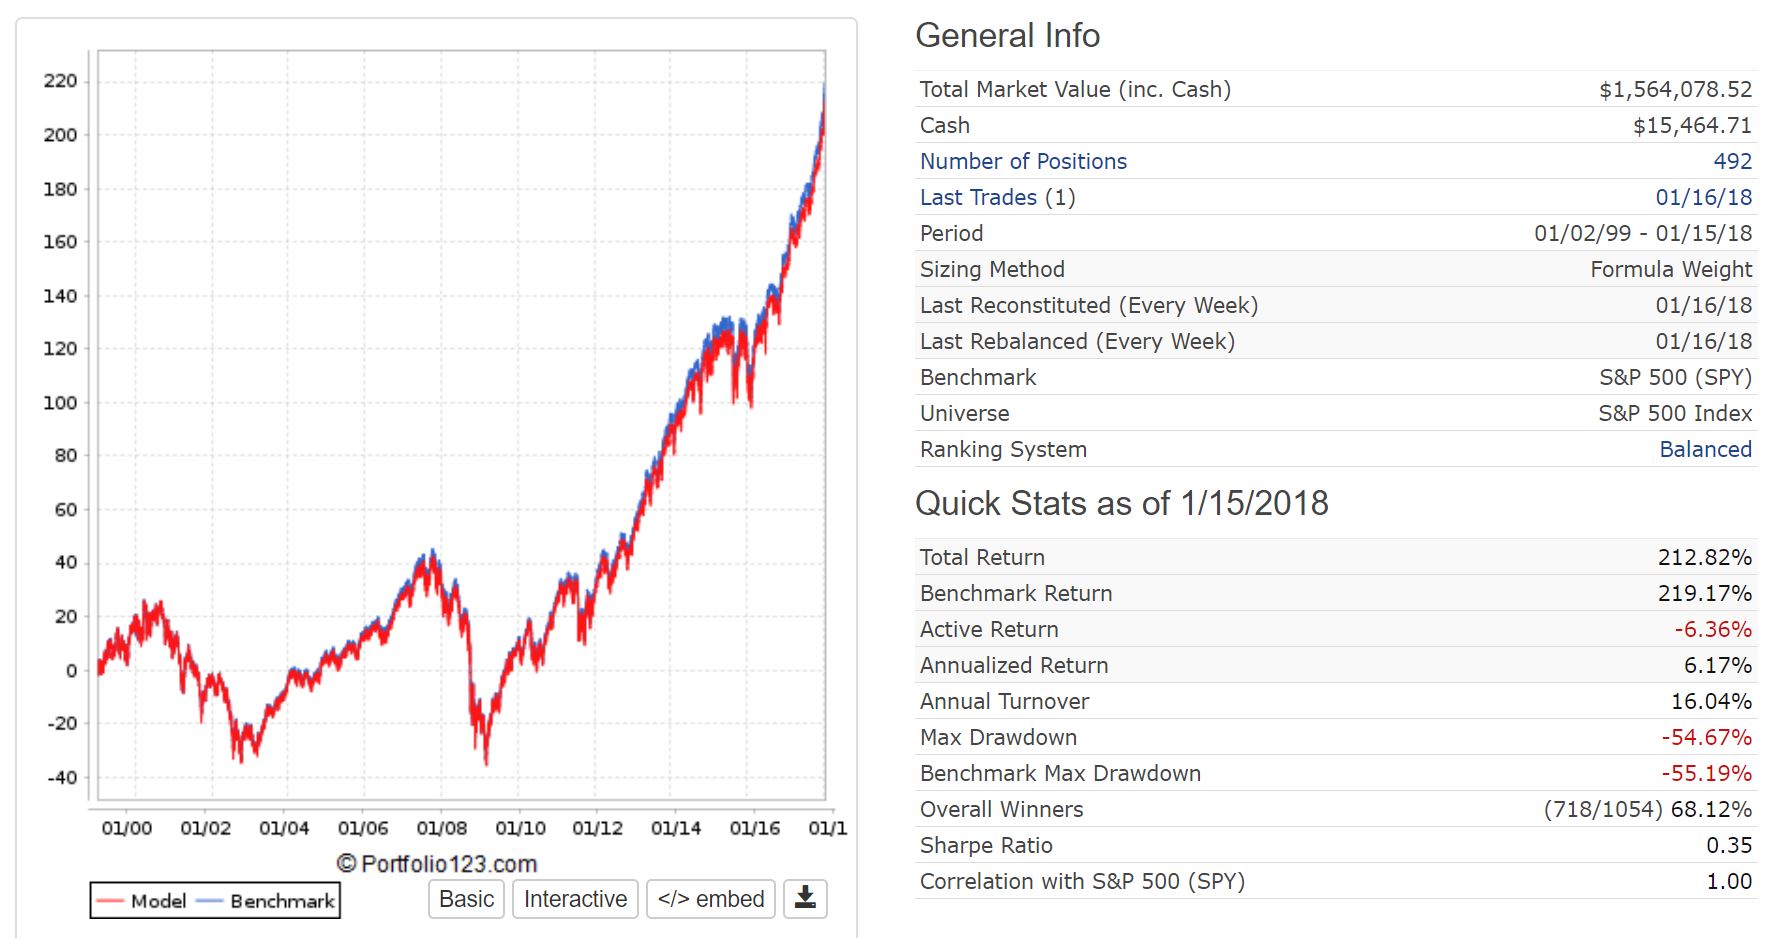
Here is by the way my attempt to rapidly replicate the S&P 500 index’s float weighted methodology: https://www.portfolio123.com/port_summary.jsp?portid=1517907.
As you can see, even though the constituent tracking is not 100%, the tracking error is minimal.
I.e., with simple assumptions, one can dispel the theories regarding active management of passively managed ETFs.
[quote]
It surprises me that this argument has drawn out with no one actually referencing the Prospectus.
[/quote]David,
Thanks for setting us straight. Note that I did post links to the S&P index methodology–which is practically the same thing. I left out the part about RIC diversification rules because it does not affect SPY.
All,
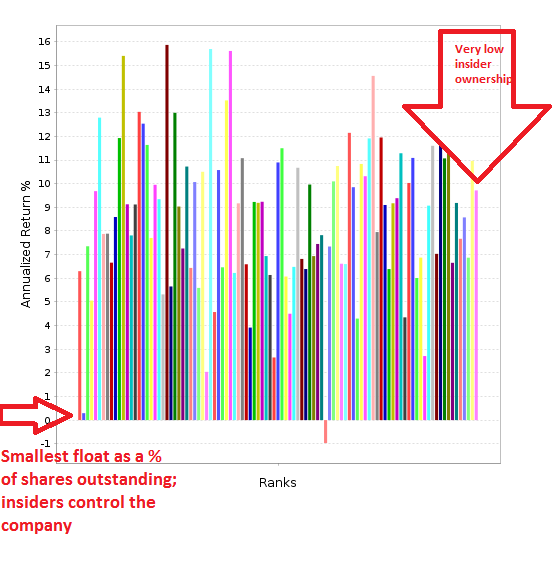
The attached chart is a ranking system with a single factor: “FloatPct” within the S&P 500. Notice how the five smallest floatPct stocks dramatically underperformed.
Theory: Stocks that are controlled by insiders do not have to answer to public shareholders. For example, Larry Page and Sergie Brim of Google already have more money than they will ever need. Therefore, they don’t mind blowing Google money on many projects where the goal is not necessarily to make money, but to advance the world’s technologies. On the other hand, CEOs of stocks with more outsider control need to perform in order to keep their jobs.
Evidence: The data does not conclusively prove or disprove this theory. Yes, the five stocks with the highest insider ownership did dramatically underperform, but the pattern does not continue for other stocks like it should. Furthermore, Google is not even in this group. Furthermore the outperformance of the highest FloatPct stocks relative the index seems to be similar to buckets 2-99, which owe their outperformance to the fact that the buckets are equal weighted while the index is cap weighted.
Primus, thanks for posting the SEC rules.
Nowhere does it say that a fund’s stock weights have to be proportional to the weights in the Index. So by adjusting weightings a fund manager can easily outperform the S&P 500 with dividends. If his portfolio shows a higher return than what is necessary to keep track with the index, he simply removes the excess into a side account. Should the manager underperform, then he adds funds from the side account back into the ETF.
This is what the fact-sheet says: The SPDR® S&P 500® ETF Trust seeks to provide investment results that, before expenses, correspond generally to the price and yield performance of the S&P 500® Index.
So all he has to do is track the S&P before expenses. There is no requirement to do anything else.