Don - congratulations on your many years of outstanding returns. I am where you were umpteen years ago. I’m looking for a good system but 5 years backtest isn’t sufficient for me. I have also found that adding too many securities into the mix reduces performance. I’m not really sure how the GTAA compares to the IVY portfolio but was surprised to see allocations such as below:
The actively managed Cambria Global Tactical ETF (NYSEArca: GTAA) weights U.S. fixed-income at 59%, international fixed-income 5%, international emerging markets 2%, U.S. stock 13%, commodities 1%, U.S. Real Estate 11%, cash 8% and currencies 7%.
I have been looking a long time for extended series of historical data for the main asset classes, or if you wish asset class categories (for the more picky readers). I had prevously found monthly data but wasn’t end of month. I think it was a monthly average price.
Please let me know if you have a source of historical data that I can get hold of and play with in EXCEL. Then I can take the results and model the last 5 years in P123.
I really appreciate the chance to see the different approaches to ETF ranking - ETFs are a new way of thinking for me.
One thing I never liked about the Ivy Portfolio was limiting it to 5 (or if you read the book, fewer than 5) ETFs. In creating my version, I decided to use 5 stocks for the US market and 5 REITs for the real estate portion of the strategy. This works well for me since it stays in the realm of stocks, not ETFs.
However, creating the ETF variant for Countries and Commodities has not been as successful. Using some of the ideas presented here, I came up with the following sim:
By the way, I do not commit 20% of the strategy to Fixed Income - just 25% to the other 4 components and let Fixed Income be the default when not invested.
Hi,
Jim, excellent sim. It’s performance relies in part on strong performance from the commodity funds over the time frame, as running the sim with a 1 year rebalance still gives returns of almost 10%/year. It is also different from the others mentioned earlier in that it has a shorter hold time and tends to buy reversals, rather than trends, but that can be a very effective approach.
Steve,
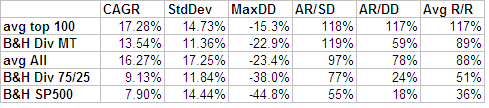
I’ll follow up with you directly. What I will say here is that I simply downloaded data from Yahoo and tested in a spreadsheet. I had 36 funds with most going all the way back to 1989, and I tested thru 2008. In one set of testing, I ran 368 rotation test cases plus a buy and hold SP500, buy and hold a diversified 75/25 portfolio, and market timing the 75/25 (think I used the 10 month moving average, of the market, not the individual funds). The advantages of momentum is shown by sorting the results by risk adjusted return (AR/((StdDev-MaxDD)/2) and absolute return. The percentiles are below, where 100 was best, 0 was worst.
In these tests I rebalanced monthly, but I varied the lookback period, the method for measuring momentum, the number of funds to hold, how aggressively to sell, and tested with and without market timing. That ALL cases beat the SP500 and perform so well relative to a diversified portfolio really sold me on the approach.
Jim - I had a look at your sim. One of the issues I have with what you are doing is that there are at least 37 funds that meet your buy criteria.
When I looked at your realized trades it was apparent that there is a tendency for the system to select all of one fund type. For example, for the 5 trades closed on Feb 13, 2011, all five were bond funds.
This is not to say what you are doing won’t work, but there is no diversification…
I appreciate your comments about asset rotation and testing. I very much like to do my own testing to confirm ideas. I find this helps me stay the course when an approach has one of its draw downs.
I’ve got a few questions about your table of test results:
To what does the “avg top 100” refer? Is that a benchmark you constructed by averaging the top 100 etfs selected in highsight? Or is that one of your ETF selection methods? Or is the top 100 best runs in the 368 tests done?
Simiarly to what does “avg All” refer? To the average of all 368 of the tests?
Hi Brian,
Avg all is the average of all tests, even the buy and hold (it was easier to do)
Avg Top 100 is the average of the top 100 sorted on risk adjusted returns, which is Annual Return / avg(StdDev, MaxDD). I think this is useful because some of the parameter selections I made were not very realistic, and with the hindsight of testing I saw advantages in some approaches over others. No guarantee that these advantages will hold up in the future, but that’s how I would bet, and so I think this avg is something of a benchmark for the rotation approach during this timeframe.
I feel in trading a Port of your Sim it will be difficult to get the performance the Sim shows. 2 reasons:
The slippage is very low at 0.025%. For a liquidity of $5 Mil/day I have found my real slippage to be slightly > 0.1%. To be a little more conservative I run 0.2% slippage with $5 Mil/day & 0.1% with $10 Mil/day.
The average gain/trade is only 0.81% (from the statistics, Trading Page), and any additional slippage will eat most of that up. I don’t consider trading a Sim that doesn’t show > 2% gain/trade using a conservative slippage.
This Sim trades 2 long only ETFs, $10 Mil/day liquidity, rebalances weekly, and it uses 3 market timing rules.
It has an annual return of 18%, a Max drawdown of 18%, total return of 544% and 65% winners. The average gain/stock is 5% and the average days held is 70.
Don, Steve and Denny - thanks for the feedback. All good and things I need to address.
I wasn’t trying reversals per se, just trying to avoid Faber’s use of DBC for trending. I generally use the weekly refresh to weed out stocks dropping in rank, but the turnover here is huge. Is there a way to check without the high refresh?
I looked at the bond fund periods as a signal to go to cash. The screen version of this turns out to be an interesting market timing mechanism. If I cannot find a mechanism to limit the commkodities to 2 or 3 per type, I was planning to create a list. Is it possible to detect the shift to bonds in a sim and buy nothing?
Because my stock sims generate few trades and have high average gain/trade, I have been pretty sloppy in examining slippage. Something I intend to change.
Hi,
Regarding turnover. There is generally a tradeoff between performance and turnover. In my experience higher performing strategies tend to have higher turnover, and so trading costs have a much bigger impact. I’m not sure which ranking system you are referring to but simply holding to a lower ranking will lower turnover and likely decrease performance but also trading costs.
To identify when bonds are top performing, perhaps you could use forder to sort all ETF’s, select the top 1, and check it to see if it is a bond fund. I expect going to cash will underperform going to bonds.
Using the P123 Piotroski system and adding liquidity criteria and EPSCurrYr timing gives me a long holding period (about 200 days if I remember correctly), avg return/trade over 30%. Increasing the turnover does not seem to help performance.
The ETF ranking systems seem different but it may be due to my lack of experience in thinking this way.
I am going to try the forder approach you suggest as soon as I have a little more time. Thanks.
It seems like the sell rules (with the exception of trailing stops) are only evaluated at the rebalance. In that case, I need to incorporate something like what Denny demonstrated.
I’m starting to look into ETF ranking systems to use in my Fidelity 401k. They have a number of ETFs that trade commission free which is of use for low capital or higher frequency systems, though trading restrictions are 30-day minimum for the free ETFs.
Is anyone willing to restart this discussion or share a starting point for an ETF ranking that would work well under these constraints? Thanks!
Caley, some momentum factors actually do better with four week rebalance rather than weekly. Thirty days is close enough to four weeks to make it work.
I don’t have a ranking system but I do have some suggestions on designing an ETF book which did not exist a couple years ago.
Diversify with stocks, bonds, gold, ( I don’t like resources)
Diversify with many designers including yourself.
Use different market timings and Hedging
Here is a book that would cost less than $100 and by playing with the Assets and Hedging you can get the drawdown lower than 8% with a return of 20%. This might not suit your needs for free trading but it would come close since it is low turnover.
Is there a way to see what portfolio are responsible for what % of the total book return? And I supposed there’s no way to see the underlying systems of 2 of the 3 since they are R2G models.
In the book click statistics and then click Risk to see the individual results. You can also create your own book and just add the smart alpha models individually. This will give you much more detail and history.
There is no way to see smart alpha models but both of them have about 2 years of OS. One is all bonds and the other acts like a Hedge using stocks. Not much OS so it makes me nervous. Not to mention all the bad press about Bond ETF as the next bubble but there is not much choice.
• When markets are good there is 33% bonds and 67% stocks (More if you use leverage)
• When markets are bad and all portfolios are bullish there is a minimum of 33% bonds, 33% Short Stocks and 33% cash.
The timing is not right all the time so it will be interesting to see what the future results are. I expect it to beat the market by a few points over the next ten years and to suffer some heavy drawdowns during the next bear market.
The concept is when times are good add more stocks and during bears short and go to cash at the same time always be diversified.