http://www.ritholtz.com/blog/2015/03/three-commandments-of-stock-valuation/
Interesting, lets have a look at our Rankings and try it out…
Regards
Andreas
http://www.ritholtz.com/blog/2015/03/three-commandments-of-stock-valuation/
Interesting, lets have a look at our Rankings and try it out…
Regards
Andreas
Andreas,
Thanks! Good article and I added the blog to my favorites. I have always like Barry Ritholtz and I didn’t know he had a blog.
Thank you Andreas, thats indeed an interesting one! This blog is my favorite daily must-read.
Here is one of the two papers cited:
http://csinvesting.org/wp-content/uploads/2012/09/tev-to-ebitda-research.pdf
Btw, the authors also have their own blog, called Alpha Architect.
Thanks for sharing. It appears to me that in the p123 community this metric is well known, and I would be surprised, Andreas, if you are not using it in your rankings already… ![]()
EV/EBITDA is also one of the highest alpha-generating factors in Tortoriello’s book:
http://books.google.dk/books/about/Quantitative_Strategies_for_Achieving_Al.html?id=gak10pWSMxIC&redir_esc=y
Sister - Andreas is referring to its use on the entire S&P 500, not on an isolated stock.
Steve
The confusion arises because Ritholz quotes research into relative stock valuations, and then just assumes that this can be applied to the market as a whole.
I tried plotting total SP 500 EV to total EBITDATTM using a custom series on P123. Excluding Berkshire Hathaway and NAs, this was around 10 in the years leading upto the financial crisis, and then dropped to around 6.7 in March 2009. But it then when back above 10 by December 2009.
Assuming that you somehow knew in advance that 10 was expensive and 8 was cheap, you would only have been in the market from October 2008 to Sept 2009, and then from July 2011 up until around now. Some other points:
(1) The whole period from 1999 up until the crisis was in the expensive zone.
(2) The market was also signalled to be expensive at the end of 2009, presumably because earnings were depressed at that time.
(3) By my reckoning the market is as expensive now as it was in 2007, contrary to what Ritholz claims.
I don’t think this is a credible market valuation metric.
Sorry, did not check the post herel, I was on the road.
Yes, I probably use is already, I will read the paper again to stirr my creativity and have a look where I use it and will Isolate it in order to
see how it works.
Interesting Thing is, that in my own Company I always look at ebita as the short term primary number to be influenced in the short to middle term, since tax can not be avioded and interests only be influenced longer term.
In Terms of market valuation it should be interesting to relate Ebita and EV to interest rates, I this Terms the market could not be expensive.
Regards
Andreas
Andreas
The EV/EBITDA ratio is a well-known ratio that has been used in the popular press for many years. Joel Greenblatt used it as part of his ‘Magic Formula’ in his 2009 book, “The Little Book That Beats the Market.”
Personally, I have never had much luck with this ratio. In my latest rank assessment, it stands at about 1,900th out of 3,000 factors/formulas that I monitor every quarter, with an annualized return of only 17%.
I’m a fan of Mr. Ritholtz work, but I’m not sure that quantitative market analysis is his forte´.
Hi Chris,
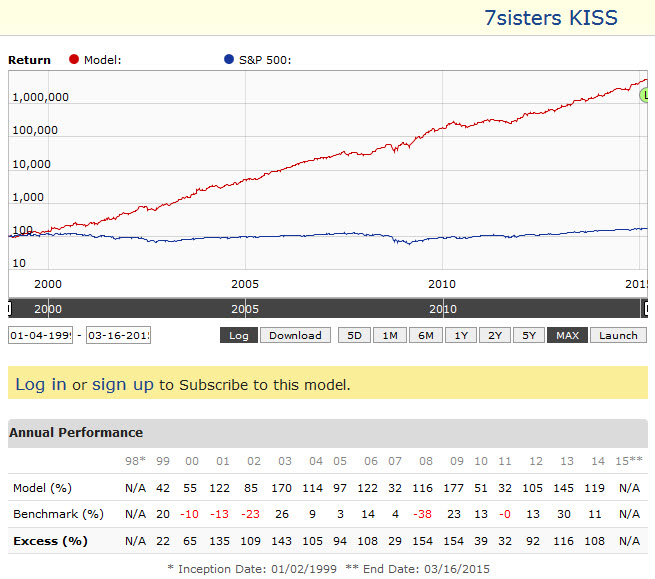
interesting to hear that this ratio is ranking so low in your assessment. I used it as a significant component in the below model.
https://www.portfolio123.com/app/r2g/summary/1335509
Good point. I shouldn’t have made a blanket statement like that. It depends 100% on the basic set-up of the sim/port. For my purposes, since I am running a public newsletter at IntelligentValue.com, I must maintain higher liquidity, less trading, and other spec’s than might be used by an individual investor. For example, my live (since 2004) subscription-based model portfolios have a turnover of only 3-4 stocks a year and a minimum liquidity of as much as $80 million (and I still get 100%+ live returns). Those initial conditions dramatically affect the outcome of each factor/formula we examine. Some work well with one basic setup and terrible with another setup. That would probably explain the difference.
That’s a sweet-looking equity curve you are showing. Actually, there’s not much of a curve to it at all. It’s almost linear. However, I believe you are advertising an R2G that was launched just yesterday. I wonder if you have successfully traded the system with those results pre-launch, or is it all in-sample backtest? Thanks.
Hi Chris,
I see where you are coming from. I definitely cannot offer an $80 Million liquidity ![]()
I have not traded the above R2G, but since end October I am trading a somewhat less aggressive private portfolio with similar ranking and equity curve. Overall return so far 24% of the port compared to the 40% simulated return of this R2G.
I wonder how good a steady capital curve is in predicting out of sample performance. If you have any experience or statistics regarding this, I would be happy to hear about it.
alpha architect has a post about the market not being overvalued as they measure various value metrics:
Not sure whether their metrics are market cap weighted or not, which would make a difference.
I’m pretty sure that the authors of Quantitative Value said at some point that value ratios work for individual stocks but they could not get them to work for the stock market as a whole.
One of the portfolios I provide to my subscribers is called the DEEP VALUE Portfolio . In this portfolio, I look for companies selling at discounts to a variety of fundamental ratios which I deem to be ‘deep value,’ i.e., liquidation value, Graham’s net-net, price-to-book of 0.5 or less, or EV/EBITDA ratio of 3 to 5. This portfolio has a real-life, out-of-sample annual return of 168% since 2009. However, lately I have had very few - or no - stocks in that portfolio because there simply aren’t any from which to choose that meet my definition.
I’m writing an article about this subject for this weekend’s newsletter. In it, I am going to feature the following chart showing that the number of deep-discount EV/EBITDA stocks is very low:

The chart shows that of stocks with some minimum liquidity requirements, there are only 3.2% trading at a deep-value, EV/EBITDA multiple of less than 7. If we search for the deepest value stocks (multiple less than 5), there are only 7 publicly traded companies that meet that criteria. I am finding the market to be quite expensive as I search for viable candidates for my value-based portfolios. Fortunately, I have other portfolios than Deep Value, so I’m still able to provide strong returns, topping 100% on average.
Even if the market is expensive today (Russell 2000 has a PE of 85!), history shows that traders go wild with greed before we see a sell-off. I don’t believe we’ve hit redline on the total-stupidity meter yet, but I am watching the charts for signs of mania (which is followed by crash) more carefully these days. However, Janet Yellen just announced that the Fed is going to continue the QE morphine fix, so the market shot to the moon again. Keep the party going!
100% annually that is amazing. That is the problem don’t give out your trade secrets in a newsletter. Some very simple screens beat the market by 10-20%. However I could not get EV/EBITDA to work for me. BOOKVAL/EBITDA worked better.
William (berggrenwwll),
Yes, I actually have a AR of 168% for my small-cap Deep Value Portfolio and a return of 103% for my mid/large-cap Relative Value Portfolio since 2009. That’s real-time, live performance published for the world to see (if they are subscribers to my newsletter).
However, I have a secret method to get those returns: I ‘cheat.’ It’s cheating when compared to the R2Gs that are running here. Here’s how I get my results:
The market changes and you must change with it to exploit the opportunities it presents. In 2009, deep-value, price-to-cash/cash-flow produced a return of 1600% for me. In 2015, it’s a mature market and it requires a different set of factors. That means a lot of work analyzing what approach is currently effective; you can’t expect incredible results from a Sim that’s tested over 15 years. The market has had (and will have) incredible turbulence during that time (and into the future). Different approaches exploiting different market opportunities is needed.
All of my approaches are based on identifying value. Although Wall Street and most investors are obsessed with predicting the future, real money is made by identifying mispricing here and now. I can’t exhort you enough to buy stocks at a discount to some intrinsic value and sell when the stocks have reached that intrinsic value. It works! Just ask Seth Klarman, Bill Miller, Whitney Tilson, Joel Greenblatt, Marty Whitman, Walter Schloss, James O’Shaughnessy, Warren Buffett and many more…
I use a proprietary market timing system that isn’t available on P123. It works in all market environments and virtually eliminates significant drawdowns. Most investors try to ride out those drawdowns and it destroys returns. Drawdowns are the bane of annual returns.
A friend of mine said he was preparing for a 69% drawdown in the next few years. That’s just unnecessary! Most system designers have to add a multitude of stocks for diversification to try to reduce the severe drawdowns. That’s a recipe for mediocrity. I run concentrated, yet robust 5 and 10-stock systems. They are robust during the times when my system is giving ‘Market Up’ signal. When it’s ‘Market Down,’ I’m in cash or short, so I don’t even analyze stocks during the Market Down periods. Plus, it’s not a lot of trades from my system; 1.2 trades per year (avg). Don’t trade in and out, churning your stocks; my Ports have a turnover of just 240% per year!
My system exploits drawdowns, getting me in cash at the optimum time, with no whipsaws, and get me into an inverse ETF at the optimum time, making money all the way to the bottom. Then it identifies the bottom and loads up on deeply undervalued stocks at exactly the right time. In the last crash, the system gave me a ‘Market Up’ signal on 03/09/2009. I use StockCharts.com for my timing system. TradeStation will also work. It took me several years to figure it out, but I’m probably slow and you can do it faster.
So that’s my secret for ‘cheating’ and getting those great results over extended periods of time. Hope that gives a few people some ideas for getting their own 100%+ returns.