Good points. One thing this has me revisiting is the turnover rates I target on my lower turnover, big market cap systems. 100% to 300% turn systems where most winners are held just under the 365 days are still all short-term tax gains - that likely doesn’t make much sense. I will likely either push these systems to be all (or most) long-term cap gains or slightly higher turn (say 500% target). That way, I think, the odds are more in my favor. This is a few live systems of mine. And 3-4 of my R2G’s. I’m gonna have to do more work on this and look at it again. I was still using some huge tax loss carryforwards from '08. But…it’s a little hard to untangle when a system is hedged and uses partial sells. The stats are a mess on this for P123 reporting.
Tom - if you hold a stock for two years, you only pay long term capital gains once. If you turn over stocks 5 times a year then you have to pay capital gains on five stocks, assuming profits on each. This is where pvdb comes in and says that the difference between compounded and simple tax is insignificant. Anyways, your guess is as good as mine.
Anyways, at the higher tax brackets, you are taxed about half or less than ordinary income.
But in any case, it really comes down to post-launch performance. I’m banking on my models holding up. The golden color will eventually fade from these high flyers.
Steve
Steve, I was talking about simple vs compounded GSD, and I know next to nothing about US capital gains tax… seeing as I don’t pay any… sorry for rubbing it in ![]()
Btw, the weather overhere is awful. Pretty much the same as the UK…
FU had an outstanding balance sheet, the problem is that it was BS.
I take this opportunity to rerequest a review of the way halted stocks are handled. Right now they are considered sold by the algos at the last known price or so. This is potentially VERY misleading. If a strategy backtest picks up a stock that gets delisted, the backtest will not show the almost total loss incurred thus greatly overstating the strategy performance (esp with 5 stocks). This is potentially a huge problem.
Tl;dr it’s actually possible that the backtests are just wrong.
I’m very concerned about this issue.
Justin et al -
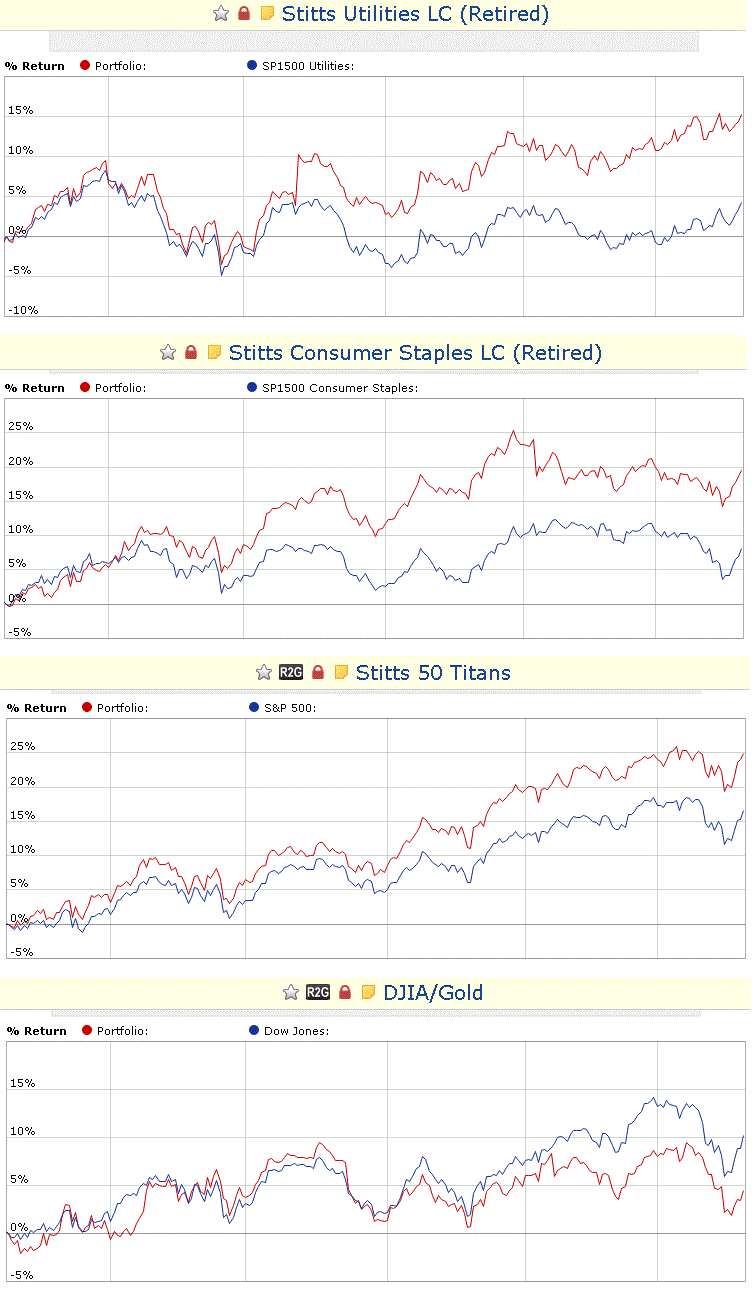
Just for the record, here are the four models I started with last year. I don’t know the start date so I am using March 15, 2013. I have one “eye-sore”, my DJIA model which was originally named Stitts Gods of the Dow but I recently changed the system and name to DJIA/Gold. It is a 5 stock system and the DJIA is apparently very hard to keep up with. Now I’m waiting to test the fix to the latest PP123 bug to see if it has impacted the DJIA results. I retired two of the systems due to lack of subscriber interest.
I have several LargeCap systems released in September that are doing just fine, even while many of the smallcap systems were self-destructing. There are many other LargeCap systems doing great such as geov’s R1000 system.
Sorry but I don’t buy in to the comments that were made.
Steve
@Steve - I was largely commenting on the rocketship R2G’s with super high backtest AR’s that are somewhat or greatly liquidity constrained, and whose whopper AR backtests generated the subscribership.
Its hard to disagree with the idea that a bunch of small holding (ie 5), low-end of the liquidity scale focused R2G’s will show higher out of sample variation than strategies holding 10-20 positions in big cap names. Marc Gerstein, Olikea and several others have consistently observed that ramping down the # of positions, liquidity, & over optimising all juices the back test results… but this doesn’t mean those ports will deliver the same results out of sample… but nor does that mean that these R2G’s/ports won’t outperform their benchmark. Just not as much.
Its unreasonable to expect a port / R2G to outperform its benchmark out of sample by 10x+ the way it did in the backtest, and its reasonable to think the highest AR type R2G’s will have the highest variation in outcomes. Doesn’t mean as a group they won’t outperform.
@aurelaurel - FU was the most extreme example of something that popped up in a few R2G’s / ports that went way up and way down super quick… but there’s others not so far off… quite a few things Argentinian got picked up with a similar but not as complete outcome…
Justin - sounds like we are on the same page then. However, these are all “high risk” models and many people don’t realize that there is a downside to low liquidity, and that occurs with an extreme bear market. You can put any kind of spin on this but ultimately one should never put more than 10% into these high risk strategies no matter how much they outperform. Thus the majority of stock investments should be in higher liquidity. Throwing darts may be a good strategy ![]()
Well, I don’t agree that 10% is the max amount to put into high AR strategies. High AR R2G’s may have volatile performance individually, so get a basket of them, as a group they’re doing pretty good.
And just keep following them. Don’t try to pick just the one, get a handful. Over time a set of high AR R2G’s/home grown small cap value momo ports will outperform big caps, likely by a serious margin. The longer your holding period, the more this is certain.
Justin - sounds like you will find out the hard way ![]()
Very interesting discussion here.
It looks like many R2G systems have a strong micro/small cap component, in the sense of explicitly ranking stocks based on market cap. That was a winning bet in 2013, and in P123’s 1999-2013 sample period, but one can’t count on it going forward.
The size effect is not robust.
For example, in 1984-1998 big stocks outperformed small stocks by a large margin, as you can see in the figure below. The figure uses data from Ken French’s website.

Great chart. Thanks. I’d amend what you say. The size effect is among the most robust factors ever found. Over more than a century. Across countries and markets. But it’s just not perfect. It can underperform (as can any single factor) for a decade or more. But it’s a very robust factor. Among the most widely studied in finance. There are no perfect factors.
As always gets repeated…The ‘best’ thing for most people is a proper risk goal…and then an allocation to a lot of diverse systems - that do different things conceptually - to try and meet that goal.
For multi-factor rankings…without universe level constraints…many use momentum or mean reversion and value of some sort. And fuzzy logic…So…very hard to know what cap ranges these kind of systems would have been in in those periods.
Sandrade, the size effect is very robust. From the front page of French’s website: “Small stocks tend to have higher average returns than big stocks, and value stocks tend to have higher average returns than growth stocks”.
Their data goes back to 1926.
Interesting chart though. Back to back periods flip the conclusion. Somewhat similar to Ray Dalio’s “There is no such thing as asset correlations”. (or some such). Correlations are simply the outcome of economic conditions, which change, and thus the correlations / relationships change.
Still, over the long long run, small caps and value stocks are the winners.
Justin and Tom,
here is another one, from a Fama and French paper published in 2013:

Look at the SMB column. SMB is Small-Minus-Big, (arithmetic) average monthly return in % of a portfolio long small stocks and short big stocks. The sample is 1990-2012.
No statistically significant size effect anywhere. The opposite direction in Europe, Japan, and Asia-Pacific ex Japan.
I’d have to see the paper.
See “Expected Returns” by Antti Ilmanen. Shows small value earned 14.8% from 1926 to 2009 vs. 11.8% for Big value, 9.3% for big growth. So…about 3% alpha from 1926-2009 for just small. From 1990-2009 shows us 14% for small value vs. 9.1% for big value. So…small value’s been fairly consistent, but big value returns fell by about 2.7% over this period. Alpha to small caps grew.
I have read many papers from Fama and French demonstrating the existence of this effect. Back in school until now. That’s partly what Dimensional Fund Advisors was started on…and has exploited. So…I think there’s something off in either the specific paper you’re referencing or how you’re interpreting it.
Justin - just wait until we have a reasonable market downturn. When you start seeing 5%-10% drop across the board on your smallcap stocks you will realize the error in your thinking. If you think this won’t happen then just look at some of the smallcap R2Gs. Some of them have had in excess of 5% daily drops and these market conditions have been among the best. If you think your low correlation ports will persist during a bear market then think again. They will all go down in tandem. Largecaps may not perform any better but the difference is you can get out of your positions without taking a bath.
Steve
Anyone who still doesn’t believe that small cap stocks outperform large cap stocks need to look at this comparison. I read a study (I can’t find it now) many years ago that caused me to change to trading only small cap stocks. The jest of it was that if you buy the best ½ of the stocks in the R2000 and hold them for 1 year, they will significantly outperform the best ½ of the stocks in the S&P500. They used a single factor, earnings/share, to determine which stocks were in the top ½ of each index. They back tested it over many decades (I don’t remember how many).
First, we need to accept that in the small cap universe there are many just plain bad run companies that we would never buy with a reasonable Sim (hopefully). The ratio of “bad stocks” in the R2000 is much higher than the ratio of bad stocks in the S&P500. There is just too much scrutiny on the S&P companies that forces them to perform or find new leadership. There is also an Indexing effect that actually reduces the difference by which the R2000 stocks outperform the S&P500 stocks. That is, that the best stocks in the R2000 over time move up to the R1000 and out of the R2000 so their higher performance is no longer considered as a “small cap”. While the best S&P500 stocks have nowhere to move up to so their performance stays in the S&P.
I set up 2 simple 100 stock Sims to compare the best large caps to the best small caps using a 2 factor ranking system, MktCap (lower is better, 70% weight), and earnings/share (EPSExclXorTTM higher is better 30% weight). They have no fees, rebalances weekly, sells all stock every rebalance, and allows sold stocks to be re-bought. So both Sims select and stay in approximately the smallest 100 stocks in each index. I also included a AvgDailytot(60) > $100K buy rule in the small cap Sim to avoid some of the weirdness of smaller micro caps.
You can see the Sims here: Large Cap Test , And Small Cap Test ,
The small cap Sim outperforms the large cap Sim by 6%/year with about the same DD. That’s a hard return advantage to ignore. Obviously, better ranking system and buy-sell rules will result in far better performance in both indexes.
Denny ![]()
A few more random stats:
Ibbotson shows that from 1926-2005, the smallest decile of stocks returned just over 16% above the risk free rate. The largest decile returned around 6%.
Some other studies:
Small stocks have also outperformed in Europe by 7 % / yr. From 1955 to 1984 (Paul Marsh and Elroy Dimson)
In France…from 1975 to 1989 - 32.3% vs. 23.5%. Germany was a tie.
Japan. From 1971 to 1988 - 23.6% to small. 18.6% to large.
Periods in the US where small lagged big. In some cases by large amounts.
1926-1931
1951-1957
1969-1983
So…small can underperform for fairly lengthy period. For what’s it worth, nearly all of the historical small stock premium in the US is possibly confined to January, specifically the first week in January.
All stats from ‘Global Investing’ by Robert Ibbotson and Gary Brinson.
Tom (and anybody else reading),
The paper is “Size, Value and Momentum in International Stock Returns”. The sample is from 1990 to 2011. The take-aways from the paper are:
-
There is no (statistically significant) size effect in that sample period, anywhere. In that sense, the size effect is not robust. If you think 21 years is not long enough of a sample period, well, we can agree to disagree on that one.
-
There is a significant value effect everywhere, and a significant momentum effect everywhere but in Japan. Moreover, the value and momentum effects are stronger smaller stocks. This does not contradict point 1) above.
If you are into data, you can download country-level results from Andrea Frazzini’s webpage: http://www.econ.yale.edu/~af227/data_library.htm (look for Global Factor Returns).
Best
S.
The smaller the markets, the less efficient they are. It’s a universal rule. The less efficient the more opportunities.
It applies in real estate as well. Finding a really good real-estate bargain in Paris is next to impossible. In the small towns, very possible.
Now buying indiscriminately the micro caps is not our approach here since there is as much chance to overpay than to underpay for these stocks. Less efficient doesn’t mean things are cheaper, it means our screening process is much more likely to turn up with the few gems and be able to exploit the disparities between the offering price and the intrinsic value of the stock.
So going for smaller markets is just giving a chance to our algos to work better.
These studies consider buying every small caps in bulk vs every large caps in bulk, an approach hardly relevant to us since we are stock picking. These talks belong in a thread “SPY vs IWM”, not in R2G.
The point is not “how much better smallcaps perform over time”, the point is “how poor you are going to be after the next bear market”.
Steve