Even if you continue to use P123 classic to rank stocks machine learning could help

All,

I have been thinking about and discussing with ChatGPT different ways to rank stocks. There may be other ways but P123 is a fine way to do that.

But are we really done after we have the ranks? For now we use a simulation to develop a “heuristic” for what rank or RankPos to sell at. It works ON AVERAGE, no doubt. We can backtest over long periods and find would have worked (again, on average). You have probably seen the positive results in your ports.

For individual trade decisions this is often wrong—for a highly ranked stock with low liquidity and high transaction costs for example. It may not really be in your benefit to pay the transaction costs to buy it and sell a holding that would have done fine (and not have to pay the transaction costs to put it in your port). It tends to even out and works over the long-run. The sims prove that. No debate.

The sims have an estimate for the transaction cost which, perhaps, could be improved or tailored to the amount being purchased. But a sim never makes any attempt to actually calculate the expected returns. That information would not be impossible to incorporate into my decision process now, I think.

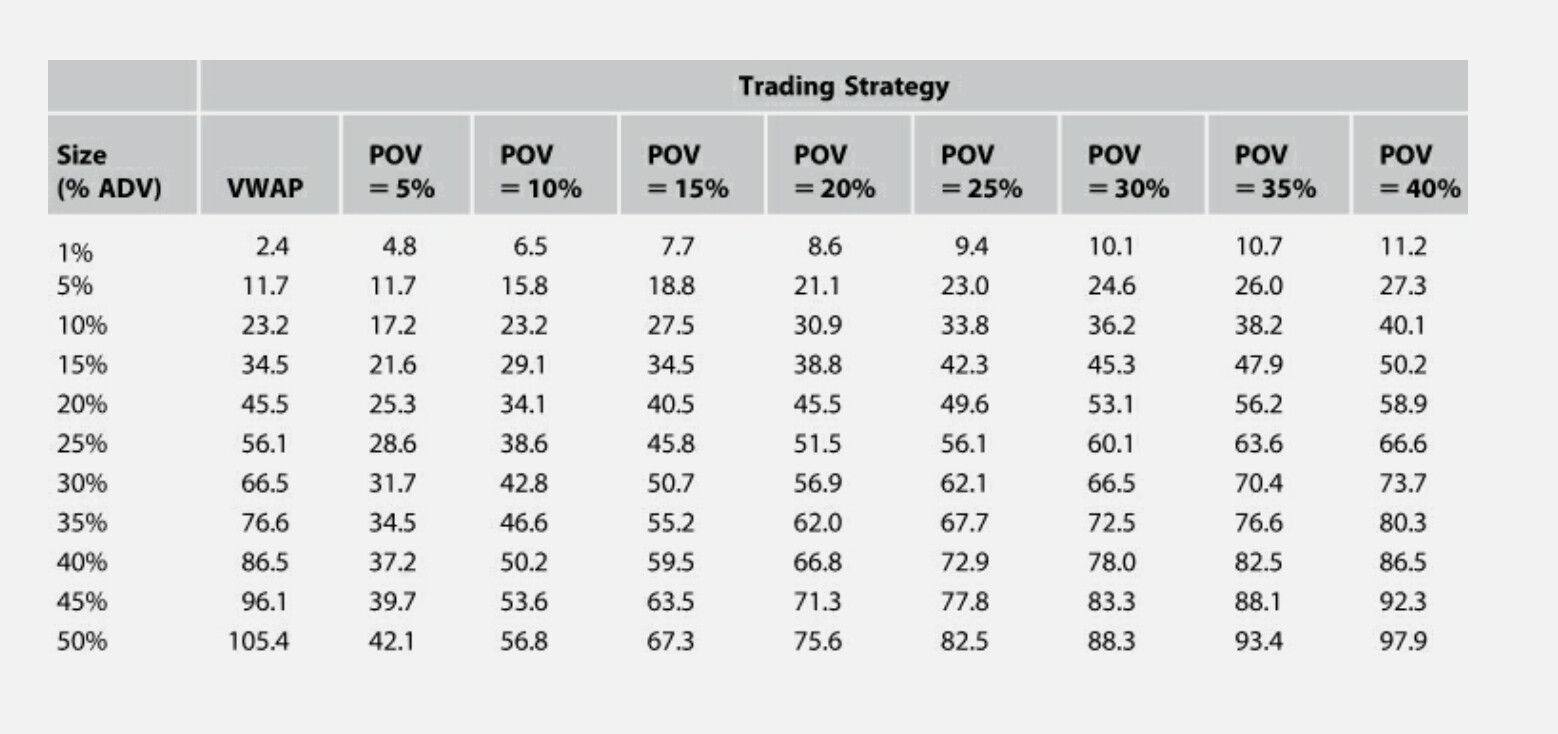
I would have to predict returns as well as predict transaction costs with some accuracy (reasonable variance) and low bias for this to work. I note that @Yuval and others have good methods for predicting transaction costs. You can find that in texts also. For example: The Science of Algorithmic Trading and Portfolio Management: Applications Using Advanced Statistics, Optimization, and Machine Learning Techniques

Or use this table from the book. Develop your own table using @yuvaltaylor formulas. Add bid/ask spreads on your own, etc. But Yuval’s formulas are excellent.

So ChatGPT agrees with my formula on how expected returns and transaction cost can give an exact understand of when a trade is in your benefit. So I just copy that from our discussion: “ExpectedReturnofBuying−ExpectedReturnofHolding−TransactionCosts”

TL;DR: P123 as an excellent method for ranking stocks that has stood the test of time. You could still using machine learning to supplement this ranking information

Ii think it could be done in a spreadsheet once you have the expected returns and transaction cost . I am sure I will at some point.

@marco here would not be a a lot of data or computer resources required to use @yuvaltaylor transaction cost calculations with the higher-ranked stock (with whatever methods one decides to use for expected returns using P123’s AI/ML).

At the end of the day, it is just subtracting 2 times after using whatever method you find useful to get the expected returns and transaction costs first. Seeing if the number is greater than 0 or above some threshold. For now, I could probably figure out an elif (or simple if/else) for that when I get tired of using a spreadsheet. Maybe loop over several iterations of different ticker combinations. Using @showvar in the screen to get the transaction cost or incorporating the data in an API download. Doable and probably useful for me.

ChatGPT simply says “……integrating a Boolean condition based on expected differential returns and transaction costs is an effective way to make data-driven trading decisions” which may be clearer that what I wrote.

Jim

1 Like

Thanks, Jim. There are some good ways to integrate ranking-system stock-picking with the subtraction of transaction costs from the expected returns. This has been a large focus of my research and trading in the past year. I tried to get at this in my latest blog post. Essentially you match your position weight to the rank-and-transaction-cost-based expected return by creating a rank-based or rankpos-based formula and then multiplying that by (r - c) / r where r is the expected return of an average stock and c is the formula for the round-trip transaction cost. For the actual purchase of stocks you use a buy rule that does something similar: FOrder(“rank-based formula for expected return - transaction cost”) <= x, where you want to buy the top x stocks.

I love ranking systems, but I am looking forward to also trying a ML-based non-rank-based system for stock-picking based on a return prediction algorithm. I realize that ranking isn’t the only game in town, but I prefer to wait for P123 to roll out its machine-learning interface before exploring it on my own.

Also, I have been pushing P123 to implement formula-based slippage, where users will be able to input their own formulas for slippage in place of the variable slippage formula. This has the potential to improve backtesting a great deal.

3 Likes

Yuval,

Your comments are much appreciated. I, like you, look forward to the simplicity that P123’s AI/ML models will provide. One brief comment and one observation from my data.

  1. If you sort the returns you can create a pure ranking system with machine learning. Useful? Supplement is with expected returns useful? Perhaps we can share information in the forum and find an answer in the future.

  2. So my present model is based on cross-validation. For my metrics I use Sparmnan’s Rank Correlation and Pearson’s rank correlation (or Skleanr’s R^2 metric). Also of course, you can get Python to calculate annual returns (just geometric averaging) of the top-X-number of stocks (like a screen).

So it seems Spearman’s rank correlation may give insight into the quality of a ranking method (or be a useful metric for that). While Pearson’s rank correlation may give insight to how a strategy manages to pick better performing stocks (higher expected returns) even if not being as good at getting the rank right all of the time. You would be expect the 2 correlation methods to give different results at times because of outliers and skew. Or you can miss the ranking a little if you end up finding even a few 10-baggers.

My only point is I am not sure which metric correlates with returns most.

But early testing suggests to me…. Well, that it will be interesting. That maybe I don’t know everything. Probably what I have seen can be call anecdotal or based on a particular set of factors that may not generalize for everyone. But I think the 2 may be different. An ensemble of the 2 method?. Probably I won’t use an ensemble in the end but I don’t rule it out at this point.

Using trading costs and expected returns is probably a separate issue—even if used as a final red-flag or veto for a trade (or as part of a calculation for determining the volume I will trade as suggested by the title of this thread). I will take close look at that, regardless of what model I use (similar to what you are lareacting doing with transaction costs, I perhaps).

TL;DR: I share your interest. Thanks.

Jim

I would really like to see an simpler way to vary the number of holdings and position size based on liquidity.

Chaim,

Here is the easiest method you will ever find, I believe. Maybe not the best but the easiest. And pretty good.

I use this book as my source: he Science of Algorithmic Trading and Portfolio Management: Applications Using Advanced Statistics, Optimization, and Machine Learning Techniques 1st Edition,

There is an equation in the good that includes this factor POV ^0.5. Where POV is percent of daily volume.

Therefore from the equation: if you increase the POV for a trade by a factor of four you double the amount of a transaction by 2 and get them same slippage.

So if you had a ticker with median_daily total = 50,000 the slippage would be the same as a ticker with median_daily_total = 200,000. All other things being equal.

Suppose, you made a book of a port with a rule of MedianDailyTot(126) = 50,000 and another port with Median dailyTot(126) = 200,000.

The book would have you buying twice as much of tickers that are twice as liquid with the same slippage.

Full stop (end of proof). Easy I believe. Easy as using Books and calculating a square-root with a hand calculator anyways. One could use their own slippage formulas (different book or data from their trades) and iterate this again for greater liquidity.

Jim

Thanks Jim.

My first issue is that the site does not not have the option to vary the number of holdings based on a formula.

My thinking is the 2 ports with the same ranking system will buy a smaller amount of a lower liquidity stock and to some extent buy different stocks (in the higher liquidity port) and therefore more holdings (and different amounts) specifically designed to help with liquidity. Done automatically.

But not the best method, I agree. Just the easiest.

Thank you for your feedback.