Factor Interaction with Size

Dear P123 Community,

I am getting back into the swing of things after returning from an overseas deployment. In the meantime, a game-changer happened on P123, namely the “Formula Weight” functionality. I would like to solicit your feedback on how various types of “factors” interact with size (a-la market cap).

I have long used this site to study how factors affect returns in an equal weighted portfolio. Now, I am starting to look at factors in a size-weighted world, with very disappointing results (as would be expected). It would be nice to look at 3D histogram of returns, vs factor, vs size to get an idea of the types of interactions that exist. However, this would be a very large undertaking. So I was hoping I could leverage your experiences regarding the interactions between size and factor-based return premia.

What factors tend to work most robustly regardless of size? What factors work best within a nano/micro/small/mid/large/mega cap universe? Are there factors for which a canonical relationship exists only within the context of size?

And to generalize, how do any of these interactions articulate with the efficient markets principle? What can factor discontinuities versus size tell us about spurious relationships and over-fitting risk?

For your time, simple mean reversion system used within three buckets of stock universe: nanocaps (<$50 mm); microcaps (>=$50 mm; <=$250 mm); and, ex nano/micro (>$250 mm). P.S. - While short term mean reversion seems to persist across the size spectrum, one will find that momentum factors “flip” in direct within small versus large caps (i.e., long-term momentum is inversely related to long-term stock returns for small companies).


Hi Primus,

That’s an interesting way to calc mean reversion. I don’t normally look at companies as small/illiquid as the nanocap universe you look at (and I usually put liquidity constraints on my universes of 150k or 200k when doing studies). Slippage and difficulty trading is my primary concern. Working with a little bit larger small cap universe w/ 3-6 mo holding periods here’s some thoughts though:

I’ve added some mean reversion terms to some of my longer term models that often incorporate a lot of traditional factors, and can sometimes see an advantage/sometimes not, but there seems to be a volatility tradeoff of adding mean reversion. Over the past week or so I was looking at adding some technical rules to an existing system I’ve been using on a universe w/ dynamic market cap of 1B scaled for the value of the market going back in time (so the cap limit is lower in 2009 than it is in 2016) trying to take advantage of the technical wobbles, and in almost all cases I created higher volatility. Sometimes the sharpe might be a tad higher, but sometimes not. I was looking at 3 and 6 month holding periods and shorter holding periods will usually perform better, but I have real concerns about slippage and the slippage assumptions make much of the difference. I’m not a good trader, esp in cases of the smaller companies w/ bigger spreads, so I try to limit my chances to make mistakes there. I’m not saying anything new with this, but mean reversion probably becomes more valuable if you can trade frequently with low slippage.

I have not found quality to be of much benefit in my small cap models. I was really introduced to quant investing by Greenblatt type thinking which had quality as central fixture, but the more I look at quality factors - the less I find myself using them. Other factors seem more productive. There’s an academic word for it, I can’t recall - something like engulfs or supplants - that’s not the word - but I think maybe quality gets engulfed by other factors we can utilize in p123. (edit: maybe the word is subsumed?) If I had to make a call I’d say it’s useful for avoidance (avoid terrible quality), but not so sure it’s helpful for positive selection - at least in the way we use quality for sorting on p123.

I have not found momentum to be of much benefit in small cap models, but that could be a temporary phenomenon given history of the factor. I do not use it presently (again I’m using 3-6 month holding period targets).

Beyond that, I’ve found the kitchen sink approach has value with the smaller companies.

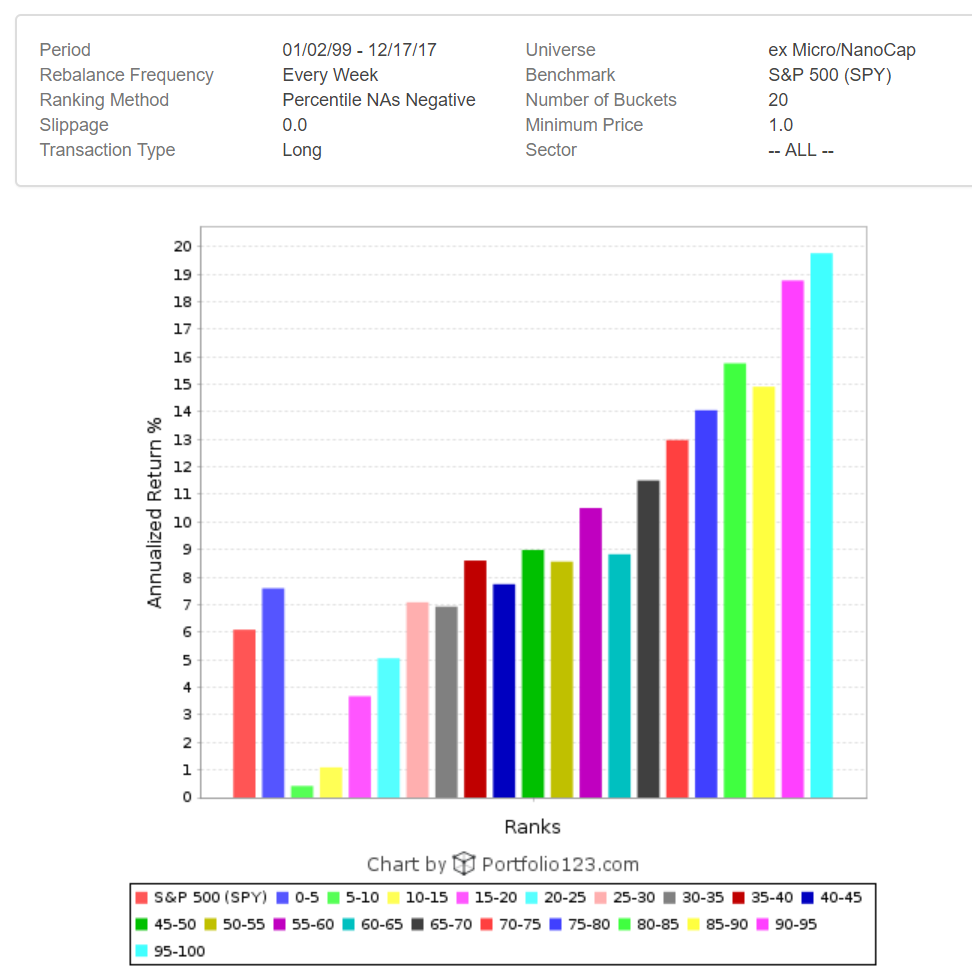
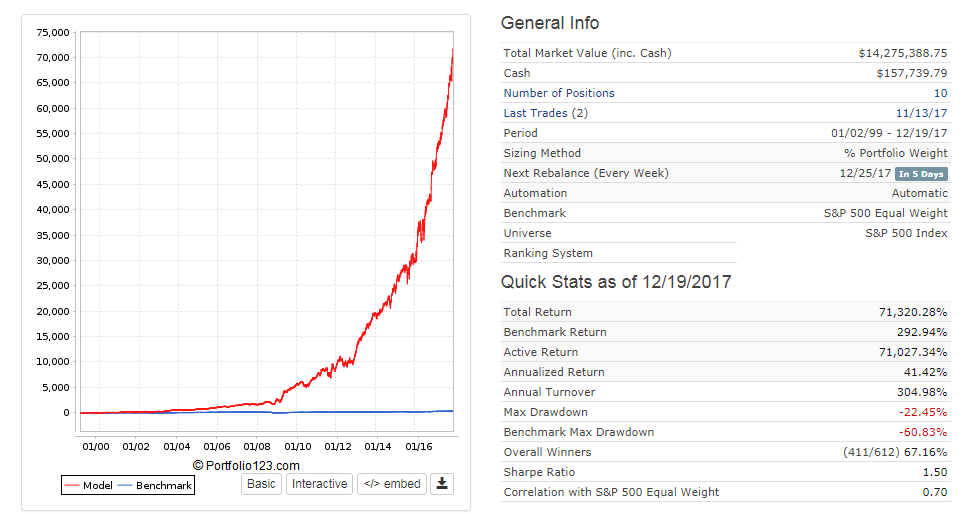
Things that work in the small companies might have little value when applied to the larger companies, or at least may not appear as easily when looking at larger companies. If I run my small cap model on the SP500 it does outperform RSP (it surprised me when it did), but the individual factors would not be apparent if starting from scratch on the SP500 and trying to figure out what works. In combination the factors do outperform and I found this result comforting. Again, this surprised me when I checked, because when researching I did not see much benefit of some of the individual factors selected when applied to larger companies - but easily saw larger performance spreads when applied to small cap universe. Performance improves going from SP500, R1000, R2000, and on down into increasingly smaller cap limitations. With the larger caps I remind myself that a small guy like me can trade more frequently with very low slippage, so I can increase frequency on the model and improved performance with big companies, so might be an opportunity there doing a retrofit.

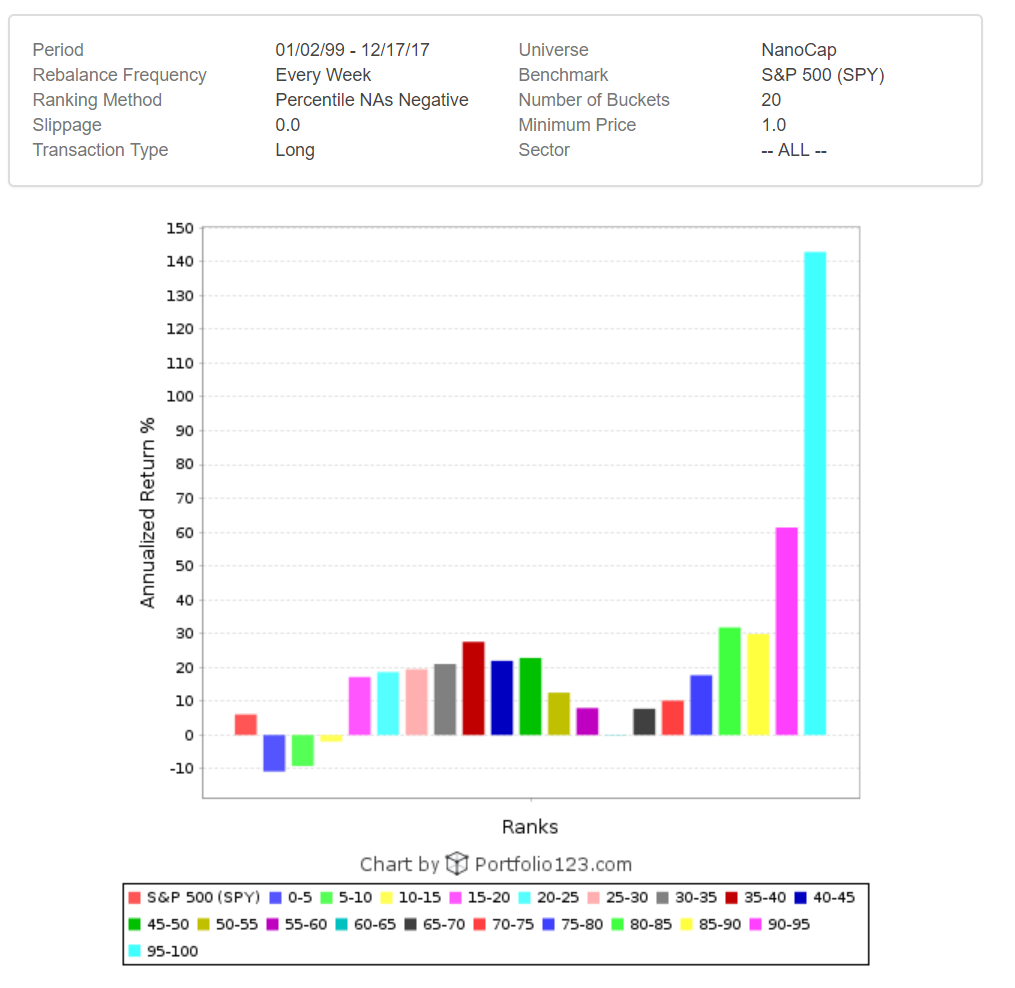
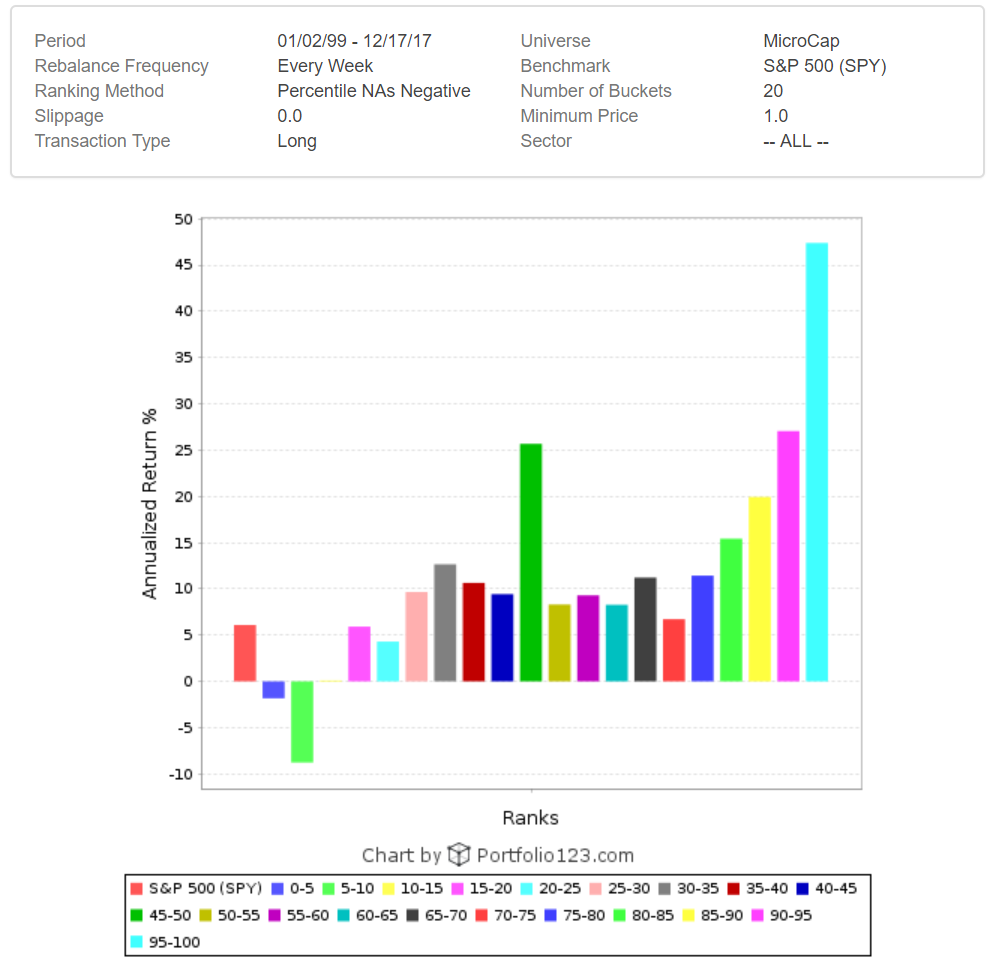
I guess one thing to watch for in small caps are the “hump” shaped performance distributions that I think lead me to conclude that we should try to favor factors emphasizing operational stability vs. extremes of the distributions which seem mispriced. Even though there’s the idea that small caps are the land of fast growing dynamic companies, I think maybe relative stability is to be preferred in the small cap universe. Big operational changes are not a good thing, and it shouldn’t be looked at as a land of moonshots. They’re just smaller companies. Any efforts I’ve made to build models made on a high grower universe has just been sad in comparison.

Also, there are a ton of just really trashy companies in the small cap world also. It’s probably safe to restrict your universe quite a bit at the outset if you like. I’ve done a bit of work on what to avoid, and I think probably 25-40% of small caps are likely excludable. The ranking method will generally sort them to the bottom anyway, but it’s pretty easy to build absolutely terrible portfolios in the small cap space (performance spread from best to worst expands as cap sizes decrease)

I was listening to a podcast w/ Eric Cinnamond today and he says in small caps he also looks for companies able to manage their debt payments out of operational cash flow in a 3-5 time horizon because small caps don’t have same access to credit as bigger companies. This might be a core difference. I wouldn’t be surprised to find high debt to be less of an issue in big companies. I was not able to work this type of balance sheet factor into my model when I was first building it. Debt levels were difficult for me to find meaningful factor(s) that was additive. So, I have not been able to find factors to represent this viewpoint, but he’s an expert and there’s probably something there. I’m just wasn’t smart enough to incorporate it initially, but will take another look.

While none of this is canonical, I hope some of it is helpful. You’ve probably worked on this stuff far more than I have, but I don’t think I’m exaggerating when I say the kitchen sink approach seems to apply to the small cap world as I’ve looked at it, and individual factors that may not seem to have utility when looking only at large caps seem to become more useful moving down the cap scale.

Here are the big factor differences for me between small cap and large cap rankings:

  1. For large caps I rely more on EPS estimates, for small- and microcaps more on EPSExclXOR.

  2. I weight the accrual ratio–(NetIncBXorTTM-OperCashFlTTM)/AstTotTTM, with lower numbers better–much more heavily in my large-cap models than in my small- and microcap models.

  3. I use the price-to-sales ratio and the EV-to-sales ratio much more in my large cap models than in my small- and microcap models.

The balance of factors is very different for me.

Small cap: 28% growth, 20% quality, 11% sentiment, 15% size, 2% technical, 22% value.

Large cap: 22% growth, 25% quality, 7% sentiment, 13% size, 1% technical, 29% value.

All of this should be taken with a large grain of salt as I have spent about ten or twenty times as much time researching small and microcaps as I have researching large caps.

  • Yuval

Spaceman,

Thanks for a thoughtful response. Quality is indeed hard to nail down. I think your word choice was fine, but another word which has in the past eluded me was “conflate”.

As far the balance sheet, I agree it has been difficult to find something there which is a really solid indicator of future performance. I had a hotshot CFA once preach to me that the “balance sheet is everything, trust me”… I am still trying to figure out if he was just echoing pedagogical words of his former master or speaking from experience.

A note on that: While somewhat unrelated to size, my typical approach for valuation intends to discount all other “fundamental factor” premia (e.g., quality, value, financial risk, growth, size, etc…). The process goes like this: remove net plant and intangibles from the balance sheet and replace with a cash flow based asset value of the core assets. The idea being: Fair Value of Net Plant + Intangibles = Present value of future cash flows from the those assets. I then usually naively estimate the present value of other assets and liabilities (i.e., defer to the book values of working capital + debt + investments not previously captured). There are only so many places value can hide…

Where does technical analysis fit? It doesn’t…

I wasn’t familar with Eric Cinnamind. Will have to check out. Thanks!

Yuval,

Thank you for sharing. It seems like your experience suggests that growth, sentiment, and technical factors are more important for small caps. Do you have any theories why they seem to work better? Could it be that lower capacity makes them more susceptible to speculative pressures?

Thank you.

//dpa

The way to make the most money in microcaps is to set short-term horizons (two to six months). Growth, sentiment, and technical factors are in constant flux. The way to make money in large caps is to hold for very long periods, so that’s why quality and value factors predominate there.

primus, I’d add there might be local maxima that are path dependent on the approach to the system design. With my current small cap model I purposefully tried to use less of the well-known factor approaches. Value measurements started as an important baseline factors as I can’t help but think it will always matter, but I intentionally tried to lead with other factors that seemed predictive but were not things that I’d read much about, if at all. My hypothesis is that the performance might be more likely to persist going forward in lesser utilized factors.

This process will possibly lead to a different looking outcome and local maxima than starting with the well known factors and trying to expand from there. It could end up in the same place (depending on the shape of the space), but maybe not.

Also, one thing I’ve noticed many small cap investors talk about is the importance of insider ownership and paying attention to insider activity and insider incentives. I tested variations insider trading activity and had difficulty finding useful signal. The insider ownership field is presently broken though, so it might be something to add when data is again available.

Thanks again, Yuval and Spaceman.

Yuval,

Your explanation makes a lot of sense.

Spaceman,

That makes sense, but I do not understand the context of local maxima being “path dependent”. I joined the Marine Corps so I obviously eat crayons.

Also, there is a whole more information provided on SEC Forms 3/4 which may help you understand the differences between an “knee jerk” versus “conviction” insider buy. Open market purchases which deviate from historical activity are strong conviction signals. This information is not available through the P123 interface, but you can easily research this on SEC EDGAR.

Hmmmm. Over-generalization?

Ideally, given a certain edge, that edge becomes more valuable the more often you can turn it over, given cost/slippage constraints. No matter what the universe.

Moreover, backtesting is harder to overly curve fit the more turnover you have.

re: “That makes sense, but I do not understand the context of local maxima being “path dependent”. I joined the Marine Corps so I obviously eat crayons.”

I think you’re pulling my leg :wink: but in case not, by path dependency I mean that if the return space consists of several high spots (perhaps explained by different factors), that if I start modeling and climbing one of those hills (local maxima) by choosing a certain set of factors, then maybe I’m going to arrive at one high spot that precludes me ever finding the other high spots. The idea, I guess, is that maybe certain factors work well together, but maybe in another context might not be helpful. One hill way “over there” might be built on different set of factors, and maybe I would’ve climbed that hill if I started with different set of factors. I guess folks with supercomputers are able to iterate over almost all combinations of factors to make sure they find the combinations that climb all the hills, but my approach is more limited because I pick a certain path (set of initial factors w/ universe restrictions) and build on top of it until I arrive near a top.

By saying this, I was trying to communicate what I see as a limitation in my remarks and approach because I do think the variables we start with might lead in different directions. I’ve certainly found some factors that work well only in limited ways - and applying the usual factors on top of them only hurts.

I got it, Spaceman.

Wasn’t pulling your leg. Just google “Marines Corps crayons”.

Interesting the way you look at optimization. I usually emphasize what, in my head, “should” work best and is therefore most consistent about my beliefs on universal principles.

This seems a little different from trying to find what actually works best.

This probably stems from my willingness to use an approach that is sub-optimally right rather than exactly right.

For example, if I do see a “local maximum” in the return space (histogram???), then I knee-jerkingly attribute to noise rather than “a hill to be climbed”. If I may paraphrase you, you might see that local maximum as some kind of factor interaction. I think that these hills could be due to factor interaction, but many are probably noise.

Admittedly, I am probably leaving some money on the table by disregarding the humps.

//dpa

I agree with what you’re saying regarding building what should work. Where I run into issues is sometimes what should work isn’t intuitive to me, and I’m concerned I can find ways to rationalize whatever the data tells me. If I can’t understand why something might work I won’t use it, but I have to admit that sometimes I’ll see something unexpected or interesting and it’s easy to back into an explanation. I’ve heard other investors talk about the same when they run into unexpected findings.

For example: It’s not intuitive to me that I would expect higher sales growth to underperform lower sales growth. But it does, and I can back into explanations that are entirely satisfactory.

Or it’s not intuitive to me that lower volatility should outperform higher volatility, but it does. Again, I can back into explanations, but they tend to fly in the face of an expectation of risk/reward tradeoffs.

And why these type of effects, once known, might persist (or fade away) is another part of the puzzle.

It leaves me to be more open to ideas I guess. Several really good investors make the point that to achieve excess return I have to be willing to both a) take different and non-consensus positions and b) have to be right. If I take a bit of that thinking to heart, I’m willing to take some bets on some factors that seem like they have something to them even if it’s not central to how I think markets should work. And if nobody else is using that factor that might be working, all the better :wink:

I’ll have to check out google on the crayons - thanks for the discussion.

True story.

I’m following this thread with interest as I have practiced factor modeling for more than 20 years.

Much of what is said on P123 regarding factors seems to be lumped into large categories, such as size, quality, value, growth, etc.

I can tell you that factor modeling is much more effective if you focus on the underlying components of the more macro categories.

The basis of my work is this:

  1. Everybody screens. Large or small every fund and individual screens on some level.
  2. Performance is King in the institutional investment world. Whether you are a large fund, or a small money manager allocating among a group of sub-advisors. Under performance impacts the funds profitability, and your paycheck.
  3. Style drift. Read any fund prospectus and you will find the fine print that the fund can invest some percentage of the portfolio outside of their declared mandate. So these big funds chase performance just like the little guy. This is key.
  4. The clues you can find in volatility are priceless.

I presently focus on 35 different factors. On some level they all fall into one or more of the Macro categories, but are more defined. At one time the count was 45 factors but this platform can’t handle the math. Each reconstitution reveals 8 to 12 that are relevant. They rotate slowly.

The beauty in this is watching the institutional money ebb and flow among these factors. The trick is to avoid the ebb and get in front of the flow.

There are a couple of other steps involving risk analysis and some MPT, but factor modeling is the engine.

I guess my point is this, I learned to let the data talk to me. Trust me, it works…

I did a study that compared ideal holding times for the S&P 500 and microcaps. I wrote it about it here: How Long Should You Hold A Microcap? | Seeking Alpha. Also see the comments. This doesn’t prove anything, but it offers a little bit of evidence for my assertion.

Nice article.

Gerstein’s Cherrypicking the Blue Chips turns over every 7-8 weeks. It’s an S&P model. Do you have a large cap model that holds for very long periods that beats it?

I’ll leave the statistical discussions to others, but fundamentally speaking, size, in and of itself, is a bona fide factor within the quality-stability category.

Consider what large vs small tells us:

1 .Operating leverage enhances profit stability because all else being equal, fixed costs are likely a lower percent of total costs. That means that percent changes in profits will be smaller, for a give percent change in revenue, than they would be for a smaller company (economies of scale). That tendency toward relative profit stability can logically be expected to suggest a tendency toward relative share price stability.

  1. Larger companies are more likely to benefit from a more diverse portfolio of businesses and customers, which reduces volatility the same way we’d likely see in a portfolio with 50 stocks vs a portfolio with 5 stocks. So we can expect more relative stability in revenues. (This is so even for supposedly single-industry companies, which can be very diverse in terms of how many parts of the industry they serve, territorial diversification, etc.)

  2. Large companies tend to be better studied in the investment community, due to more eyeballs watching and, often, more information for those eyeballs to study. All else being equal, this makes the stock easier to rationally value (relative to similar businesses that differ only in size). This, in turn, suggests a lesser role for noise as a component of the share price, agains giving a nod toward greater relative share stability.

So in terms of combining size with other factors, you might want to consider it as if you were combining quality with other factors. So, for example, combining size with ROE might not be as productive as, say, combining size with something like growth or momentum or value.

I have two that come close, but they’re not open yet. You can see them here:

https://www.portfolio123.com/app/r2g/summary?id=1503279
https://www.portfolio123.com/app/r2g/summary?id=1503986

In backtests, they get 17.6% and 23.8% CAGRs respectively, and their turnover is 0.5X for the first model and 2.2X for the second.

The following models have at the average 3 months holdings period; with success rate 67% and win loss ratio 2:1
Still, learning to improve the probability.

Re-visit, Re-tune and Re-fine to improve understanding of the model and stock market; is resulted following 2 models.
It is a complete dedicated hard work. I am curious to learn some more lessons from these models;

My luck is gained valid knowledge from Mgerstein’s works and few more AAII fundamental experts works.

Out of sample expectation:
Even half of the model’s return (20%) and double the model’s draw down (-45%) looks better performance than bench mark.

https://www.portfolio123.com/app/r2g/summary?id=1500539

https://www.portfolio123.com/app/r2g/summary?id=1495143

Thanks
Kumar


Hard earned lessons:

Few buy rules make huge difference in out of performance;
compare Rev2 vs Rev3 out of performance for last 3 months.

Thanks
Kumar :slight_smile:


Personally, that would make me quite worried about curve fitting to the new out of sample data again, no?