It looks like the “Current” setting is not rebalancing for today. If I set to Legacy then it does.
I have stumbled upon a small issue with the Factset data for few Canadian stocks: the price targets are very low compared to both the actual stock price and the Compustat price targets. Take Real Matters for example, Factset has 7 analysts with a mean price target of 16.50, Compustat has 7 analysts with a mean price target of 23.04. Other examples are Kinaxis, with a Factset/Compustat price target of 123/172, Constellation Software with 1117/1579 and Alacer Gold with 6.02/8.5. Trying running a screen with “Price>1.2*PriceTargetHi” in Canada to find more like these.
Notice something about the ratios? They are all approximately 0.7, which also happens to be the current exchange rate between US dollars and Canadian dollars. Could it be that the price targets are shown in US $ for Factset?
Just to be clear: this is just an issue with a small subset of Canadian stocks, most Canadian stocks look ok.
I’m very disappointed the backtests are significantly different between both providers. You will find below the 4 strategies I use and the comparison between both data providers. Each of these strategies are 25 mid-large cap stocks picked from universes of 300-500 stocks so it is diversified / liquid enough. There is no market timing involved and the rules are few and simple. In other words it’s mainly just the ranking itself.
I blamed someone for using 5 stocks on another thread for him getting completely different results but I get the same outcome with 25 stocks lol… It’s funny for a bit then the reality sinks in: the switch is definitely happening in one month and it feels like I have to revamp all of the strategies I worked on over the last couple years.
I believe you guys are highly skilled so I will trust most of the mapping is correct or to the nearest mmenonic / line item… Which makes me question the quality of Factset data. Anyhow I’m now facing the dilemma of finding a “fix” for these strategies next month OR paying an expensive S&P Global one-year subscription :(.
On another topic, I know you guys worked hard on the P123 Data Miner and it looked promising but if I have to fork 10K to S&P for a data access then this is a hole in my budget and eliminates any other spending I coulda done to P123 either for international Factset data or this P123 Data Miner thing which is unfortunate.
Note: I used Factset Use Prelim in this comparison.


Is the possibility of a supplemental subscription to CompuStat certain or just a possibility?
Has anyone made this arrangement as of July 1st going forward?
Thank you.
Hugh
Hi Yuval / P123,
I have an issue similar to Quantonomics and I use 4 US large caps stock systems.
There is something odd when using Factset and it is more than random fluctuations.
- Shifting to Current Compustat with or w/o Prelim → same results as legacy with AR difference less than +/- 0.5%
- However, shifting to Factset (with or w/o prelim) produces a AR that is typically -2% to -3% less. This is quite large.
As a base approach, these systems use…
- A universe constructed from ETFs with inlist() that change over time (i.e. multiples lines in the universe to cover the whole backtest period e.g. eval(dayssince(20060430)<>NA and DaysSince(20061031)=NA, inlist(“ABC_20060430”), true)).
- Then I apply the Greenblatt ranking provided by P123 and keep the top 10.
Nothing else. And yet already this has significantly different results when I test accross multiple lists.
Yuval → I am PMing you more details. Thank you.
Jerome
I’m afraid this isn’t very helpful. We need to know what is causing these differences. There are five possibilities.
- The difference is caused by the different practices of the data providers. For example, OpInc and OpIncBDepr are arrived at by slightly different methods. For FactSet, financial companies don’t have cost of goods or gross margins or gross profit. The two companies use some different analysts. They have different attitudes towards amortization. And so on.
- The difference is caused by bugs in our system. Check out Trello. There are probably other bugs we have not yet found. Some of these bugs will have profound consequences for a backtest. If, for example, you’re using estimates in a backtest, there’s a bug that will adversely affect any stock that had subsequent splits. We are working on fixing these bugs, but there’s a lot to do.
- The difference is caused by mis-specification on our part (which will shortly be fixed). For example, we need to show different line items for CostG and GrossProfit. That change has not yet been implemented.
- FactSet includes a lot more stocks than Compustat. So results are going to be very different.
- The difference is caused by overfitting or data mining on your part. Have you stress-tested your simulation (see https://blog.portfolio123.com/2020/03/09/break-your-strategy-how-to-stress-test-your-quantitative-models/ )? If you test it on the EvenId = 0 and EvenId = 1 universes, are the results the same? If you test it on the All Canada universe, are the results similar or completely different?
In short, when switching data providers, you should expect to see different results from your backtests. The fact that all the FactSet results are WORSE isn’t just a coincidence, though. It’s due primarily to two things: bugs and the possibility that you’ve adjusted your simulations to perform very well on a certain group of data.
I replied to Jerome’s PM as follows:
The key item here is OpIncAfterDeprTTM (same as OpIncTTM). Compustat and FactSet calculate this slightly differently, and there’s nothing we can do about that. I think that Compustat excludes some of the amortization and FactSet doesn’t (the difference is even more extreme with OpIncBDepr). Anyway, here’s what’s going on. The median difference between the Compustat and the FactSet numbers is about 3% for the S&P 500, and out of those 500 stocks only 49 have exactly the same number between the two data providers. So the ranking system is going to choose different stocks quite often if you’re just looking at the top 10 stocks. It just so happens that the FactSet performance is worse for this particular ranking system, but it could happen the other way around. I don’t think one set of data is necessarily superior to the other.
You’re going to find lots of major differences in the data. Estimates are going to be different, a few fundamentals will be different, and industry classifications will be very different. There’s really nothing we can do about that.
I have found another problem with stop-loss. If I run one of my sims that has a 15% trailing stop-loss, with Legacy/Compustat/Use prelim, then I get this :-
05/27/20 SELL AYX -29 $141.69 Stop-loss
05/26/20 BUY AYX 29 $151.24
If I change to Current/Factset/Use then I get this :-
05/27/20 SELL WORK-139 $31.61 Stop-loss
05/26/20 BUY WORK 139 $32.04
Neither of these stop losses are anywhere near 15%. I would also question why they are showing todays date prior to the market open?
Thanks for the answer, I will decompose each component of the ranking systems one by one and compare the output of those between S&P and Factset to see where the issue is. If I find anything worth looking I will post it here.
I’m getting this error message when running a screen with FactSet:
ERROR: Cannot write message to RANK102:23002
Hi Yuval/Marco/P123
Thanks for all your work so far. It sounds like a big task. I presume you have now loaded estimates.
I hope this hasn’t been mentioned before. I’ve been looking at Estimates and Actuals, and surprised how some vary. For example:
GDDY : Compustat
NextFYEPSMean =4.58
CurFYEPSMean=3.81
EPSActual(0,ANN)=2.64
FactSet
NextFYEPSMean =1.43
CurFYEPSMean=1.04
EPSActual(0,ANN)=0.76
I don’t believe GoDaddy has had any splits. Is it a quarter rather than a year?
I have also been looking at LTGrowth estimates. These are wildly different from Compustat. As an extreme example Brighthouse financial is a low growth Annuity business, so Compustat has its LT growth varying between 2% and 6% over the last 12 weeks. FactSet has it being between 24% and 26%! I don’t believe the LTGrowth numbers and am suspicious of the time series(from FHist).
Thanks,
David
FactSet is averaging estimates from fourteen analysts. Compustat is averaging estimates from four analysts. Considering Go Daddy’s recent earnings, Compustat’s estimates seem way off to me.
If you run this screen you can see both Compustat’s and FactSet’s numbers very quickly. You have to run it using the “current” engine set to Compustat. https://www.portfolio123.com/app/screen/summary/242581?mt=1
BHF is a weird one. Both Compustat and FactSet record two analysts who give long-term growth estimates. One of them estimates the long-term growth at 8%. The other one estimates it at 4% for Compustat and 41.29% for FactSet. I suspect the latter is a data error. I expanded the earlier screen to show you how I figured that out. See https://www.portfolio123.com/app/screen/summary/242582?st=0&mt=1
There are a lot of other things you can explore using the ConsEst functions. See Marco’s thread on the subject here: https://www.portfolio123.com/mvnforum/viewthread_thread,12291_offset,0
Hi Yuval & others
Building on my earlier post higher in this topic → https://www.portfolio123.com/mvnforum/viewthread_thread,12249_offset,180#!#73943…
I decided to go one step higher in the P&L and look at the difference between Compustat and Factset for sales.
→ I settled on SalesPQ for the reason that normally everyone should have the same data by now with no question over processing delay etc. In general, this is a quarter that ended Dec 31 2019.
→ I used the SP500 as a base - again here one would think that these numbers should be pretty well-known
→ Data as of 30-May-2020
Spreadsheet attached so you guys can double-check what I did.
Take-outs:
-
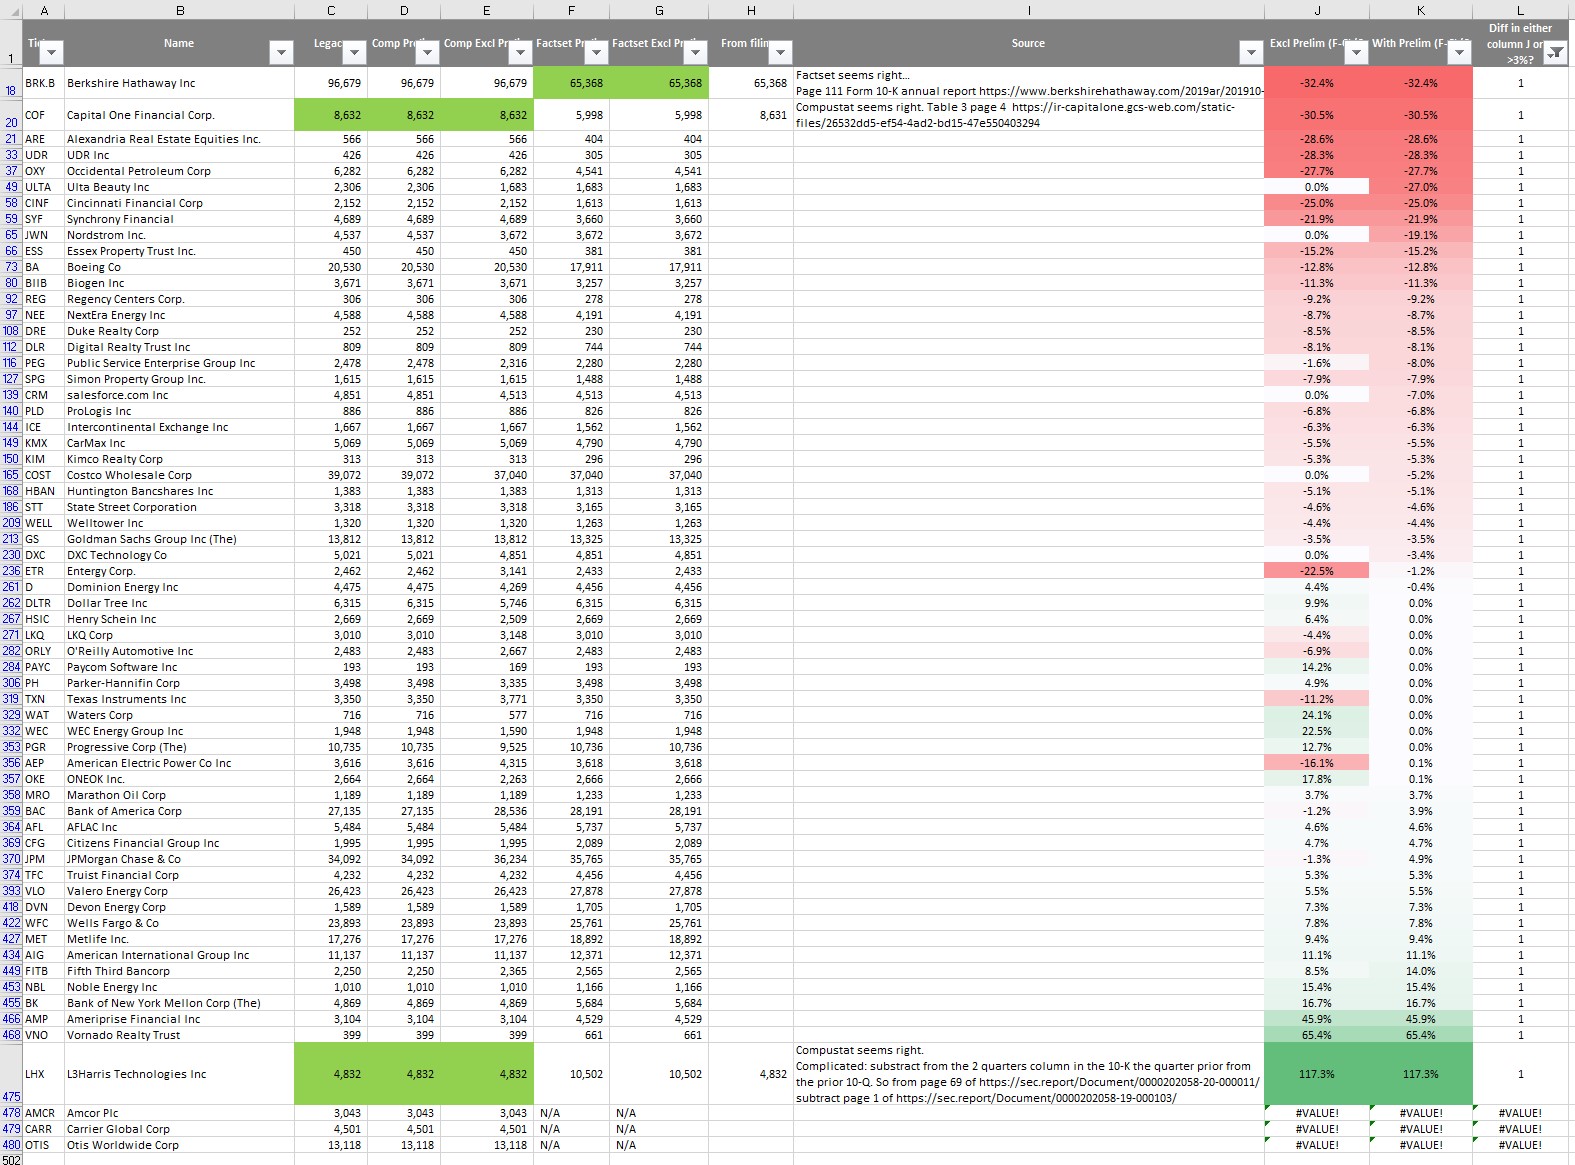
60 stocks (~12% of the SP500) show a difference in abs(SalesPQ) > 3% when comparing either Excl Prelim or with Prelim or both. Most of the time, when there is a difference with Prelim, there is a difference w/o prelim.
This is a lot worse than I was expecting for sales for a quarter that usually ended … 5 months ago -
3 stocks do not even have data on Factset (AMCR, CAPR, OTIS)
-
Some differences are enormous (upwards of 30%) including for well known names e.g. Berskshire, Capital One
-
I picked 3 stocks and went to look for the information in 10-K and 10-Q (Berskshire, Capital One and L3Harris Technologies). URLs in the spreadsheet:
- First I have a newfound respect for whoever is typing these things in the Factset or Compustat Databases. The filings do not necessarily make that easy e.g. by not disentangling the last quarter from the FY results
- Second, I think Compustat was right twice and Factset once. So I cannot conclude that one is better than the other and I ran out of steam to do more spot checks (however, when we add the 3 missing items from Factset, it looks worse for them).
Concerns and questions:
-
Anyone sees something I missed?
-
If I am right, I feel quite deflated. if the top line number can be so different and wrong(?) for one or the other provider, it really puts into question the robustness / validity of sims. What happens then to other numbers deeper in the P&L / Balance sheet?
For example I took a quick look at the difference in OpIncAfterDeprTTM between legacy and Factset with Prelim → see my next post.
Feedback welcomed.
Jerome
Sales Data Compustat vs Factset.xlsx (275 KB)
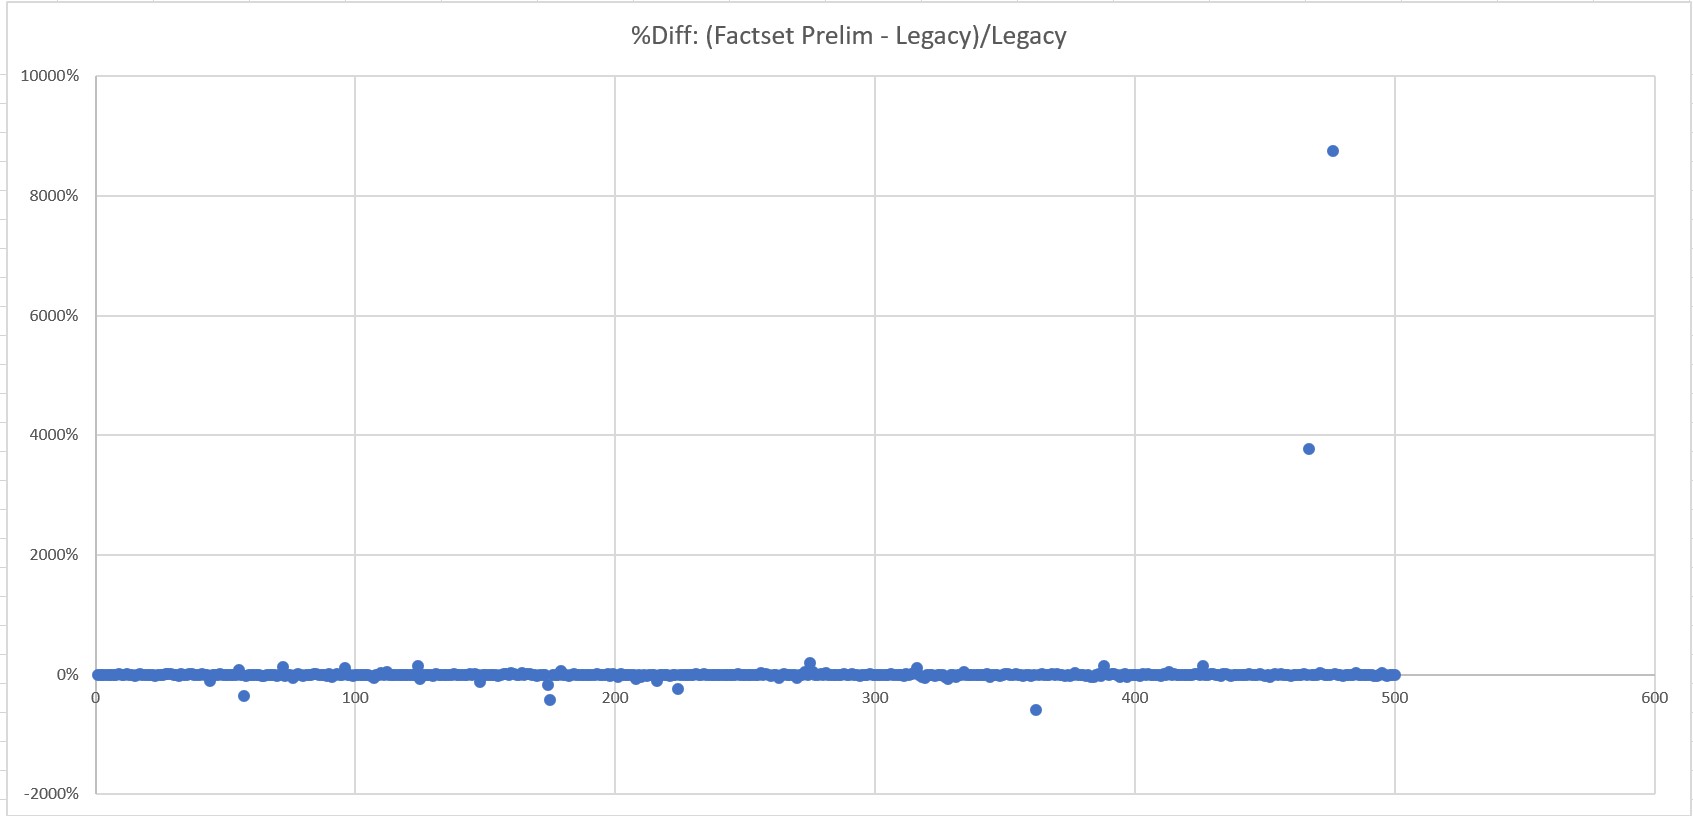
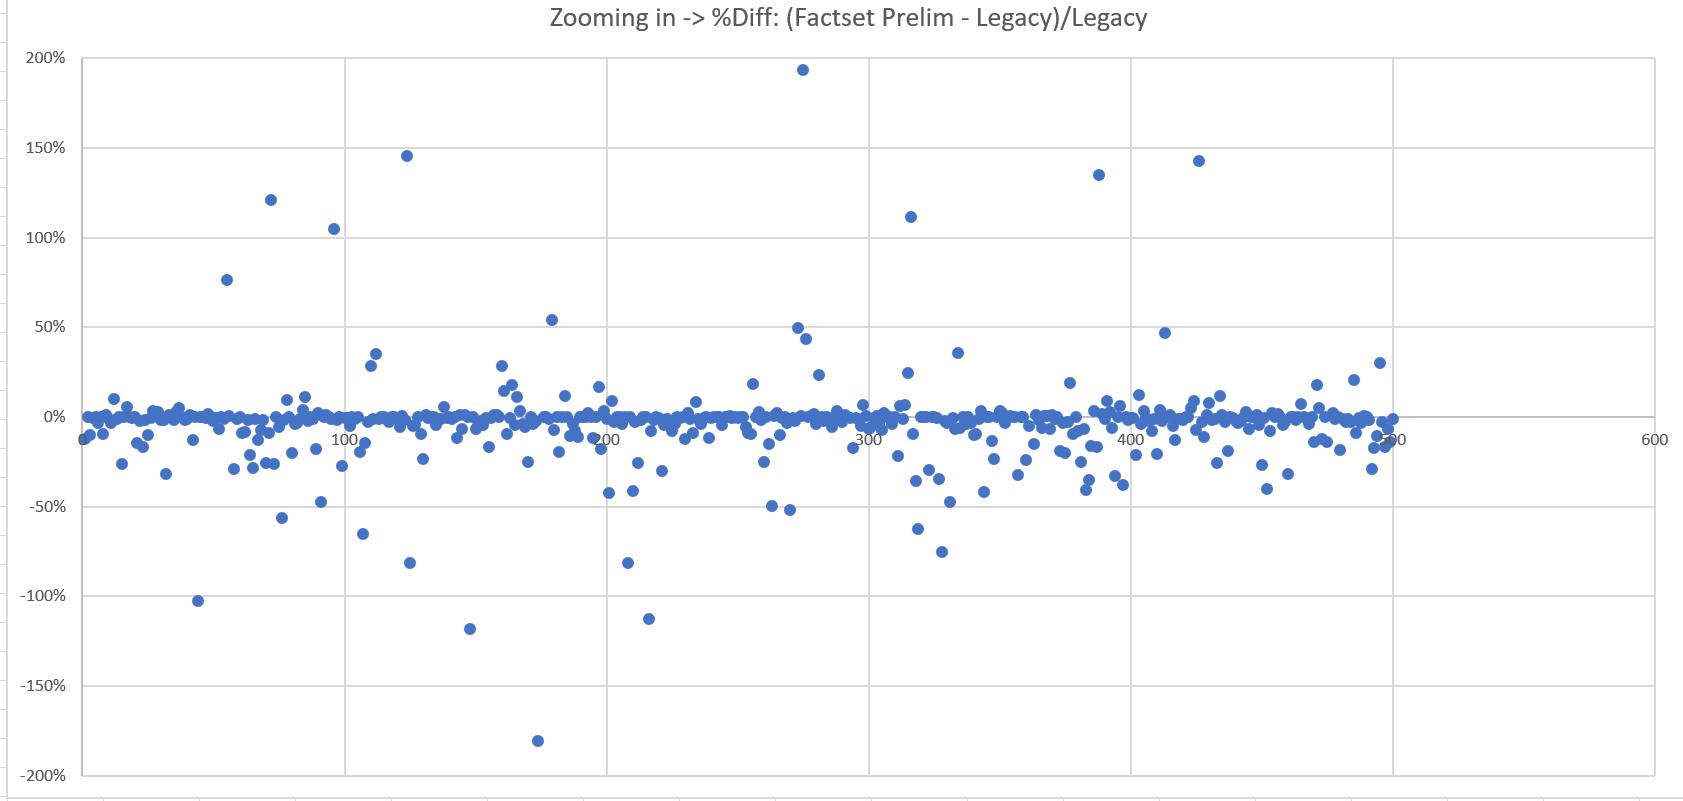
I am adding here the plot of the relative difference Factset vs Legacy for OpIncAfterDeprTTM (SP500, ran on 29 May 2020)
I have not looked at which provider is better than the other. The reality as Yuval pointed in a prior post is that both are just … different.
Still the “top top” line SalesPQ should be quasi identical!
This is not reassuring either as for the validity or the robustness of sims. It looks like the only way to be relatively confident is to use a large number of stocks (50?)
Jerome
Jerome, thanks for putting in all this effort and then sharing the results. I looked at a couple of the companies from your list, and also had a difficult time deciding who was “right”. For instance on Capital One it looks like FactSet subtracts Interest Expense (and Credit Lose Provisions) from Interest Income before reporting Revenue and Compustat does not. Who is right? I’m not sure there is a correct answer (although I lean to FactSet in this case). I would expect there is a whole myriad of issues like this, which will make comparing the two datasets difficult. For some of the companies I checked I was pretty sure neither one of them was “right”. I think what is more important is if the respective data vendors are handling the data consistently from time period to time period. What might be interesting is looking at the first derivative of some of these line-items to see how different things are between the two vendors over time. I’ll try to look at some of that today if I get a chance.
Thank you Daniel.
I would have expected the Sales to be the top line w/o any filter really (other than maybe truly exceptional cases).
In the case of Cap One, interest expense and Credit losses should be factored in further down the P&L. They are “kind of” some of the COGS for FS services.
Interest expense is one cost of doing business (their raw material is money borrowed at the cost of interest and the finished product is the loan sold to customers = revenues). Other companies might have a different cost of interest if they are able to borrow cheaper or find money to lend elsewhere (banks can lend money that customers have deposited on Current or Savings Accounts).
Credit losses are also part of the cost of doing business (some customers will default partially / totally on their debt) and one area they have to invest into in order to reduce it as part of their core differentiator (ideal = 0).
Jerome
Jerome -
I think you’re hitting the nail on the head here. There are differences in the way the two data providers calculate total revenues for banks, and even larger differences with operating income after depreciation. (Part of the issue is how they treat amortization.) Financial data is nowhere near as clean as it would appear from looking at a single data provider. You can also compare these numbers to those of Thomson Reuters for yet a third take . . . Down the road we intend to expose more data from banks–there are a few items that might be considered “essential” that we have never exposed. But that will have to wait until after the transition.
[quote]
Down the road we intend to expose more data from banks–there are a few items that might be considered “essential” that we have never exposed. But that will have to wait until after the transition.
[/quote]Excellent, I am looking forward to using these!
I am busy with an enterprise project, so I can not assign too much time to p123 right now, so I might have just missed the answer.
So far the difference between factsheet and compustat has been o.k. (about 5% difference on my flagship system, but enough for me to start
adapting my flagship system to the new data).
Now my questions:
-
When p123 switches to factsheet for good, what do I have to do with my portfolios, will the be transfered to the new factsheet data (e.g. will
they simply use the new data after the cutoff) or do we have to transfer my existing ports. -
And when will this aproximatly the case, bc before that date I would like to “adapt” my flagship model to the factsheet, but doing so on a
stable environment with less and less changes. -
For this it would be cool, if performance of simulating would be somewhat good like in the legacy system with the compstat data (will
this be optimized for performance?) -
Am I o.k. right now running my modells on the compustat data and trade on it? (I assume yes).
Thank you
Best Regards
Andreas
Based on Jerome’s great work above I decided to look at differences in the first derivative of Sales (i.e. how are Sales changing over time). I haven’t come to any conclusions yet, but wanted to point one discrepancy I found, which is how Compustat and Factset are handling the split up of DowDupont. The SalesTTM and SalesPTM for Ticker DD are
Legacy
SalesTTM = 21319
SalesPTM = 22411
FactSet
SalesTTM = 21319
SalesPTM = 84116
Obviously the calculation Sales%ChgTTM is going to be wildly different between the two cases. For a little more granularity I went ahead and pulled the Quarterly data from both engines and got the following results
Legacy
Sales(0,QTR) = 5221
Sales(1,QTR) = 5204
Sales(2,QTR) = 5426
Sales(3,QTR) = 5468
Sales(4,QTR) = 5414
Sales(5,QTR) = 5457
Sales(6,QTR) = 5683
Sales(7,QTR) = 5857
FactSet
Sales(0,QTR) = 5221
Sales(1,QTR) = 5204
Sales(2,QTR) = 5426
Sales(3,QTR) = 5468
Sales(4,QTR) = 19649
Sales(5,QTR) = 20099
Sales(6,QTR) = 20123
Sales(7,QTR) = 24245
It looks like Compustat made the adjustment for the de-merger retroactively, while Factset did not. Seems clear in this case that the Compustat approach is superior. I’m curious if this is a one off for Factset or if we can expect this difference for all mergers and split-ups.
As a side note, if you look at the Fundemental chart using the Legacy and the Factset engine they both display the FactSet data for SalesQ. Are the Fundamental Charts set to look at the FactSet data regardless of which engine is being used, or is there something else going on?
Thanks,
Daniel