FactSet beta site v1.0, NOW LIVE

First, we found some bugs that were making the beta site using Compustat somewhat different from the production site and we’ve fixed those. They are:

  • The beta site was adjusting non-currency line items for Canadian stocks by the exchange rate. No longer.

  • Industry factors like Pr52W%ChgInd were quite different between the beta server and the production server. This was because the beta server was using the All Stocks universe rather than the All Fundamentals universe. This has been fixed. There may still be a few minor differences, but those are due to an improvement in how those numbers are calculated on the beta server.

  • Div%ChgA was outputting N/A numbers as 0 on the beta site, which meant that a stock with no dividends was ranked higher than a stock whose dividends had decreased. We fixed this behavior. Now, on the beta site, a stock which has not paid any dividends gets N/A, a stock whose dividends have not changed gets 0, a stock that has stopped paying dividends gets -100, and a stock that has changed its dividend gets the percent change.

Now on to the FactSet database.

First, thanks to Daniel for bringing up the differences.

There’s yet another TTM bug here. The four quarters aren’t always adding up for FactSet TTM. I’m hoping that will be fixed tomorrow or the next day.

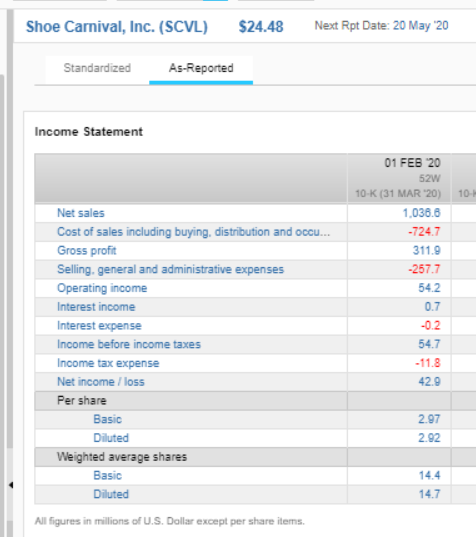
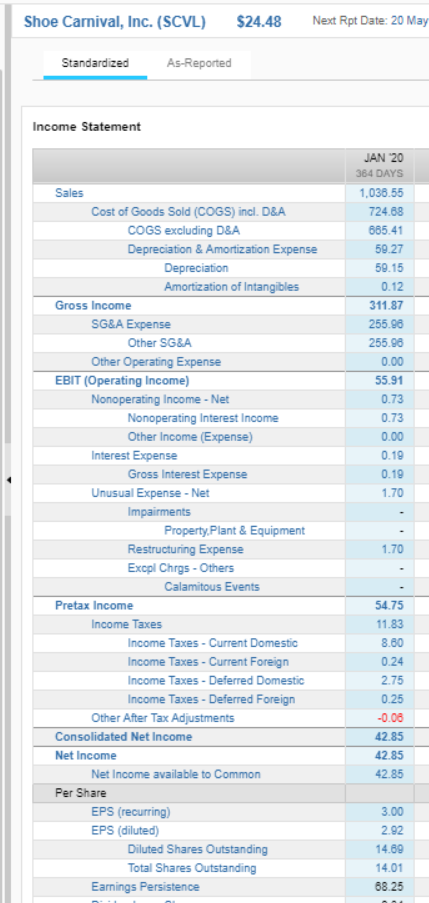
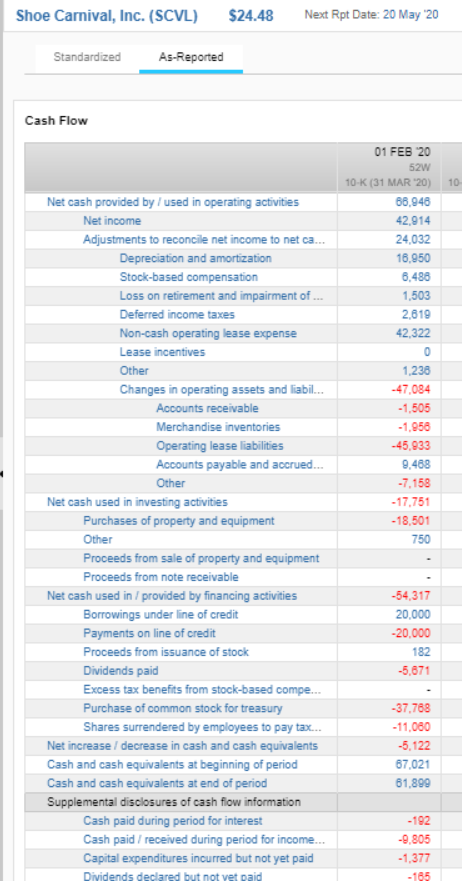
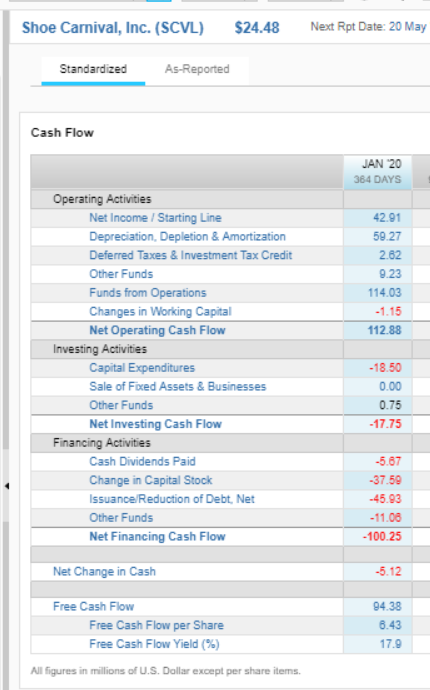
SCVL is a good example of how FactSet handles financial statements differently from Compustat.

Basically, every data provider digs into the numbers and alters them according to their research. They standardize most items depending on the nature of the business the company is in. So, for example, FactSet treats health-care providers like insurance companies, and even if a health-care provider lists its cost of goods in its filing, FactSet will not provide that in their standardized income statement because they don’t believe that cost of goods is a meaningful figure for insurance companies.

I’m attaching some screen shots to show you the difference between the as-reported statements and FactSet’s standardized statements. You’ll notice large differences between them. And these are not accidents.

We are still working on how best to handle the differences between the way FactSet and Compustat handle reported data. We will let you know when we’ve made some final decisions. Right now, as you can see, the differences are quite big for a lot of items.


Yuval,
Two questions:

  1. Can historical Compustat data be retained and used by P123 after the current Compustat contract expires?

  2. Is there a hard cut over date beyond which no Compustat data will be supplied, or can P123 extend the existing contract by a month or
    so while the data issues get sorted?

Thanks for putting this information out there Yuval. When I dig in, it looks like the source of the error is how Factset is handling the Operating Lease Liabilities. I’m not 100% sure, but when I play with the numbers the increase in the Operating Cash Flow and decrease in the Financing Cash Flow seems to be completely explained by moving the Operating Lease Liability (-$45,933) from the Operating Cash Flow section to the Financing Cash Flow section. Of course by doing this you are taking a cost item from the CFFO bucket thereby inflating the CFFO and making it a repayment of debt in the CFFF bucket. This explains why the company moved up my ranking system so significantly on the beta server, since i use both Operating Cash Flow and (-Financing Cash Flow or Shareholder Yield) in the system.

The question is, is this a one off mistake, or is it something we can adjust for in how Factset data is mapped to P123?

Thanks for the hard work,

Daniel

We are hoping that we will be able to continue to provide Compustat data to users with a Compustat license. If you don’t have a Compustat license, which will cost around $25,000 a year, Compustat data will be unavailable.

We are looking into extending the contract by a month or two.

Daniel,

Kudos to you for figuring out what FactSet did here. This is not a “one off mistake.” It’s entirely deliberate. If it were a mistake the numbers would not add up on the bottom line of the statement. You should probably think hard about whether Compustat or FactSet made the better decision. Does an operating lease liability really belong in operations or financing? Compustat and FactSet came to two different conclusions.

Fun with accounting 101… had to really focus on this one. All of this has to do with the recent FASB accouting rule change ASC 842, which requires operating leases to be recognized on the balance sheet. This became effective for SCVL in Feb. 2019. Basically Operating Leases now have to be recognized on the Balance Sheet as both an Asset and a Liability based on their present value. This prevents off-balance sheet accounting and the artificial inflation of ROE and ROI numbers (hurray!). The downside of this is that it creates some interesting accounting tangles, because in each period the company has to depreciate the value of the Asset according to some rule and reduce the Liability by the amount actually paid on the lease.

This is one of those things that I can argue both ways, but I actually think FactSet might be handling this correctly (at least in terms of ROI/ROE calculations). If you are going to capitalize the operating lease it makes sense to treat the payment on the lease as a Financing Cash Flow, and the Depreciation of Asset as a non-cash expense that gets added back to Net Income to calculate CFFO. This would give you a ROI calculation that is more comparable to the ROI calculation prior to capitalizing the lease. The way SCVL and Compustat handle the accounting here seems to mix systems, the operating lease expenses is being treated both as an Operating Expense and as an Asset/Liability at the same time.

Interested in hearing opposing opinions here.

Thanks,

Daniel

Thanks for the hard work guys in pulling all of this together.

Fwiw the following ratios are not working for insurers and commercial banks - possibly all financials. These have been working just fine with our prior dataset.

Enterprise Value/Free Cash Flow
Enterprise Value/Operating Income After Depreciation
Enterprise Value/Sales
Gross Profit Margin
Return on Investment

Consequently it’s really throwing off my models. Hope you can remedy this. Thx, Ed.


These ratios should not be used for financial companies. They don’t mean anything.

Basically, Compustat is intent on standardizing financial statements so that they apply to all industries. FactSet is intent on standardizing financial statements so that they apply to the particular industry that the company is in. So, for example, what does cost of goods sold mean for an insurance company? What does the “and equivalents” line in “cash and equivalents” mean for a bank? Why would you add total debt to market cap to arrive at EV for a financial company? These ratios really aren’t appropriate.

We will be coming up with some solutions next week so that these numbers are somewhat closer to Compustat’s. But it’s a bad idea to use them for companies in the financial and real estate sectors, and for health-care providers. Those companies simply don’t operate that way. FactSet gives N/A for most of these numbers, and our existing fallback mechanisms make a mishmash out of the result.

So wait until next week–Tuesday or Wednesday–before trying these numbers again. We’re all working on coming up with solutions so that the results will be somewhat closer to Compustat’s.

But in the meantime, steel yourself to make some changes to your models. Once we switch to FactSet we’re going to be strongly advising users to treat companies in certain industries and sectors differently from others, and will be providing you with some guidance in doing so.

Yuval, I have to disagree. While I understand your perspective, things like Gross Margin and Enterprise Value/Sales have tremendous value in identifying good buying opportunities - even if those factors may not seem intuitive. For you to just dismiss this is not only inappropriate but will seriously harm my investment results. If my results suffer in the future from using these ratios, that’s my business. It’s not your place to impose your opinion on data use.

Just to clarify something here. Perhaps I didn’t make myself clear. You wrote, “things like Gross Margin and Enterprise Value/Sales have tremendous value in identifying good buying opportunities”–yes indeed. They certainly do! I use them all the time. But for companies in the financial sector and for health-care providers you’re probably going to have to find other ratios, because it may be impossible to calculate those based on FactSet’s data, and the reason for that is that gross margin and enterprise value have no meaning for insurance companies and banks. It’s like trying to measure the number of calories in a rock.

I will also say that I could very well be wrong. Maybe you have figured out that insurance companies can actually supply a meaningful measure of their cost of goods, or that enterprise value can be calculated in a meaningful way for a bank if one makes certain assumptions about the nature of the bank’s debt. If you convince me of that I will change my mind and thank you for it.

Yuval and mm, why can’t you do both? The standard ratios can follow standard conventions, and those who want to create custom ratios can use individual line items?

Sounds reasonable Chipper. Fwiw I’ve created some custom ratios (well, they’re fairly standard fare, more like custom formulas of standard factors) that, thus far, have created some alpha. My screenshots show some examples of what I have created, mostly using $EV / trailing 12 months of sales or cash flow. Also, note that ROI and GMgn don’t work for these financials, and for the same reasons, however unconventional, they’d be useful to me.

And Yuval I should add that I found these ratios worked in the unlikeliest of places - my take on Greenblatt’s Magic Formula. As you may know he excludes financials and utilities from his formula (simply put, quality + value) - for the very reason you state. But after creating my own ‘Magic Formula’ screen I later read something in the academic literature that made me revisit the exclusion for financials. Without divulging the details, I found that there are some financials for which their inclusion enhances Greenblatt’s Magic Formula. Furthermore, my other models that one might expect to identify opportunities in financials (i.e., using Pr/Book or Equity/Asset ratios) weren’t effective in identifying these same stocks. Simply put, I don’t think I can turn elsewhere to reliably find these same opportunities.

I should add this - I think it’s a slippery slope to impose a uniformity of thinking, or an adherence to financial theory - for Portfolio123’s business model. While I admit that using enterprise value (i.e., debt) seems like a dubious way to approach financials, sometimes there are opportunities to be found simply because no one else is looking. If we all (meaning the greater P123 community) adopt largely similar inputs, we will be receiving similar output (i.e., stocks), and consequently getting largely similar investment results. At the margin, adhering to the orthodoxy (financial theory) might compromise our intellectual capital and, in the process, potentially undermine P123’s business model.

Just my $.02.

Thanks for your hard work P123 team!! I can see my model running result in beta site is continuing improving! It will take more time to get it stabilized, so also thinking we may need to extend Compustat data so we have more time to test and find potential issues.

P123 team,

I do not know what you did but thank you!

The FactSet data (exclude prelim) now mirrors the Compustat data from above as shown in the image below.

Best,

Jim


Yuval,

Have you determined where you’re going to get short interest and closed end fund data from?

Scott

You guys are probably already on this, but I am still seeing some weirdness in the Financial Statements of ADRs especially in the Cash Flow Statement. Two tickers I am currently looking at are KOF and FMX. If you just look at the Snapshot of the Financial Statments under Panels you will see a lot of differences (easiest one to spot is that the year index is different).

Thanks!

What’s the official cutoff date before extension, July 1st?

That’s simply not possible with FactSet data.

Let’s look at Citigroup, for instance.

In 2019, Citigroup reported total revenues net of interest expense of $74 billion and net income of $19 billion.

Now what happens in between those two numbers? FactSet takes the numbers Citigroup provides, codes them, and gives the data to us. A few of the numbers are slightly different, but that’s to be expected. But notice: there is, in Citigroup’s statement, no cost of goods, no gross profit, no gross income, no EBITDA. Their EBIT, which is called “income from continuing operations before income taxes,” is $24 billion, which FactSet rightly calls “operating income.” Now FactSet adds back depreciation to get EBITDA: $27 billion.

Meanwhile, what is Compustat doing? They report revenues as $103 billion (as does FactSet), deduct cost of goods of $59 billion, arrive at gross profit of $44 billion, and then get to operating income of $40 billion. They then deduct interest expense of $16.5 billion to get at pretax income of $24 billion (which matches FactSet).

Now how did Compustat arrive at those numbers for cost of goods and gross income and operating income, none of which are in Citigroup’s financial statements? How they calculate cost of goods and gross profit is extremely complicated, and we can probably figure it out. They get operating income by adding interest expense back to what Citigroup reports as operating income. Is that the right thing to do for a bank?

Do you see now what the conundrum is? It’s that Compustat is giving you numbers that FactSet is not giving us because they’re not reported as such. Without Compustat’s numbers for cost of goods and gross profit, you can’t get gross margin. And your operating margin is going to be completely different whether or not you count interest expense above or below operating income.

Now we have some work to do to get all the FactSet numbers right. For instance, right now we have N/A for Citigroup’s operating income, and this needs to be fixed. But you get my drift. It’s simply not possible with FactSet to come up with gross margin and gross profit for banks without trying to reproduce what Compustat is doing, which would be very difficult.

As for EV, that relies on adjusting market cap by total debt and cash and equivalents. Again, FactSet gives cash and equivalents as N/A for banks. Compustat comes up with a number for this. But there’s nothing in Citigroup’s financial statements that says that their cash and equivalents add up to $456 billion (Compustat’s figure). Once we stop using Compustat, that number is going to go away. We can try to calculate it on our own, but I’m not sure if we can or how.

If you want to dig deeper, I suggest looking up some financial statements on EDGAR and comparing them to Compustat’s numbers. Compustat is doing a lot of wizardry behind the scenes that may or may not be valid but certainly isn’t apparent in the financial statements.

All data providers have to standardize financial statements somehow. FactSet does it differently from Compustat. And that will inevitably result in different results, including a lot more N/As.

Short interest: no, not yet, but we’re working on it.

CEFs: FactSet has excellent CEF data.

Yes, we’re working on those things. The seminannual reporting is giving us headaches, and the years are wrong on the beta site. We hope to be able to fix this soon. Thanks for your diligence!