I have a few questions and bits of feedback after having tested a few machine learning models and building some resulting predictors. I've perused some but not all of the beta discussions so forgive me if I'm duplicating something already asked/answered.
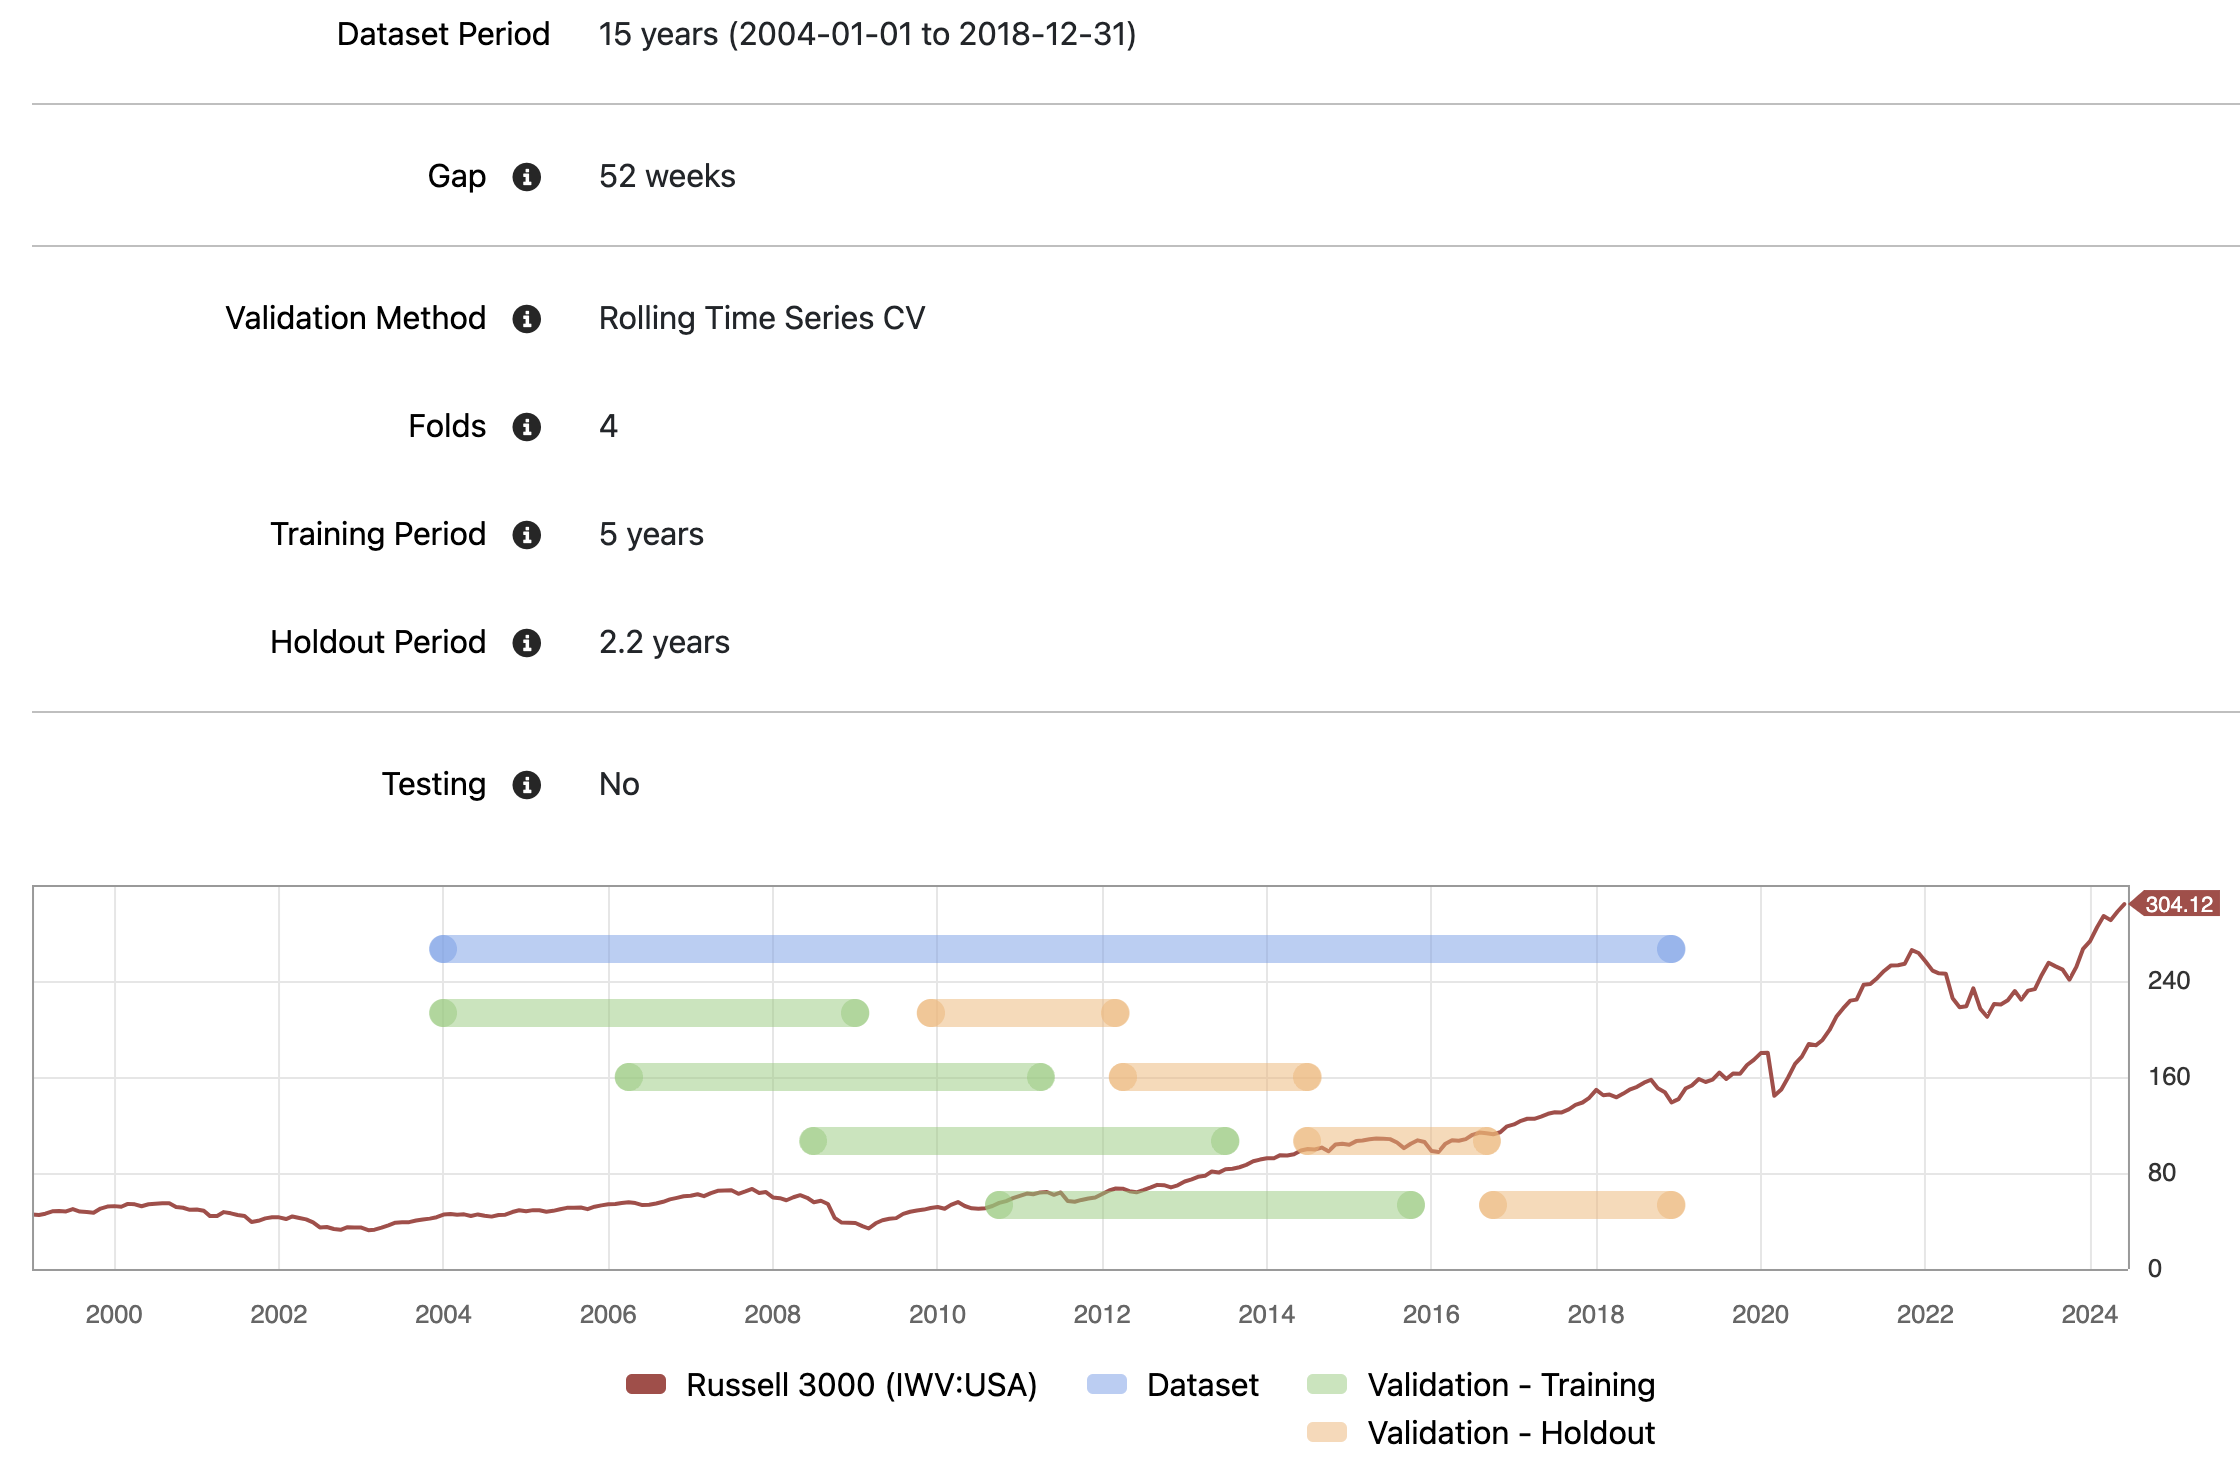
My biggest concern is the incongruity between the training method for a model and the "AI predictor" after the model is validated. For example, say I use rolling time series cross-validation to select my model type and hyperparameters as in the settings below.
Here I am training my models on 5 year rolling window that is re-trained ~2.2 years. So my lift/portfolio/return metrics are based on these assumptions of window length, periodicity of retraining, etc. However, when I generate a predictor from these models, these options are not available. My only option is a single fixed window which in my case defaulted to a full 15 years. The model performance can definitely change when there is such a drastic change to how the model is changed (5 year window with 2.2 retraining period and 1 year gap in selection vs. 15 year window with no re-training and unspecified gap in prediction). I can't necessarily have confidence that the generated predictor will have fidelity with the performance of the model I originally tested.
And unless I'm missing something, it looks like you can only trade on AI predictors with a static set of estimated parameters and not models that update their parameters periodically with new data.
My next biggest concern is that the machine learning models are too black box, as I haven't found a way to crack open the results for sanity checking, inspection, etc. For example, if I fit a linear model, I can't see the regression coefficients to check the signs or magnitude of coefficients for my features.
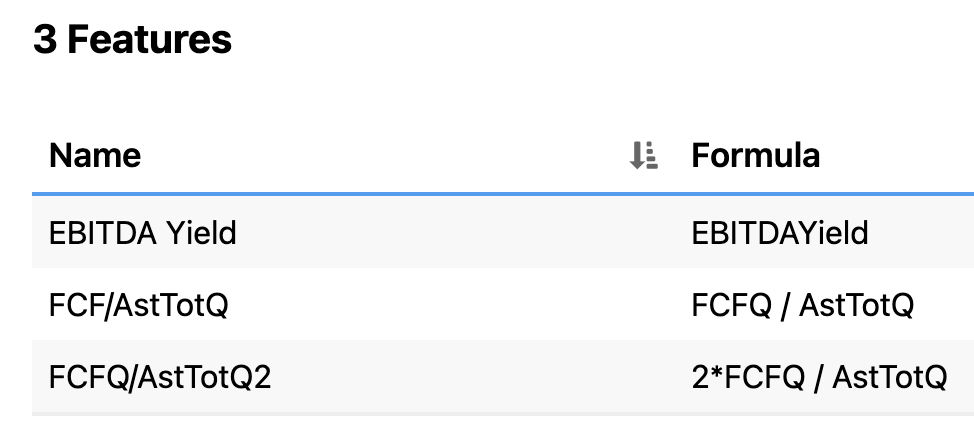
I've seen a few others already suggest for adding functionality for checking for feature correlation which I would also like to see. For example, I can generate models that contain a perfectly collinear feature despite the checks in place for identical formulas.
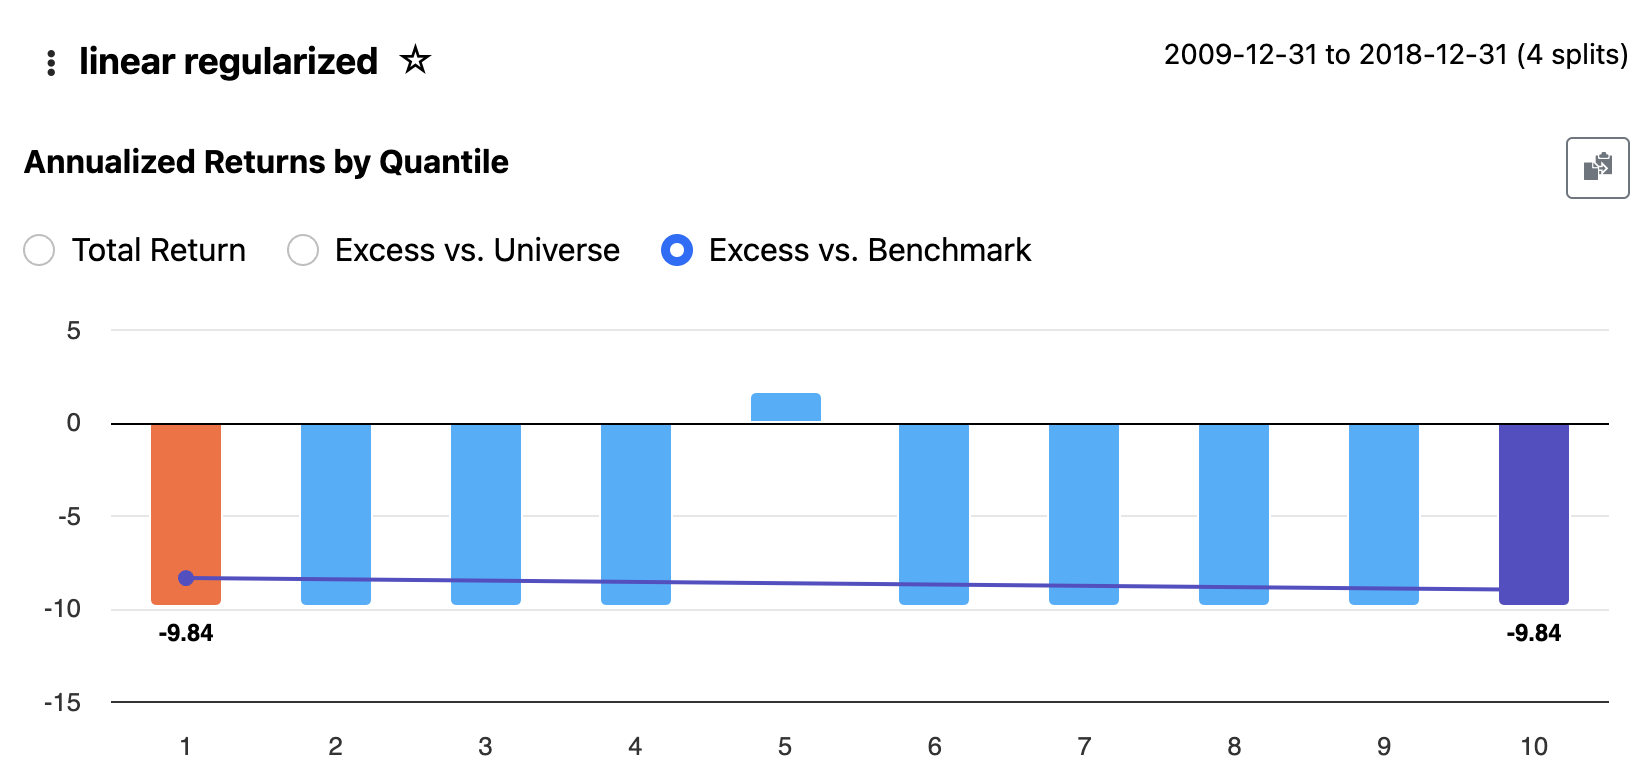
It looks like there are no visible errors in the sklearn logs that I are exposed to me, but I am getting clearly bad results for some models like "linear regularized".
Going back to my previous comment, it's currently a bit hard to look under the hood to debug things if you get a result like this.
How is the "frequency" setting under /dataset/period used? I'm assuming it's not used to train/test the models at all but rather used by /results/portfolio and /results/returns to determine how frequently to re-rank quantiles based updated target forecasts. Is that correct? An informational link for this setting (an "i" button like the others have) would be helpful.
Under /prediction, it looks like I can only see normalized predictions of my target variable. Is there a way to get raw forecasts? I can see potentially wanting to use a raw forecast of future return in my portfolio formula weighting. It's also more interpretable for a human.
I don't see a way to view the means and standard deviations used for Z-Score normalization which would be handy even for debugging. So I don't think I could convert from a normalized to raw forecast even if I wanted to.
As someone suggested on the webinar, it could be useful to have different normalization methods for different features or for the target variable.
A UI nitpick, but I can't see an easy way to generate a predictor from a model from any of the /results pages. Instead, it seems I have to remember the model name/hyperparameters and go under /predictors and look it up and select it.
Another UI suggestion: when importing features from a ranking system, I get an error if I have a duplicate node name. I have the occasional duplicate in some of my systems if I use the same formula for say both Universe scope and Industry scope. My only option is to cancel the import. It would be handy to have an option to rename features when importing or maybe also to have a checkbox option to be able to import a subset of features from the ranking system.
P123 should have enough metadata on an AI predictor to identify when running a simulation or ranking backtest that overlaps with its training period (and ideally it's gap period too). Ideally this should be an error to prevent accidental cheating, and I'd personally really like to see this feature before I rely on a designer model that includes an AI predictor.
Regarding your point about validation training vs final model training: My experience is limited, but I've always found that a larger training dataset leads to increased out-of-sample performance. Is this unreasonable? Is there an expert consensus on this?
P123 provides a Time Series CV and a Rolling Time Series CV because there is no consensus on this. A rolling or sliding window has the theoretical advantage of training on more recent market conditions. P123 recognizes the lack of consensus. Marco did a good job with cross-validation in my opinion.
BTW, I like all the data I can get too and use Time Series CV (or k-fold) myself.
The "Create Predictor" popup has a training range that defaults to the dataset length, but you can change it to whatever you want, like most recent 5Y for example
Work in progress to expose more info in the Results that are model specific. Some output is already calculated. We just need a way to present it in a "Model Specific" output result page.
We are brainstorming this and other Feature Engineering tools
We are investigating and working to fix the linear models
Uhm.. it's the only setting that does not have a 🛈 Sampling frequency used to build the dataset, as well as the rebalance frequency for the portfolio results. So for example a 4 week frequency will add 13 different dates of data to the dataset for each year, and rebalance the portfolios in the results pages every 4 weeks.
Good idea, should be easy
Yes . But we will have to prioritize the many suggestions coming in somehow
You can do it from the three dots next to the Model name in Lift, Portfolio and Return. We need to add those three dots in Compare All
We've been discussing this. There really is no use for a backtest that uses any data used in the training of the predictor (debugging maybe?) We're leaning towards giving an error if a predictor is used with data used for training.
Would be interesting to create a predictor that lets you recreate the validation folds. In other words a special predictor that automatically switches predictor instance based on the as-of date of the backtest. So for ex. a 4 fold validation will have 4 different predictors instances.
Re. Designer Models... We no longer calculate any stats based on backtest data, only out of sample. This has been in place for several years and I think curve-fitting is no longer an issue. Curve fitted models fail out of sample and it's pretty obvious. You can still see the backtest data if you want, but it comes with disclaimers. Furthermore we have a 3 mo. incubation before a model can be opened.
Also please note the the "Classic P123" models presently suffer from using training data. Ranking systems are being optimized using the same data that is then used for a backtest. However it's not as obvious as with ML since ML is much better at curve-fitting.
I want to use predictors in backtests to see how and where they improve the ranking systems I am already using. Would the combination perform even better?
My ideal: the factor automatically switches predictor instances based on the date and returns NA during dates without an appropriate predictor. I think this would also provide the most flexibility
That's very helpful. I can see an argument for those being two separate settings. The sampling frequency is more tied to the length of your target variable for drawing independent samples, while the rebalance frequency is more tied to how frequently you plan to trade. They may not always be the same.
This is exactly what I'm looking for and what I was getting at in point #1 in my original post. In model validation, I'm testing a model out that is updating its estimated parameters periodically, but have no option to replicate that behavior when I take it to a predictor to run simulations or live strategies off it.
This was more most hoped for feature with the new ML functionality, as I'm already using the API to pull data (albeit rank-normalized), fit a model, and generate a ranking system. But since p123 has no provisions for dynamic ranking system weights, I need to keep them fixed. I was hoping the ML features would be a path beyond that limitation.
That last point a 100% agree with.
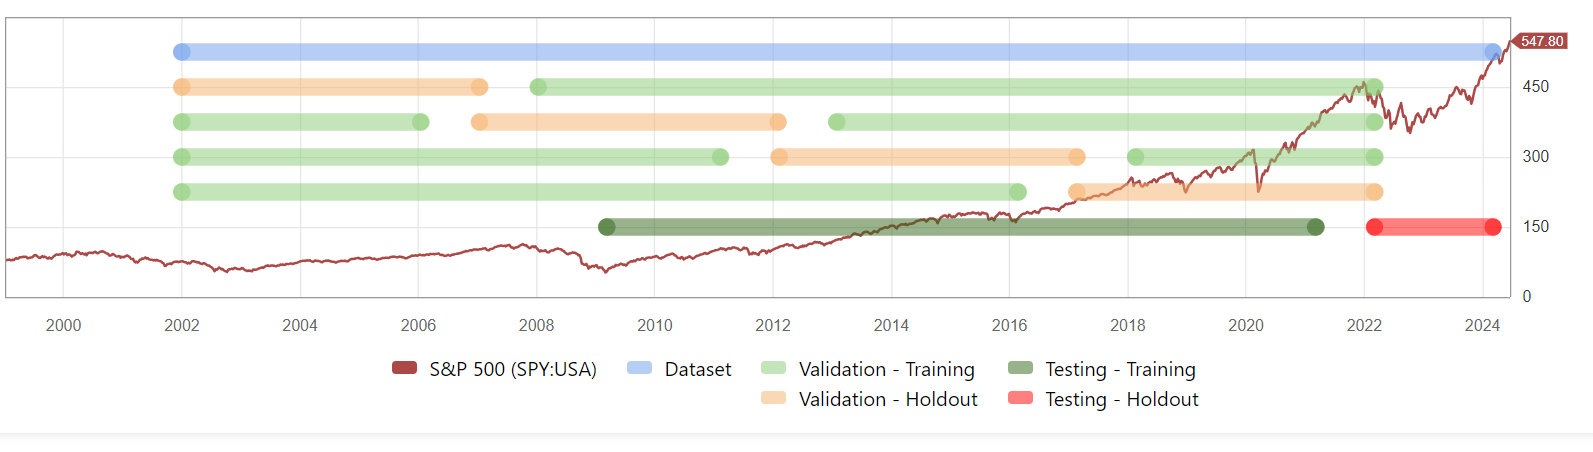
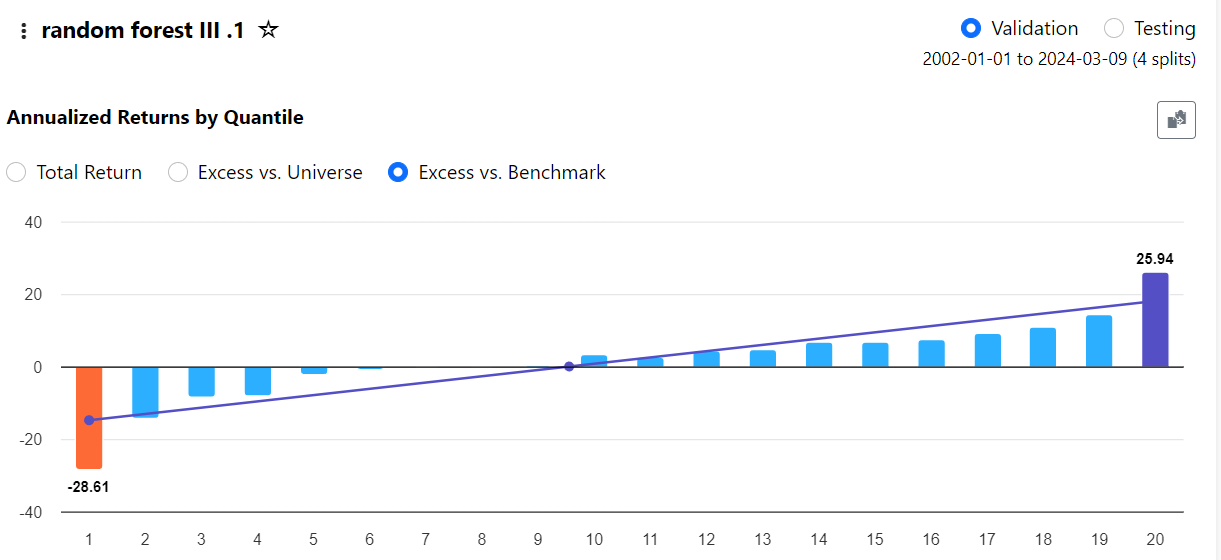
Thanks for taking the time to reply. By the way, the chart under /validation/method is a truly brilliant piece of UI, presenting very clearly and concisely what dates you're using, how you're using them, and what market regimes your training and test windows are covering. Really well done!
Now what I want to do is look a bit 'under the hood' to see if I can make some intuitive sense of the results.
For example, I would like to know what factors have the most explanatory power. That way I could perhaps make a 'classic' ranking system out of it to see if I can somewhat replicate the results.
I also want to look under the hood to see if I can improve the model by incorporating other factors or maybe removing some.
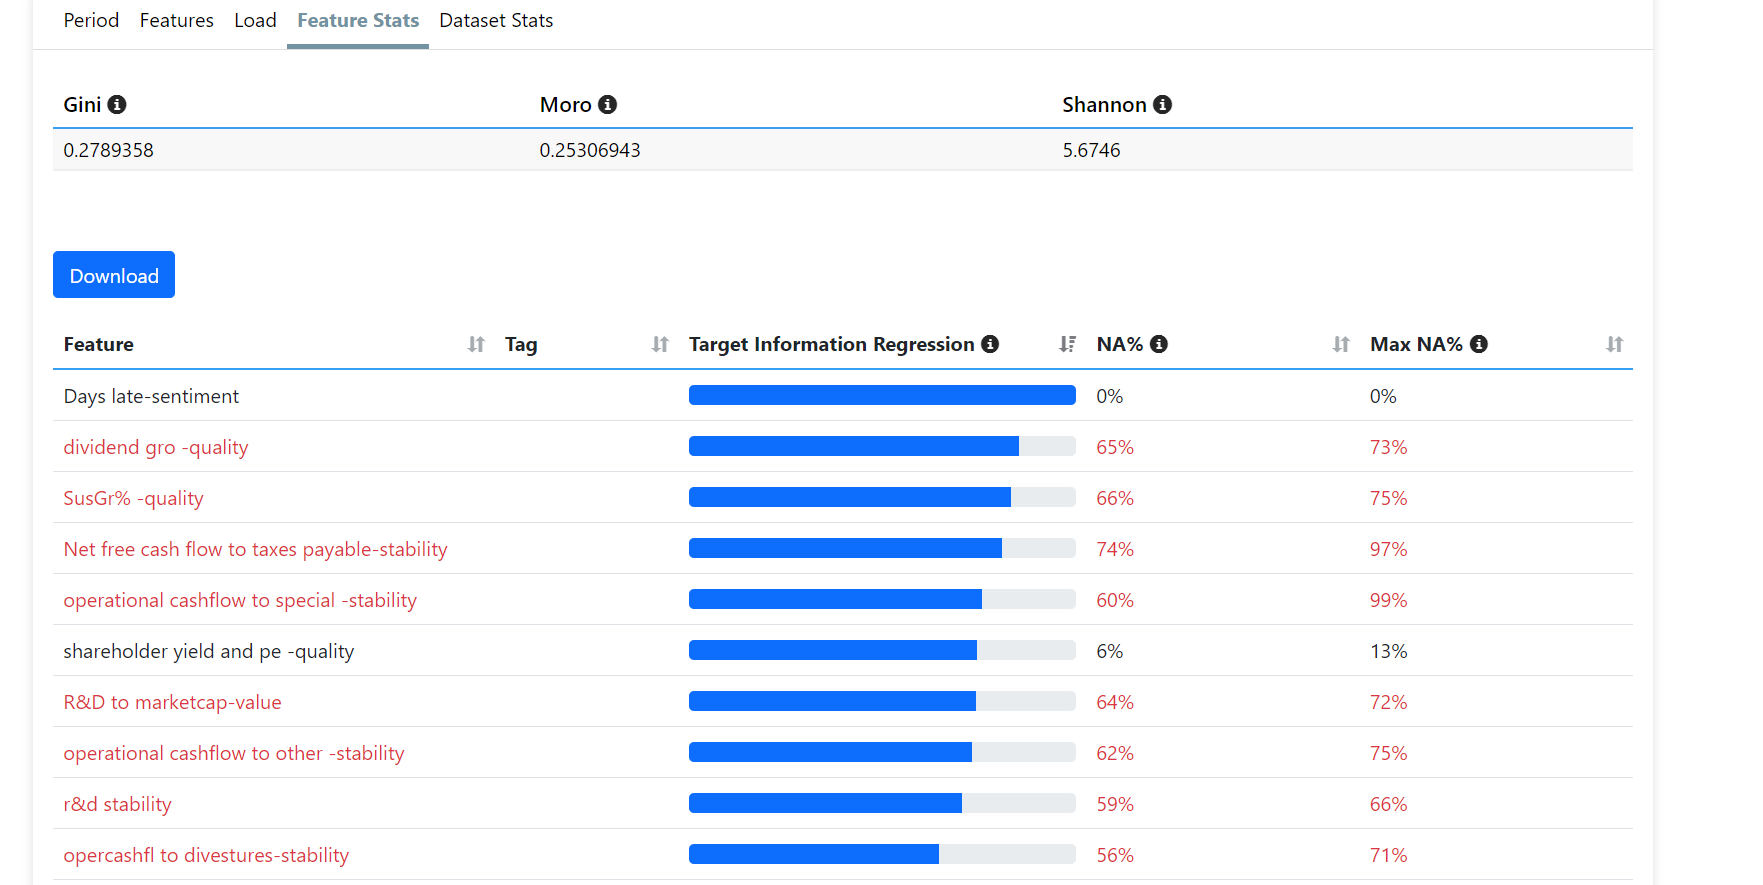
When I look at the 'Feature stats', I can see that some of the features with the highest Target Information Regression are actually ones which have high NA%.
I understood that high NA% (above 29%) are probably better to remove from the feature list. However, I can see that they seem to have big explanatory power. How would I proceed here?
But P123's Target Information Regression does not work for me for some reason.
When I use my DataMiner download with pretty much the same features and mutual_info_regression at Sklearn I get different answers that work for me and make sense.
Here is a repeat of the code so that you can use to see for yourself if there is a significant difference:
I have no access to P123's code to understand why there is a difference or why I need to use Jupyter Notebooks to get answers that make sense to me.
from sklearn.feature_selection import mutual_info_regression
import numpy as np
import pandas as pd

# List of factors
factors = []

# Read data
df8 = pd.read_csv('~/Desktop/DataMiner/xs/DM8xs.csv')

# Combine data for training
df_train = df8.copy()  # Use copy to avoid setting with copy warning

# Drop rows with missing values in any of the factors or target column
df_train.dropna(subset=factors + ['ExcessReturn'], inplace=True)

# Define features (X) and target (Y)
X = df_train[factors]
Y = df_train['ExcessReturn']

# Compute mutual information scores
mi_scores = mutual_info_regression(X, Y, n_neighbors=3)

# Display the mutual information scores
mi_scores_df = pd.DataFrame({'Feature': factors, 'MI Score': mi_scores})

print(mi_scores_df)
We're investigating issue with Target Info Regression
There are also model specific stats that can help you with Feature Engineering or identify factors that could be used in classic ranks. We're working on that also
Sorry if this has been answered elsewhere but I believe the AI factors create their predictions based on non-linear functions For example classic port123 calculates GMgn%TTM based on higher is better. However extremely high margins usually lead to lower future returns, My question is does the AI calculate predictions based on a parabolic relationship? So that it would find the sweet spot or the best margin % that would predict the best return?
If so to me this is one of the main benefits of the new AI.
A random forest or XgBoost is not parabolic. But it definitely is designed to find the sweet spot. ChatGPT or a text could probably tell you how it is done better than my post.
But you are not the only on who thinks that is an potential advantage worth exploring.
Recursive Splitting: Decision trees split the data at different thresholds of the feature values. For a parabolic relationship, the tree can create splits at points that segment the data into regions where the relationship changes direction.
Multiple Nodes: By creating multiple nodes, a decision tree can approximate the parabolic shape. Each node represents a split that captures part of the non-linear relationship. For example, one node might capture the increasing trend, another might capture the peak, and subsequent nodes might capture the decreasing trend.
Leaf Values: The leaf nodes of the tree contain the predicted values, which can be different for different segments of the feature space. These leaf values can approximate the curved relationship by assigning higher values in the middle range of gross margin % and lower values at the extremes.
Has anyone suggested creating an option where factors/feature can only have a maximum weight in the prediction say 5-10% to help reduce curve fitting or protect against changing factor regime? Or better yet where the user can enter a maximum weight for instance in a 80 feature dataset the user could enter a maximum weight value of say 5%. While this may reduce back tested results it may result in better live port returns.