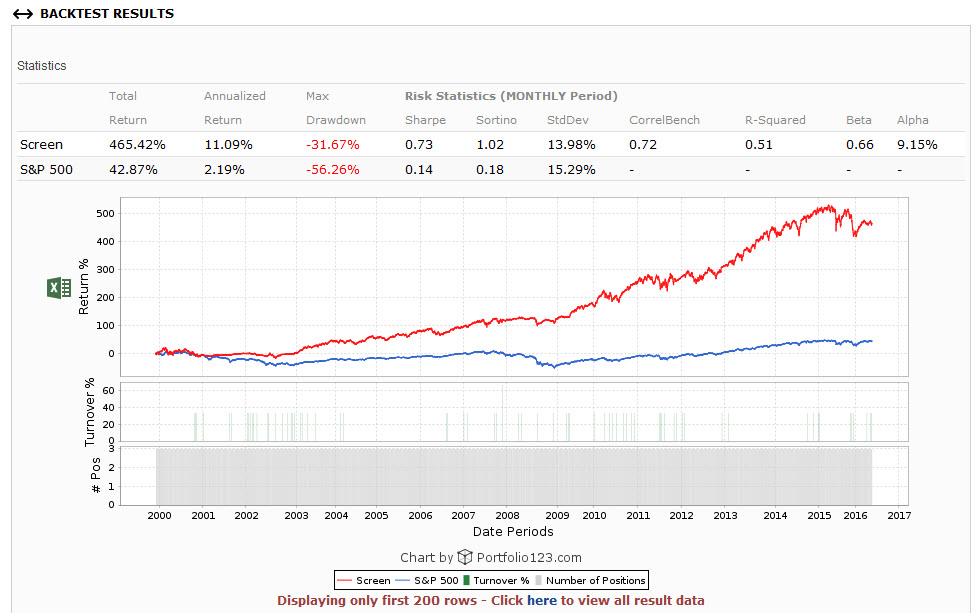
When I run a ETF simulation, the result is even worse with only 9.5% return: https://www.portfolio123.com/port_summary.jsp?portid=1434174
Here I used as sell rule Rank<101 but activated “Allow sold holdings to be re-bought at current rebalance” to Yes.
Has anyone an idea why the results aren’t better?
PS: I also used to try MTS as market timer, but when I use $MTS=4 or MTS=4, I get the following error message:
Error near ‘$MTS’: Invalid command ‘$MTS’
Florian,
These are not the best ETFs to use. Also you have a huge D/D. Slippage of 0.1% is ok for ETFs.
Also play with the conditions in the custom formula.
Fred, in his article, states he is ignoring trading costs for his 12% return from 2001 onward.
Just copied the formulae 1 to 1 from Georgs post. Still get a flat line for each screener I run. Then I went on to Florians screener and tried re-running it myself. Also get a flat line. Funny thing is, if I run my or Florians screener to get recommendations instead of running a back test, I do get the proper set of recommendations (IWM, MDY, QQQ). https://www.portfolio123.com/app/screen/summary/166022?st=1&mt=9
Andreas - if you want to get this solved then you really need to make your custom formula public and post a link to it. It doesn’t matter what you think you copied, the problem can’t be reproduced unless we have everything that you are using. You gave a link to the screen but not the custom formula.
that is very strange. I did delete the carriage returns. and when I go in the formula field I do get the full formula: Eval(Close(0,getseries(“#UNEMP”))>Close(3,getseries(“#UNEMP”)),1,0) + Eval(Close(0,#SPEPSCNY)<Close(20,#SPEPSCNY),1,0) + Eval(SMA(50,0,getseries(“$sp500”))<SMA(200,0,getseries(“$sp500”)),1,0) + Eval(sma(13,0,getseries(“SP500ShortIntAvg”))<sma(104,0,getseries(“SP500ShortIntAvg”)),1,0)
The funny thing is also, that when I take other peoples screens and formulas (e.g. Florians) I am not able to run them either. This seems to be a deeper problem somwhere in the algo of P123?
Thanks for reading my article and sorry for the late answer. I don’t come often on this forum. MTS4 in a screen rule:
showVar(@MTS4,(close(0, #UNEMP)>close(3, #UNEMP))+(close(0,#SPEPSCNY)<close(13,#SPEPSCNY))+(sma(50,0,$sp500)<sma(200,0,$sp500))+(sma(52,0,getseries(“SPSI%Avg”))>sma(104,0,getseries(“SPSI%Avg”))))
With SPSI%Avg defined as a custom series in the S&P 500 Universe with weekly frequency:
UnivAvg(“1”,“SI%float”)
MTS4 components are timing indicators backed by research and common sense. Backtests a are just clues, especially when testing market timing on 2 recessions. Optimizing MTS4 makes little sense. This article was written with an open-source mindset. If you use or improve this concept and write about it, a reference to the original would be appreciated.
A pity the data is limited to 1999. It would at least be helpful if P123 could make point in time data available further back in time - at least for the S&P500 stocks.
Cheers,
Florian
Just for the ones interested: The P123 team figured out what was going wrong with my sim - the custom series wasnt long enough. So in case you encounter a similar problem you now know where to look!