We’re doing a pre-summer 2 for 1 special! (or whatever cool marketing phrase you like).
Starting tonight around 11PM through June 2023, all premium “research” memberships will have access to both regions (North America and Europe) at no extra cost.
If you have a Research membership you don’t have to do anything. Simply choose the universes in the regions you want. To activate a Research membership click here
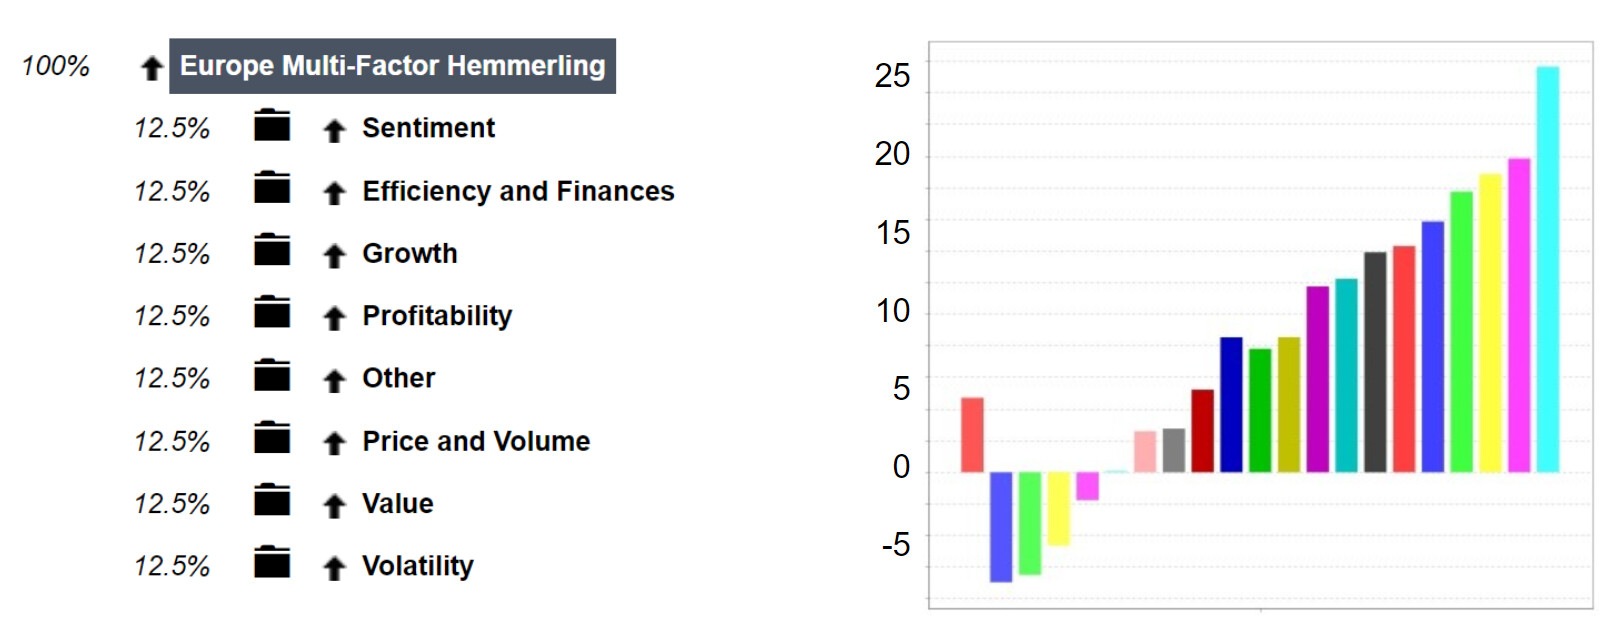
Current paying subscribers will also be receiving an email from Kurtis Hemmerling who is graciously sharing some of his systems that do very well in Europe. Here’s an overview of his ranking system that works well in Europe
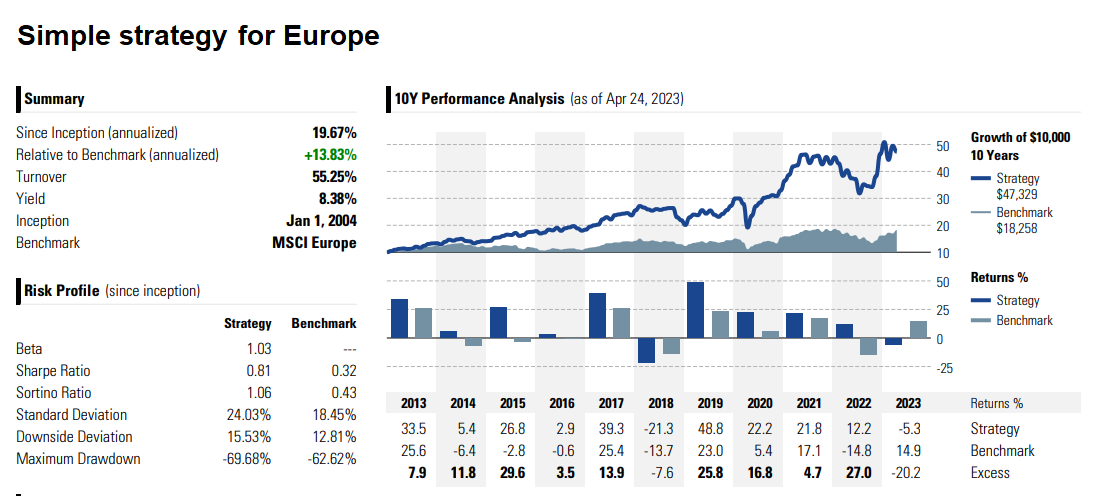
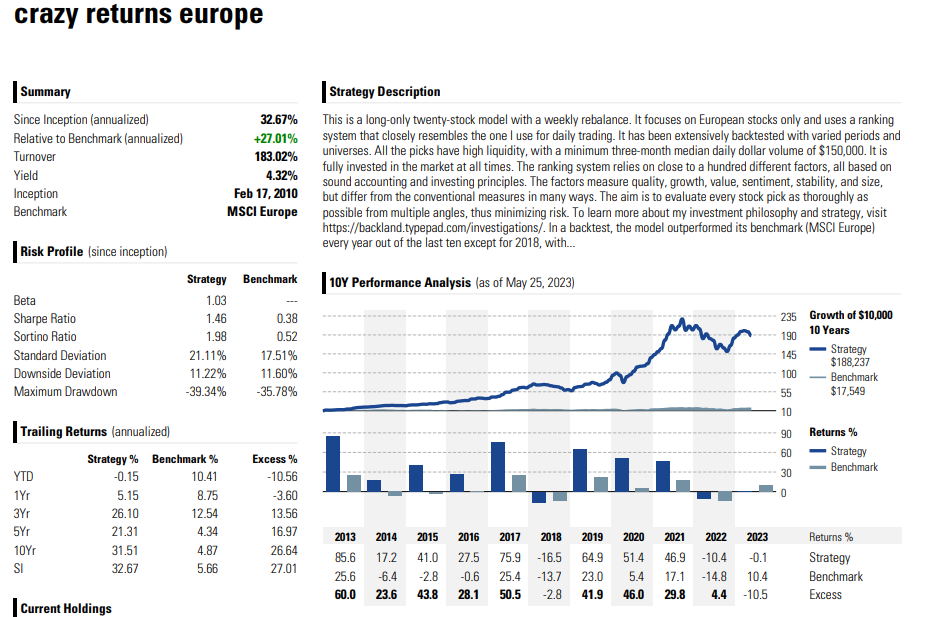
Below is the performance of a European strategy that uses the ranking system above. It has a 10Y return of 317% vs 70% for the benchmark, and a low yearly runover of around 55% (an important consideration since European stocks are more expensive to trade).
The system uses the Easy to Trade Europe universe with the following rules:
Buy Rules
Sell Rules
MktCap < 3B
Rank < 75
AvgDailyTot(100) > 3M
Enjoy both regions though June and consider subscribing to both regions to diversify your investments. This is also a good time to revisit Yuval Taylor’s blog How to Make Money Trading European Stocks.
Is there a trick to getting well performing North American systems to perform well in Europe?
I took a couple of my best systems and changed their custom universes’ starting universe to Europe Primary and added this line to the universe:
Country(“chn,hun,tur,rou”) = False
These systems maintain 20 or 25 stocks.
The 10 year results were terrible, which leads me to believe there is something in my system that really loves North America but hates Europe.
Maybe its impossible to say without studying my systems. I was surprised at the dramatic difference.
Any ideas?
Thanks Marco. I already do a reasonable job of checking for NAs in my factors. I also have all my systems set to NA Neutral. For people that have been using the Europe data for a while, is it best to build Europe models from scratch as opposed to using a North America model as a starting point?
Well Europe is a different animal. Which is what makes it so good for diversification.
Liquidity stats are weird since stocks trade in multiple exchanges. We decided against creating a proxy series that combines volume. Which means you should lower the liquidity constraints.
In hindsight, we probably wasted a lot of energy in creating multi-country universes like North Atlantic that combine Europe and NA since they are so different. Not sure yet. We’ll see
Looks like my issue isn’t just me. Europe must indeed be a different animal.
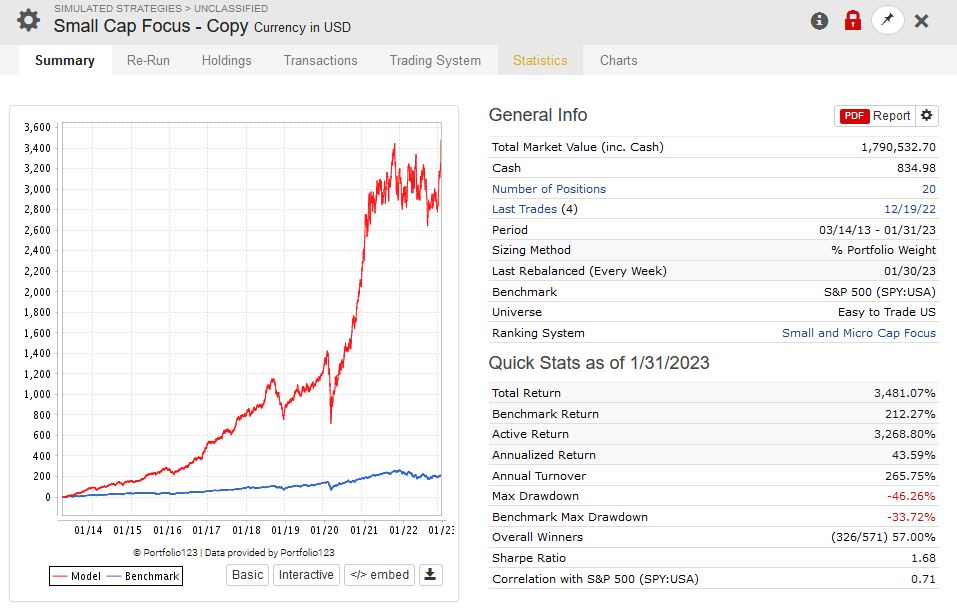
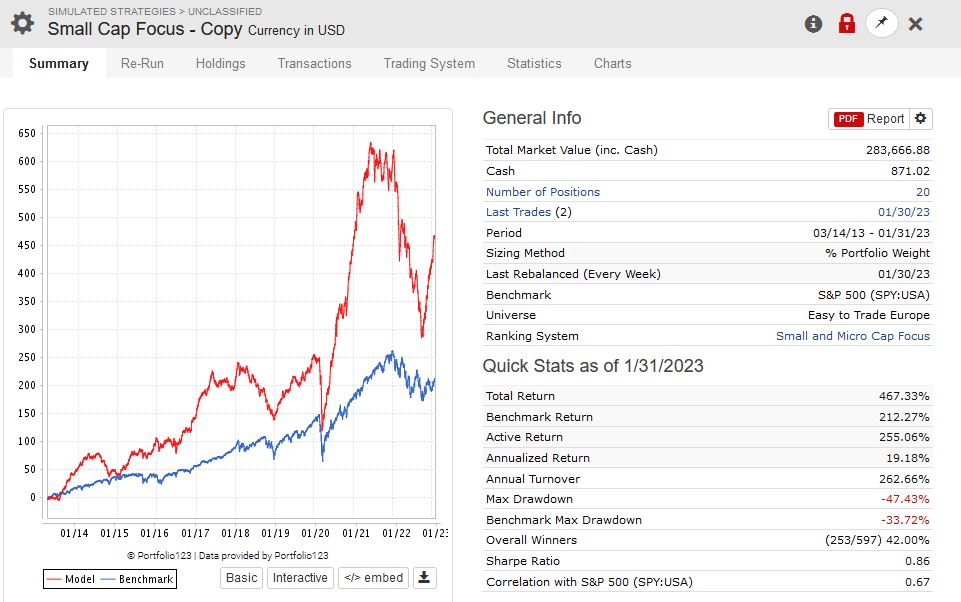
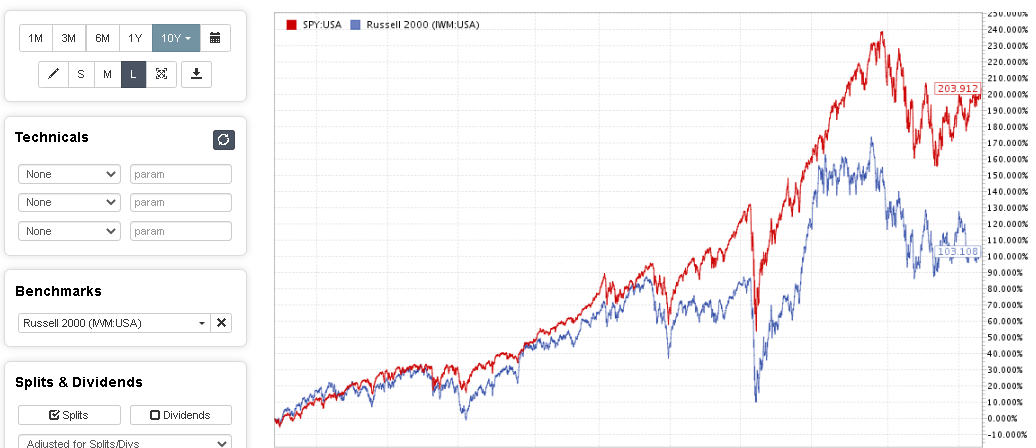
Here is the popular “Small Cap Focus” public system with an NA universe vs a Euro universe.
This does make it more interesting from a diversification point of view.
Most of this difference is due to transaction costs: they are higher in Europe due to illiquidity.
Try running both simulations with 0.5% fixed slippage. You will see that returns in the US will not move much, but in Europe, your returns will double (to somewhere between 33% - 35%). Of course, the question is whether this would be reasonable in practice. European stocks are harder to trade.
The remaining gap in returns (about 10% annually) could just be the US equity bull market the past 10 years.
When I first tried Europe, I went no further than trying out my US ranking systems and it looked like it didn’t work as well. Factors work very well…but not necessarily the same one. It took me a week or so to start finding patterns. The ranking system I designed will hopefully help you at least start your journey a bit quicker and I am sure others will quickly improve on it.
When trying your US/Canada based systems in Europe I would also suggest using the CountryCount function in your buy rules so the simulation is diversified by country.
And think about which countries you want to include. For example, you could create a universe that only contains the countries from the MSCI 'Dev Mkts Europe and Middle East" index. The rule would be: Country(“AUT, BEL, DNK, FIN, FRA, DEU, IRL, ISR, ITA, NLD, NOR, PRT, ESP, SWE, CHE, GBR”)
Emerging market countries would be TUR, POL, GRC, HUN, etc
I personally built my Europe ranking system on Europe data only. I run a North Atlantic ranking system that kicks off with a Conditional Node that checks if it’s US or European traded company and sends it to a composite ranking with my US or Europe ranking factors accordingly. For most of the year my top ranking companies were mostly European, but lately it seems like it’s been rotating a bit more into the US.
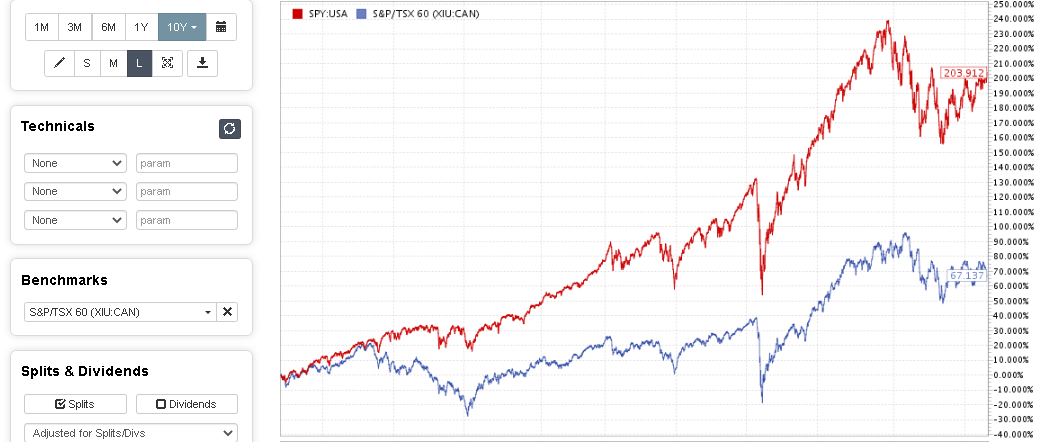
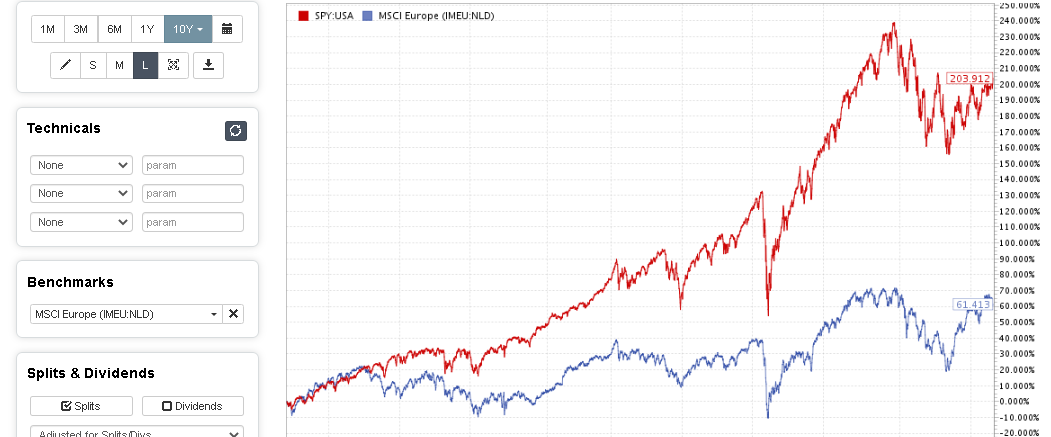
First, use the MSCI Europe benchmark, not the S&P 500 (Chaim did so, Tony did not). European stocks vastly underperformed US stocks over most of this period, but have surged in the past year or so.
Second, regarding slippage, I would take your typical US slippage and add an extra third or half. So if your US slippage is 0.6, your Europe slippage should be 0.8 or 0.9.
Third, any factor that uses a Q figure (e.g. ROE%Q or SalesQ) needs to be modified for semiannual companies when used in Europe. There are other forum posts about this.
Fourth, I like the North Atlantic universe. I use it every day. I didn’t build a separate system for Europe alone. Personally, I haven’t had the problem that Tony and Kurtis had. My test results for the system I use to trade in the US are significantly higher when I use them in Europe, even with higher slippage and despite a worse benchmark.
Your designer model for European companies seems to have a lower excess return than the designer model you offer for US markets, which seems to contradict your statement about your model working better for the European universes. Do you measure performance by an other performance measure? Probably i’m overlooking something though or misinterpreting your comment. Could you point me in the right direction?
My designer model is only three months old. In my post I was referring to a backtest of my model. In addition, my own live trading of European stocks is beating the MSCI Europe by 3% since last August (it’s up 14.5% in that period).
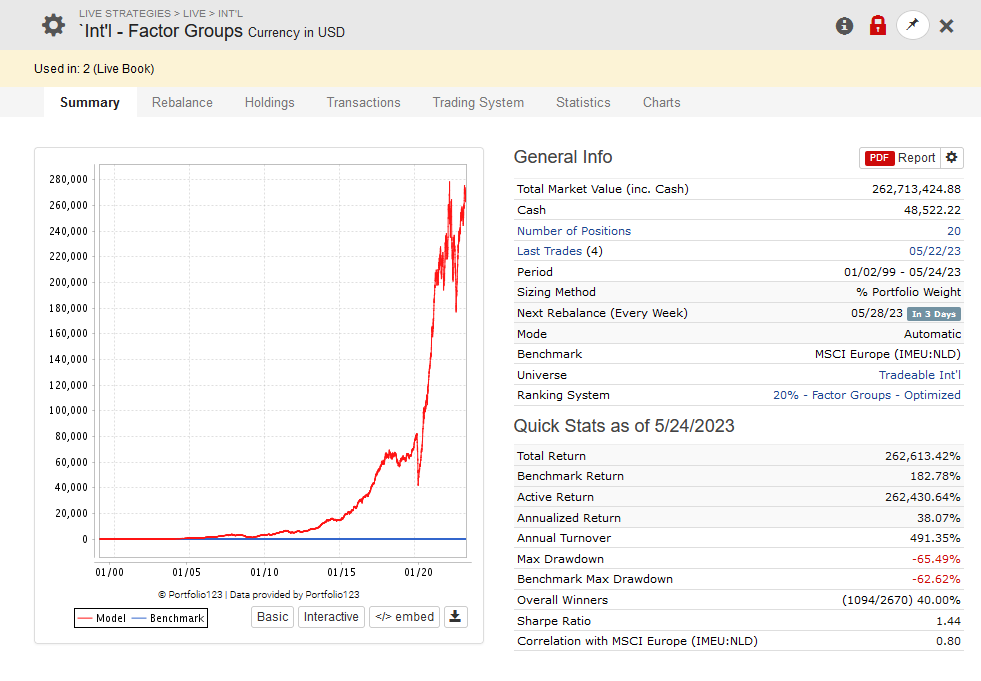
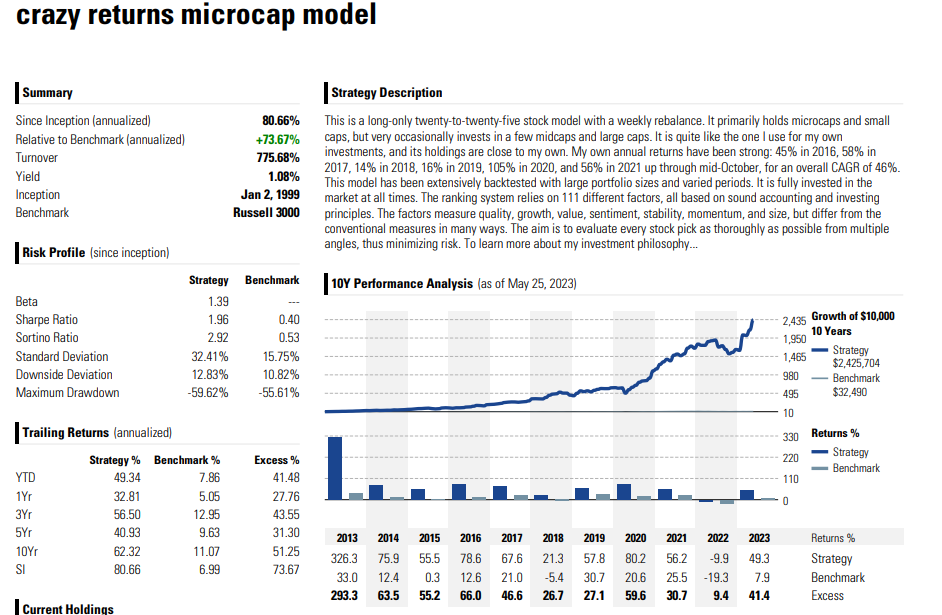
Oh, you can’t compare any of my other models to the microcap model. The proper comparison is to the two small cap models. The microcap model is for very illiquid stocks and that’s why the number of subscribers is capped at 2 people.
I am not entirely sure if I understand the question but I like to view my models 100% hedged with an appropriate benchmark to see the consistency of outperformance. That should neutralize the market component for analysis of your excess returns.