I am trying to make a mid or large cap strategy to diversify away from small caps. I know that small caps have bigger returns in the long-run but psychologically its easier to hold large caps through extreme volatility (2008 / covid etc) as the liquidity is better and the drawdowns are typically not as steep.
Unfortunately I’ve had no success at all in designing a mid cap / large cap ranking system. To anyone who has had more luck: what kind of factors are more helpful in large cap? I get the feeling that fundamentals such as valuation and quality might be irrelevant for these companies?
I tried looking into factor momentum and found nothing there. When I say factor momentum, I mean changing the ranking system overtime to weight factors higher that have recently performed well. I didn’t find anything useful at all for large caps unfortunately.
Good question. A month ago I would have said we cannot beat the SP500. I am not sure that I have changed my opinion. So I am not trying to make a point one way or another. AND THIS IS AN IN-SAMPLE BACKTEST.
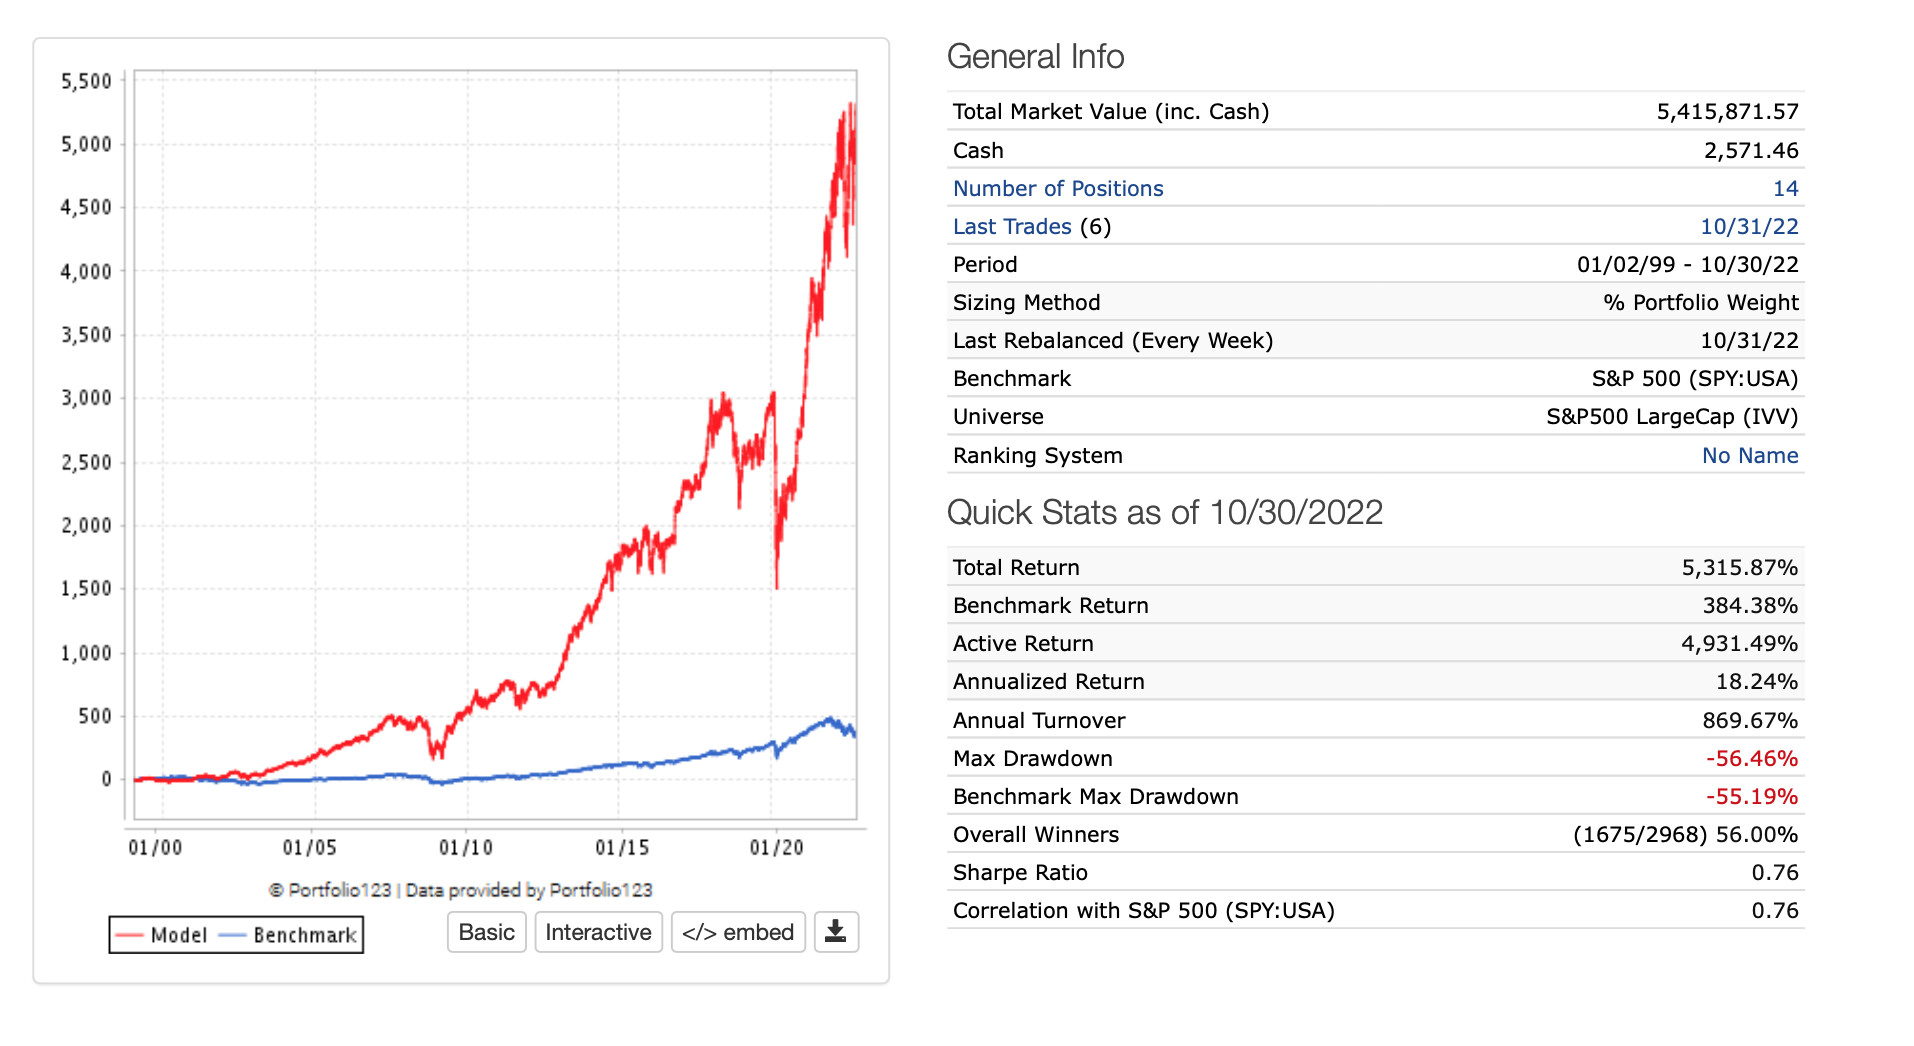
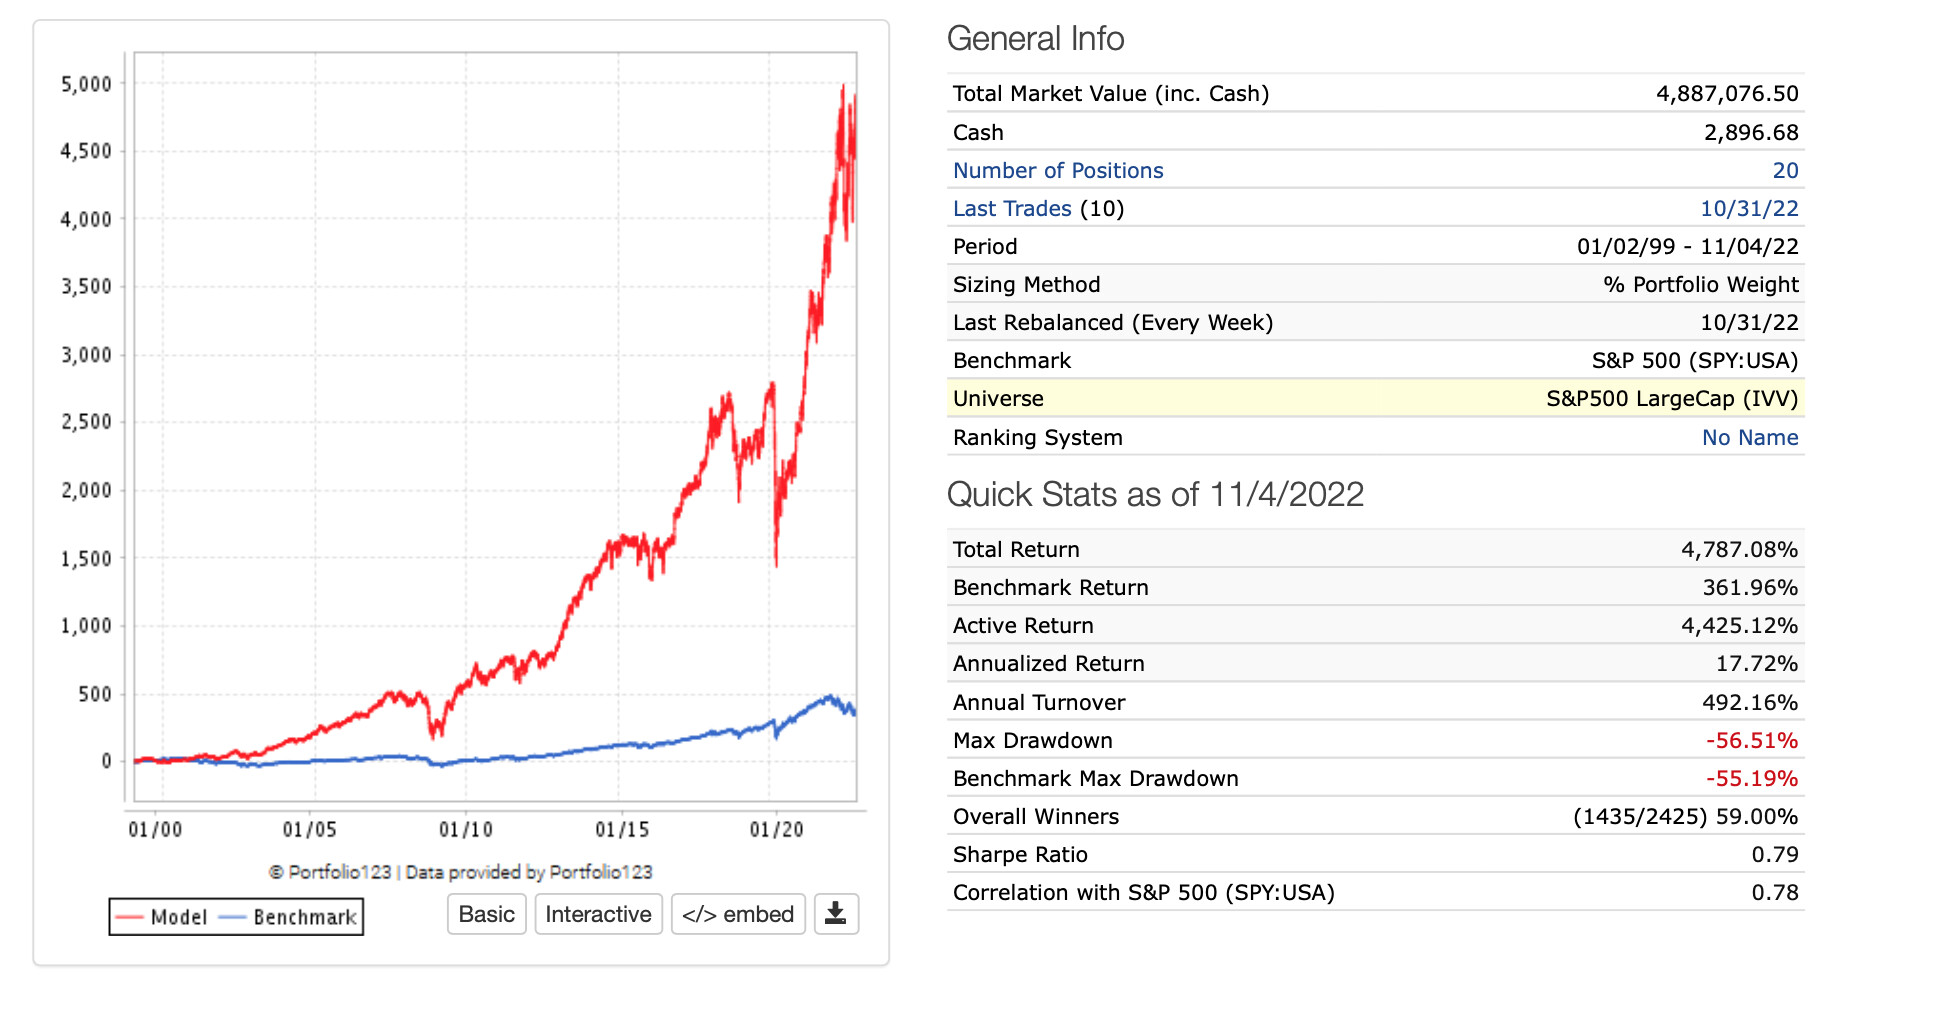
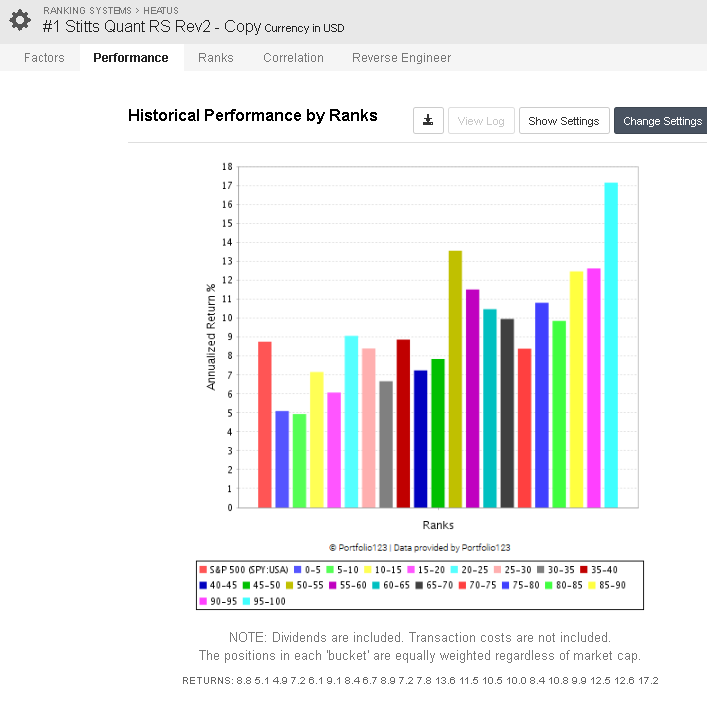
But I just finished creating a ranking system for a liquid universe that does include some micro-caps and small-caps. I had thought about reworking it for the SP500 and making it a designer model WHERE I AND ANYONE ELSE INTERESTED COULD SEE HOW IT DOES OUT OF SAMPLE. Open it if it does do well. Here is what I have today before reworking it (Next close, variable slippage). So, hmmmm. IDK and one still might want to diversify further (with some ETFs say) but:
Thanks that does help. Not very many positions but there is so much out performance you’ve probbaly got something statistically significant (depending on whether you are using a ranking system with many factors or very specific buy rules). If the former it seems statistically significant and tells me that it is possible.
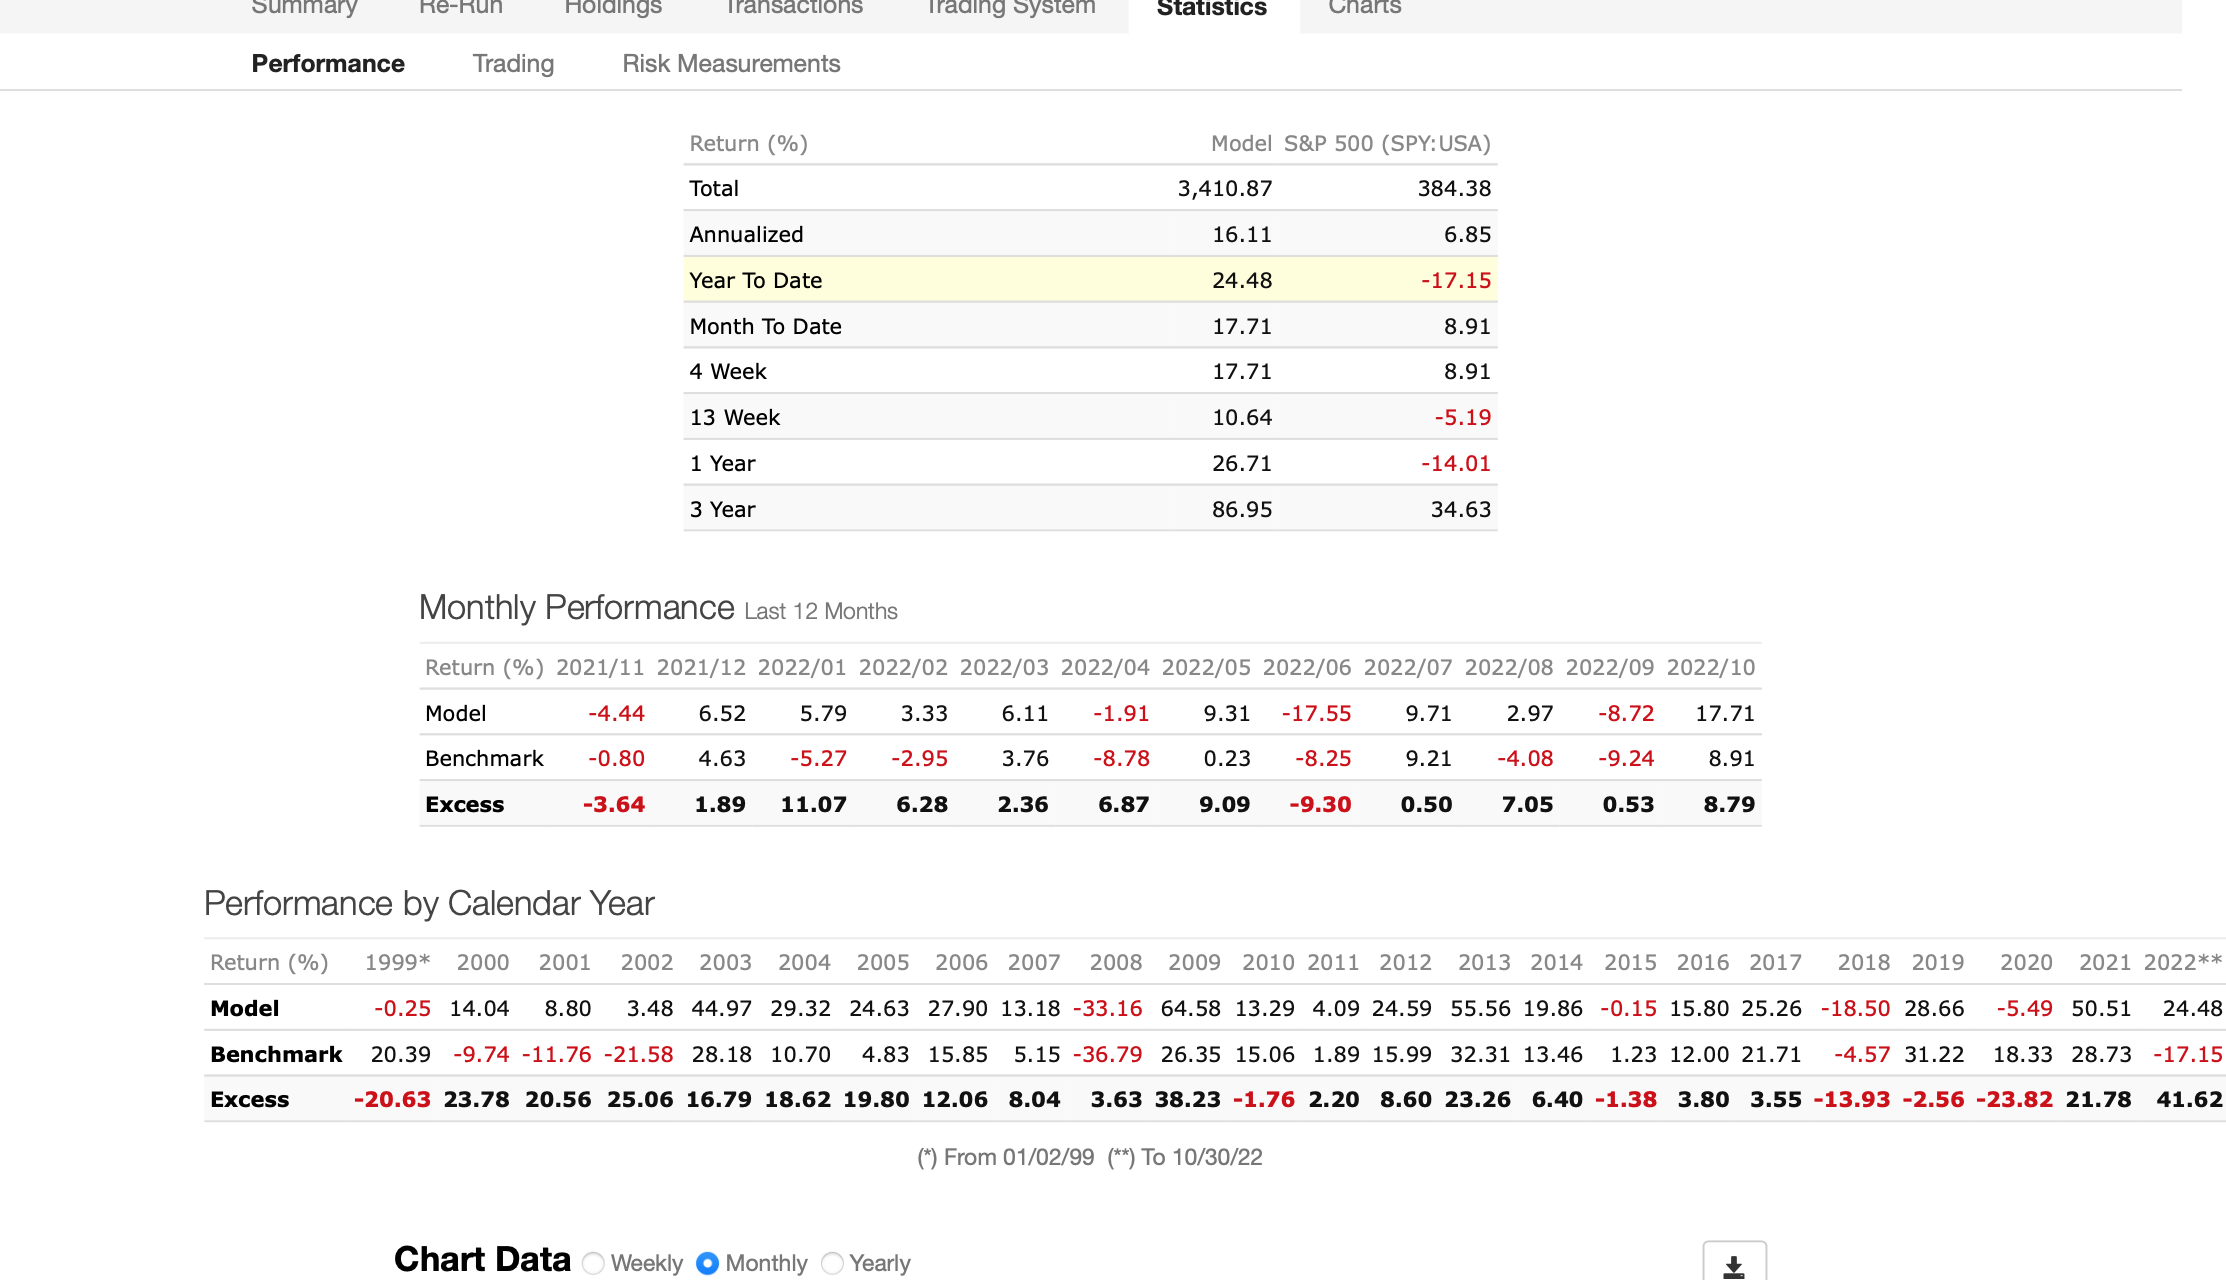
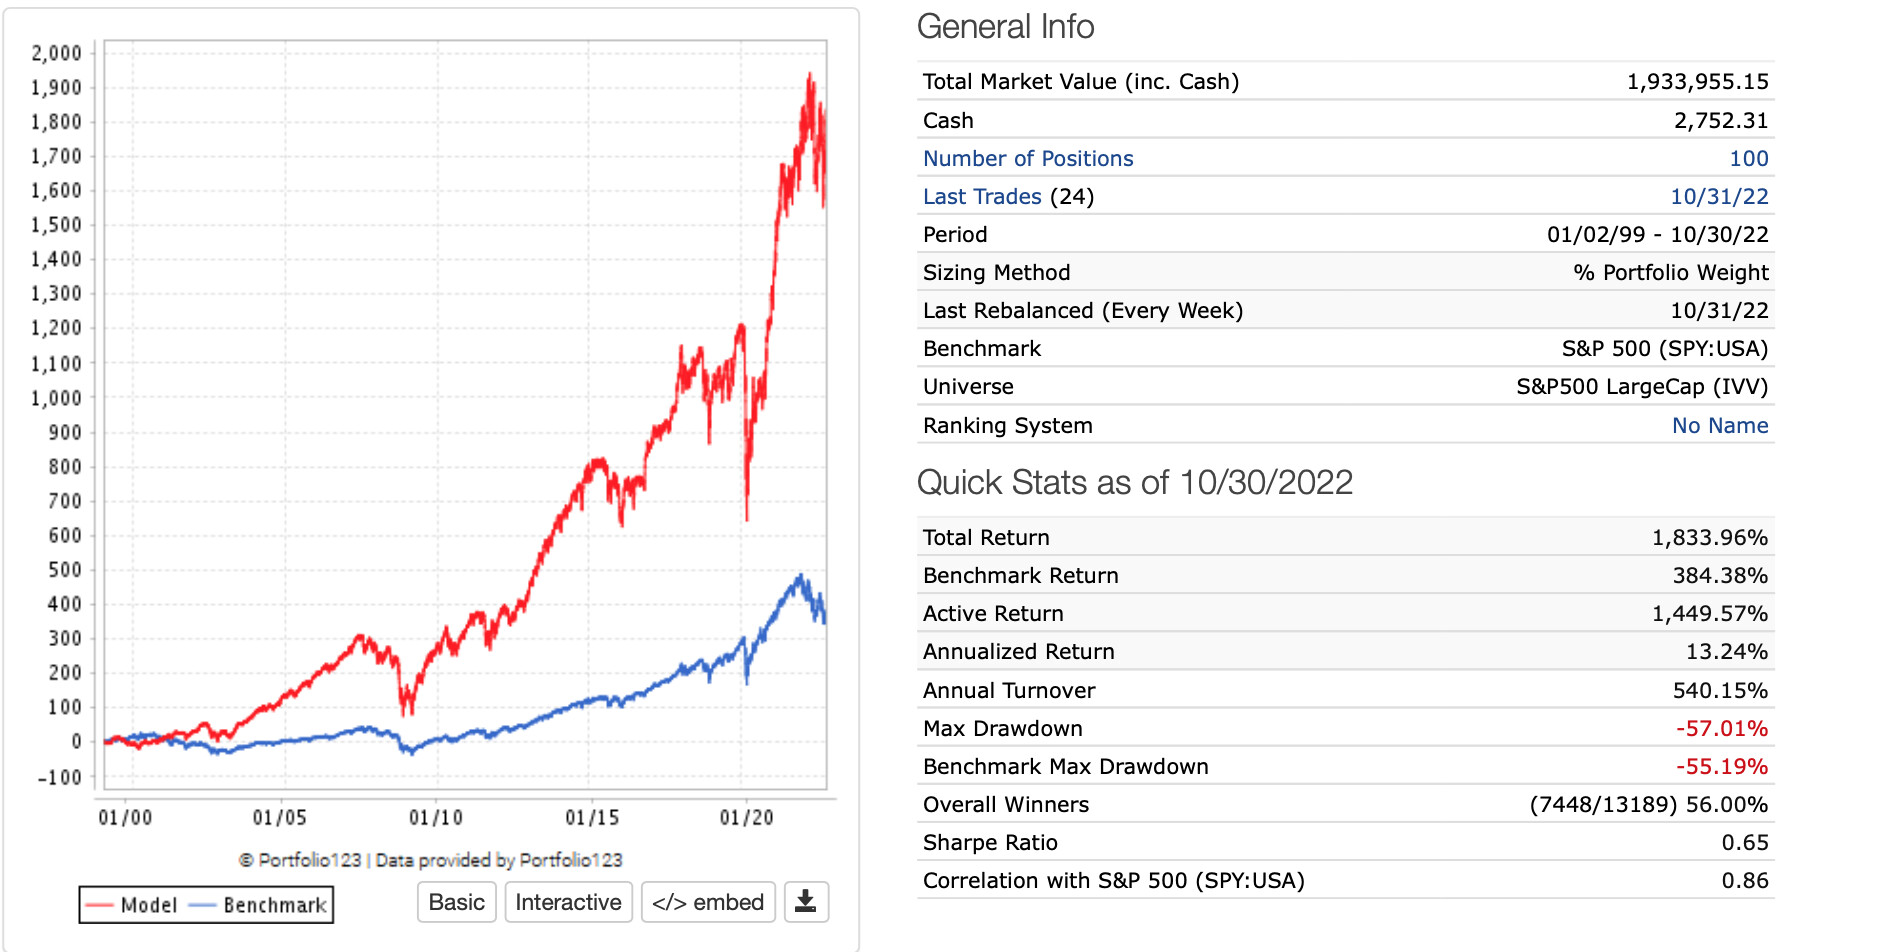
what about 100? and is it consistent each year or really lumpy (ie. huge winning years followed by huge losing years)? and was all of the outperformance from pre-2007? Its hard to see sometimes on these charts sometimes.
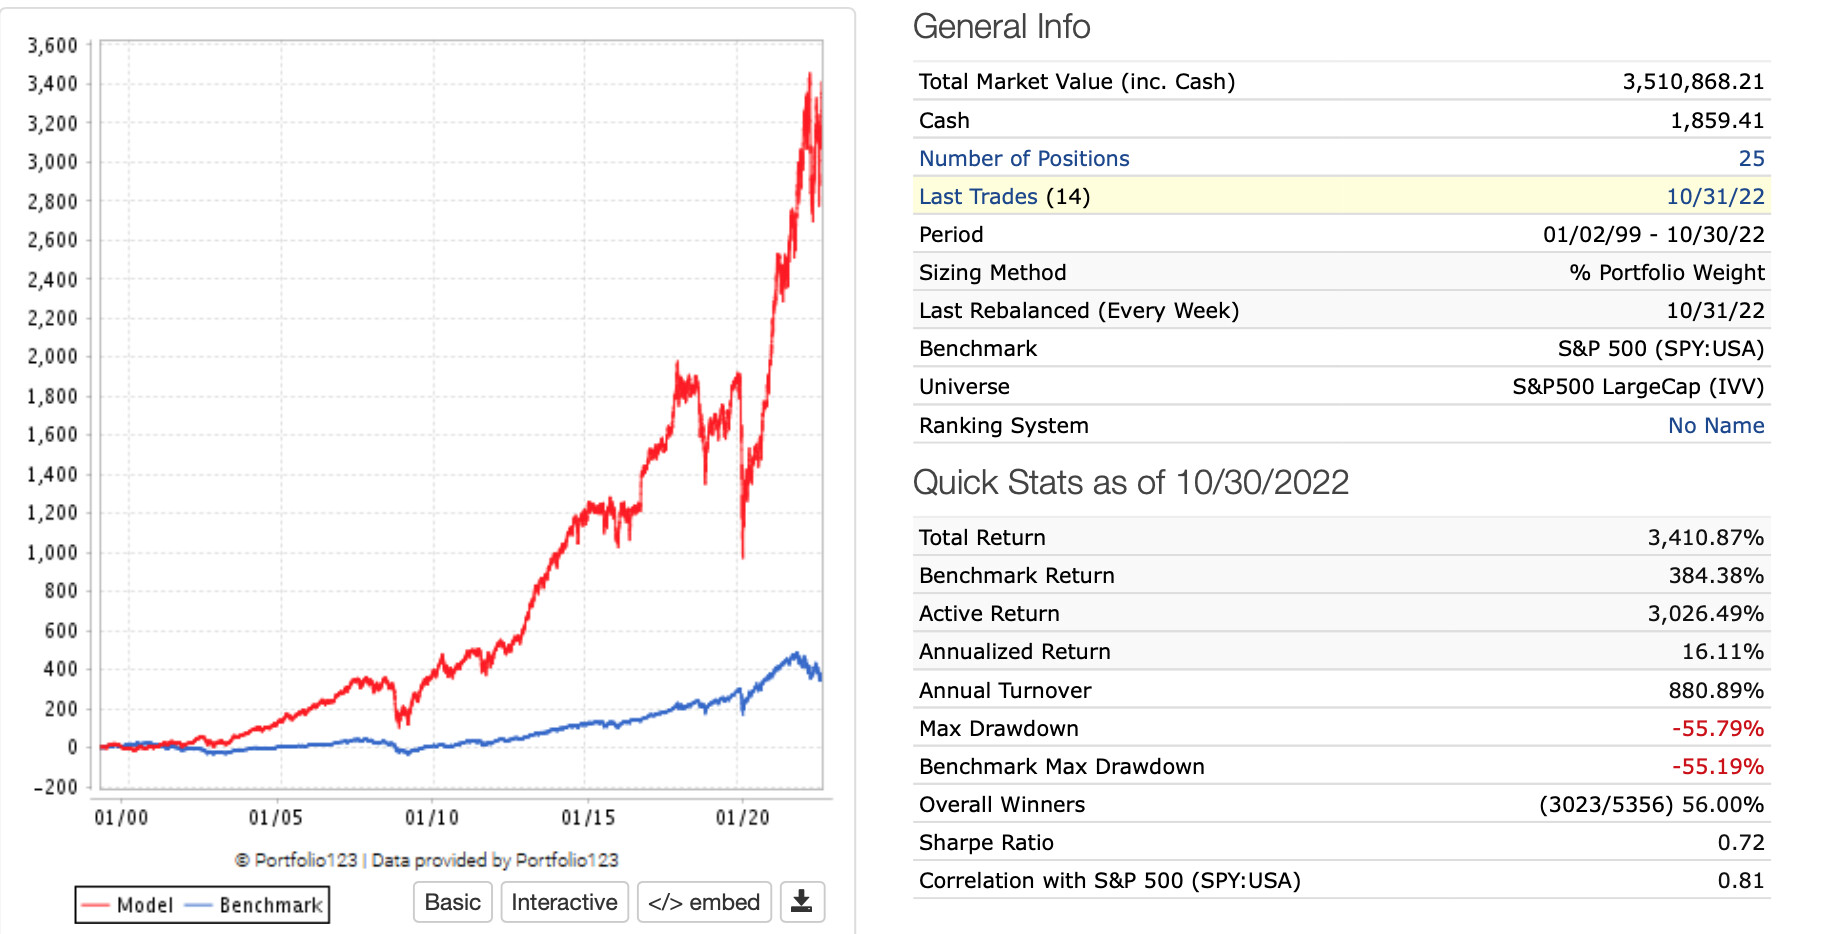
BTW for each of the sims above I used the sell rules RankPos > # positions. I.e., 15 stock model was RankPos > 15, 25 stock model sell rule RankPos > 25 Etc.
I might be able to reduce the turnover by extending that. But because the transaction costs are smaller for the SP500 I am not sure that it would have much effect on the returns.
For the Easy trade universe making the RankPos a higher number does reduce both turnover and returns (by reducing transaction costs).
Honestly I do not really know what to think of any of this. This is a ranking system I am funding with essentially no true out of sample experience (different universe). I did make an attempt to cross-validate it but there is always some selection bias (of the factors) because there is general knowledge about what factors have done well. THE VERY FACT THAT THE FACTORS ARE AVAILABLE WITH P123 IS PROBABLY A TYPE OF SURVIVORSHIP BIAS. I did just changed the universe on a whim for this post. I am not trying to sell any ideas. And just to re-emphasize, there is basically zero out-of sample experience with this.
I will note this is not particularly good for avoiding drawdowns. On the plus side I would say my method is probably not particularly bad for overfitting, I THINK. But I will let you know when I have the data in 5 or so years;-)
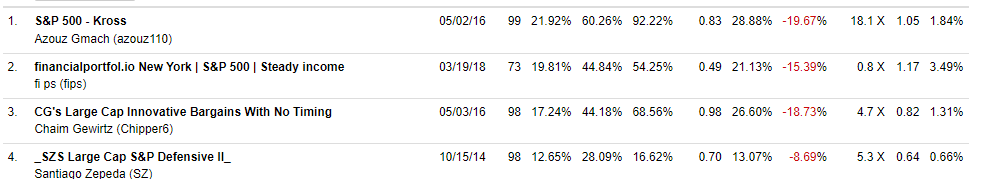
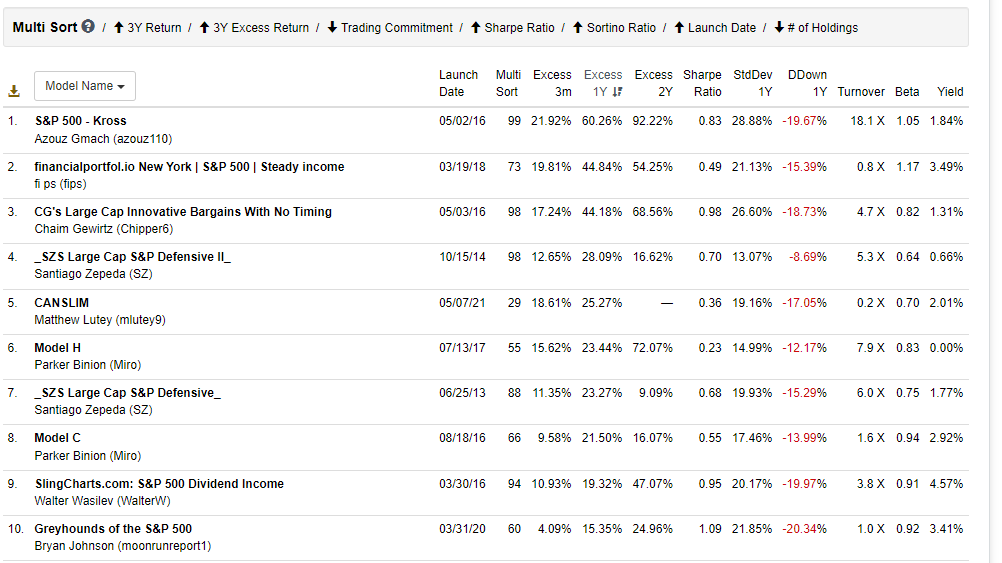
There are a few designer models that are Mostly large cap and they are beating the index. My guess is value is doing better than growth this year and probably will for the next couple of years. So it is possible to create a large cap system that beats the market. None of them beat the market every year but I don’t think that is possible if the models are tilted to pick value stocks. Time will tell.
To improve performance add this buy rule which kicks in when inflation expectation is high :
eval(close(1,##inflexp)>=4.0, rbics( ENERGY,NONCYCLICAL,UTIL,FINANCIAL) ,1)
and SecCount <=5 for a 20 position model.
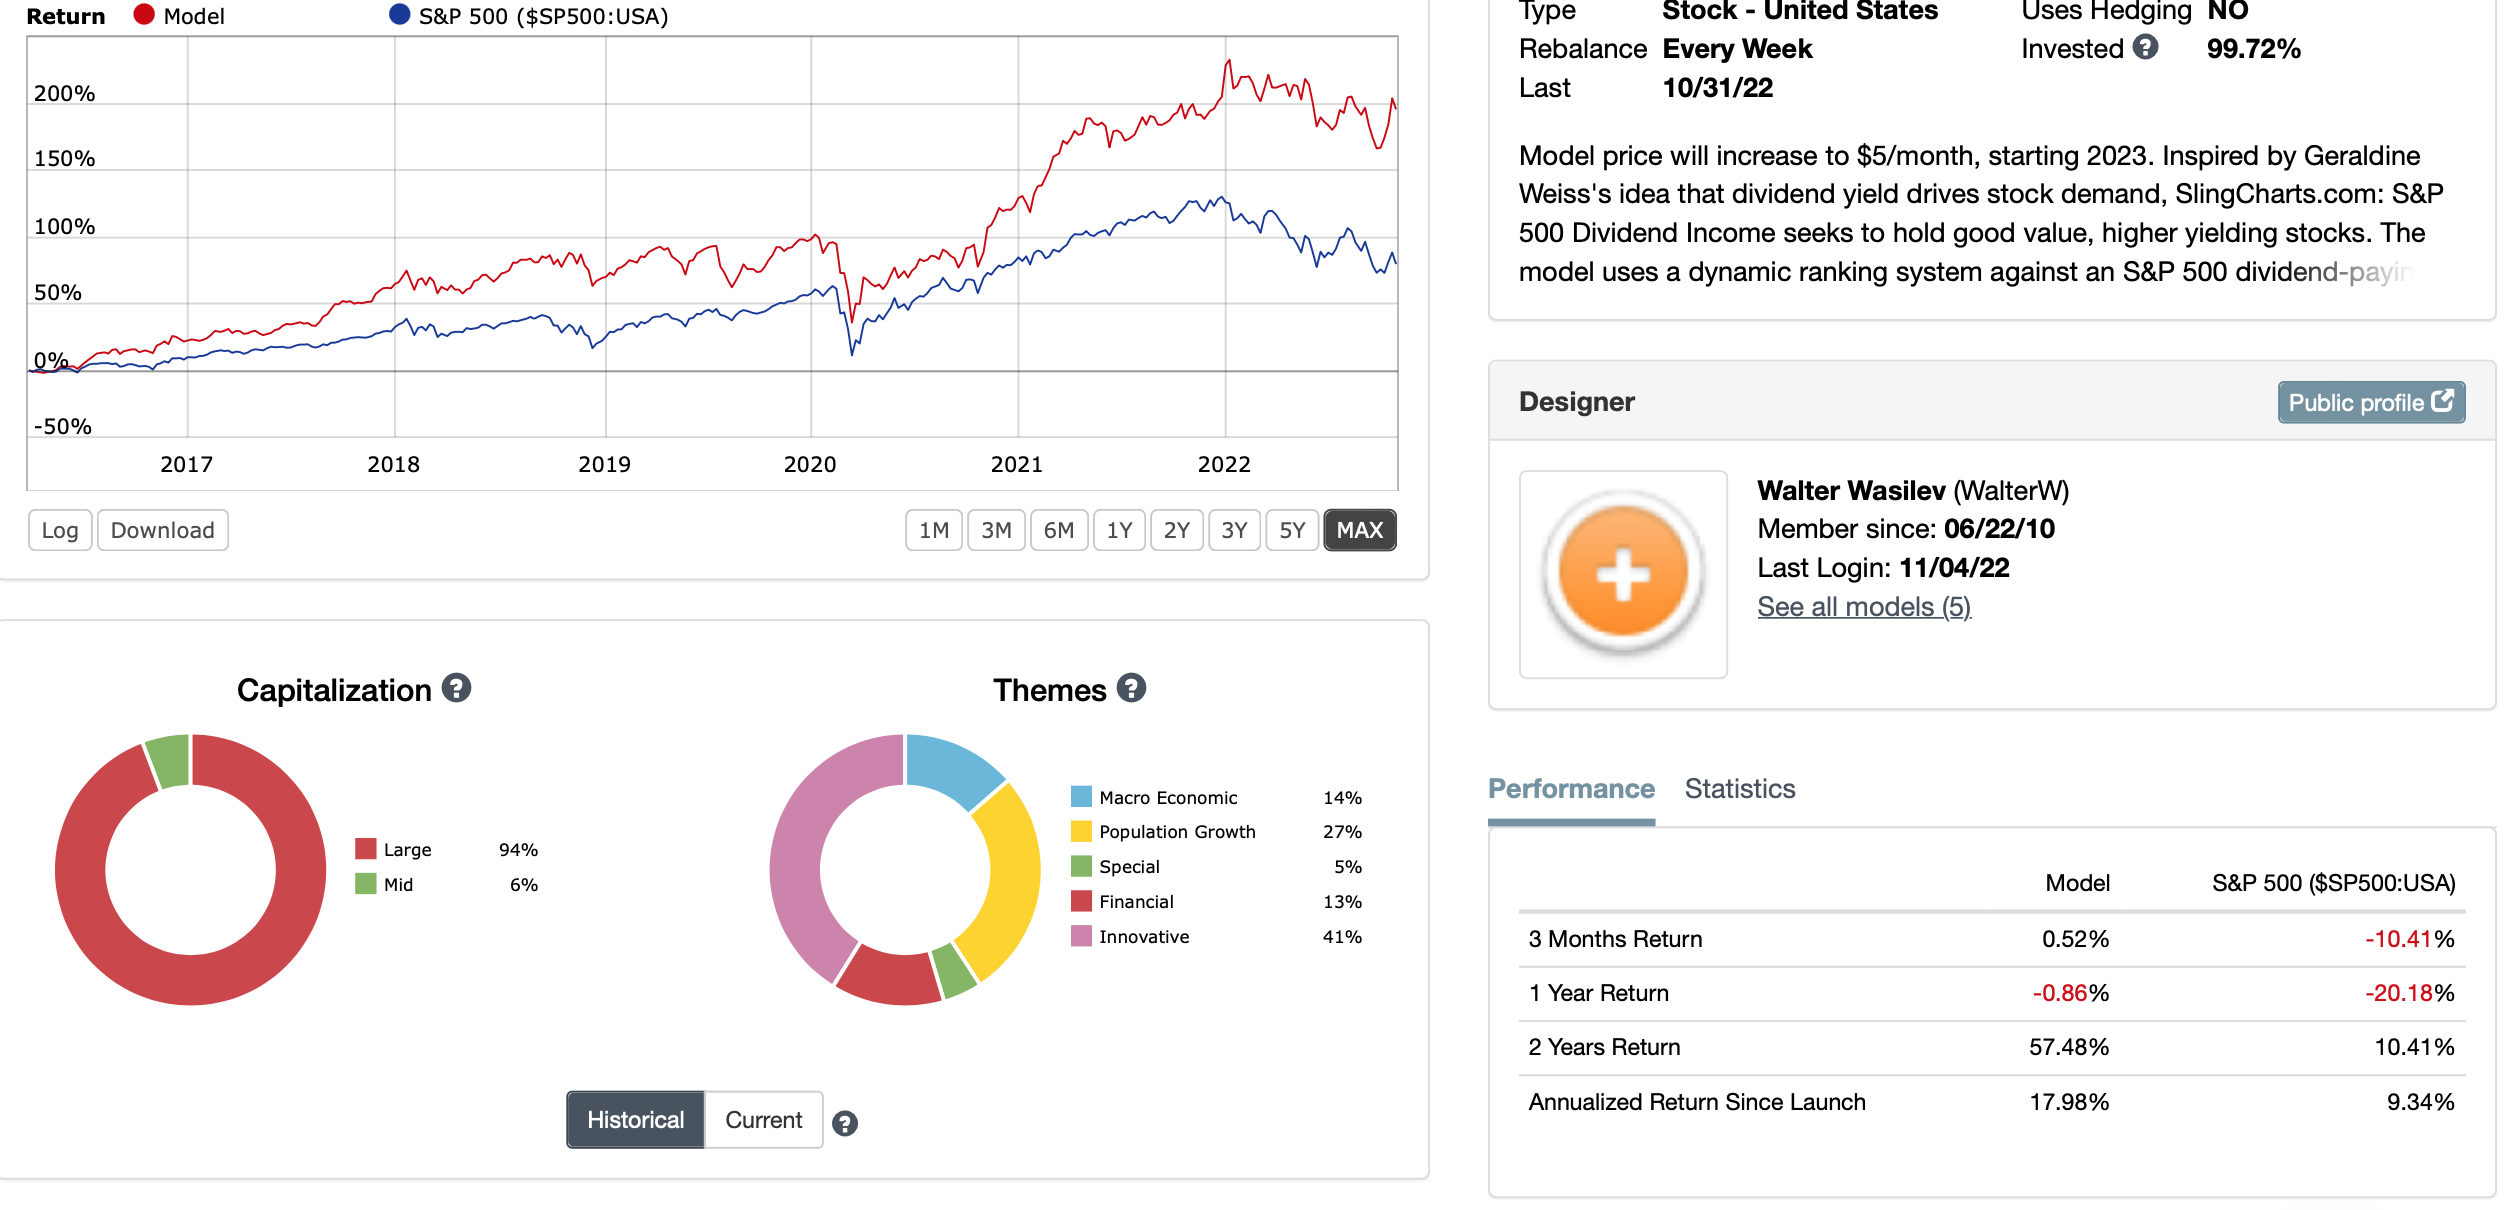
I had a friend that was paying Ken Fisher a bit more than that and he was not doing nearly as well.
Even if I ended up using mine (which I am not) for the SP500 universe I cannot imagine that it would be highly correlated to your model. If I were not using mostly ETFs to diversify into the large-cap space I would subscribe.
You SHOULD be able to upgrade your membership to any level you want if people are smart shoppers.
Congratulations Walter and everyone else with a successful large cap model. It’s good to see some Large Cap designer models beating the index over a multiple years. The next 5 years will be very interesting. Inflation is not going away.
There are several well-known strategies that work with large caps, ie Magic Formula, momentum, etc. If you’re in need of something else, I’d suggest compiling a list of the top 100 business brands, or category leaders, and overlay your favorite factors.
Have you considered the Expected Dividend Growth Model from the Manage tab? Trailing year it is 23% ahead of the Russell 1000. I’m using an equal weighted version as the comfort portion of my portfolio.
For a bit more spice, try playing with the Piotroski screen in the Expert series. It is a Value/Quality Screen which when paired with the Core: Growth Ranking System produces reasonable results. Trying various time periods and portfolio sizes (6-15) it indicates an alpha in the 5-11% range. Definitely helps to drop the first several offerings from the rankings when addressing the Prussell 1000 Universe. When compared to the Russell 1000, the Max Drawdown is somewhat less, but that conceals the Standard Deviation being significantly higher.
This screen does lead to significant sector concentration and regime transitions can be brutal, but overall turnover is low, but spikey as it is tied to earnings releases. It also can have less than the desired number of positions populated for extended periods of time. Which means establishing a policy to hold cash or spread the undercount position amount across the rest. (My policy is to hold cash for the undercount positions.)
One option is to combine both or multiple approaches to reach the diversity holding count desired.