Banks do not have current assets and liabilities. I know this to be true this time around.
Hi Paul,
Any update on this from the P123 perspective?
Thank you
Jerome
The investigation is ongoing.
Any news on this please?
We are still investigating. It’s not an easy problem, as it turns out.
So I think that I’ve tracked down the problem.
Let me lead off by saying what the root issue is: We’re not getting current assets and current liabilities totals for a bunch of companies. Meaning it’s in the data. Our AstCur and LiabCur functions just report what we get from CompuStat, and there are more nulls in those fields than I, for one, was expecting.
Here’s where I do expect them: Financial companies – just about all of them, as far as I know, though I’m no expert in financial-firm accounting – those companies that just reported and don’t have complete balance sheets available, and semi-annually-reporting companies (mostly ADRs) in the off season.
What surprised me is that some companies just don’t report current assets and current liabilities. The largest of those is GE. Look at the most recent SEC doc, and the balance sheet doesn’t have a delineated current asset or liability section. (That was the hint that got me over the finish line.)
And yet CapitalIQ gives a current asset line on its site. They calculate it themselves.
So I inserted an Eval into the prior equation:
LiabTotQ=Eval(LiabCurQ!=NA,LiabCurQ,PayablesQ+DbtSTQ+TxPayableQ+LiabCurOtherQ)+LiabNonCurOtherQ+DbtLTQ+TxDfdICQDump that into the screener as a not-equal-to test run today and 881 companies are returned. As I mentioned earlier in the thread, equalities are kind of strange because to the computer 1 is not equal to 1.000000000001, and we might get rounding errors.
So I changed that equality to a ratio and then searched for companies where the equation is more than 0.01% different. The number of companies where the above relationship doesn’t hold drops to three. (COGLF, INVH, and PLYA for the curious. And PLYA didn’t show up in an earlier test for companies more than 0.10% different.)
I don’t think that we’re going to change LiabCurQ or AstCurQ, because they are just database dumps. If you really, really want to correct for this, create custom formulas:
Name:CurrentLiabilities
Formula:
Eval(LiabCurQ!=NA,LiabCurQ,PayablesQ+ DbtSTQ + TxPayableQ+LiabCurOtherQ )I haven’t tested as extensively on the other side of the sheet, but this should work:
Name:CurrentAssets
Formula:
Eval(AstCurQ!=NA,AstCurQ, CashEquivQ+ RecvblQ + InventoryQ + AstCurOtherQ )EDIT: Aaron pointed out a slightly more elegant way of doing this, with IsNA. Also, I corrected a couple of other dumb errors. ![]()
Name:CurrentLiabilities
Formula:
IsNA(LiabCurQ,PayablesQ+ DbtSTQ + TxPayableQ+LiabCurOtherQ )Name:CurrentAssets
Formula:
IsNA(AstCurQ, CashEquivQ+ RecvblQ + InventoryQ + AstCurOtherQ )Thank you Paul for looking at this in depth.
I am of two minds regarding the database “holes”:
- On the one hand, I can understand why P123 does not want to start playing with database “dumps” at the risk of not knowing what is original vs. “backfilled”
- On the other hand, it is quite annoying that there are such gaps and I wonder how many other fields might have a lot of empty values (P123 is not at fault)
Suggestion: could you pls check with Aaron if you have an easy way on your end to do a run through the database for fields that are empty / N/A / 0, say for the PRussell 1000 companies (i.e. companies for which we should have pretty decent data). Anything that has more than 10% data missing probably shows a systemic issue of the kind discussed above.
At a minimum, I have learnt -once more- that before typing a formula in a ranking system or otherwise, I need to go and check what each data field looks like!
Thanks
Jerome
The difficulty in viewing the underlying data makes it easier to misinterpret data (or assume what is there). For me it requires putting data in a screen report to see when a calc is erroring out, and that requires (unless there’s another method) creating a custom calc and loading it into a screen view to see if it’s calcing as expected, or erroring out more than expected. It would be nice to put calcs directly into the screen report (or into some type of report) to make it easier to troubleshoot without having to hop around so much between different tabs. And often the screen report just isn’t the best way to view many columns of data, but I understand why we can’t export the data to excel for better analysis due to contractual limitations by S&P, but I do find this sometimes frustrating trying to “see” whether data is there or not, and what part of the data in a calc is causing a problem. Not sure what a good solution would be.
Coming at this from a slightly different angle: Why doesn’t GE report current assets and liabilities?
I have not followed the company closely, but the last I heard they had a financial division lumped in there. They might not be reporting current assets and liabilities because when it’s all consolidated they might still have to play by financial rules.
Many of the other companies that don’t report current positions might have something similar going on. I know that when I first started as a retail analyst in the late 1990s there were retailers who had their own consumer credit divisions. Back then there was a vogue developing for splitting everything out to minimize risk (and to offshore), so that number ultimately went down.
Now that offshoring is less in fashion and the interest rates are lower, I wouldn’t be terribly surprised if some non-financial companies have finance divisions hoping to make hay from those sweet, sweet credit spreads.
To be very clear, I just pulled that out of my butt.
But I don’t know, and so – and here we come back to P123 philiosophy – if I’m looking at the current position then it’s important to me and I want it to be a fairly normal situation. I would want to eliminate those companies that have veered so close to financial-company status that it’s affected their presentations or, for whatever reason, aren’t otherwise reporting current positions. That’s what CompuStat is doing. Furthermore, the CapIQ site that I check against is formatted to consistently display balance sheets.
I’m just saying that I would tend toward the accounting and auditing decision of GE that agrees with the analytic decision of CompuStat rather than what seems like a simple display calculation from CapitalIQ. So I’m not sure that I’d describe this as a data “hole”.
Data hole or not, it was unexpected by me. And since it took several weeks for P123 to explain, I think it must have been bit non-obvious to you guys, too.
For those serious about building strategies, the extra work to needed to understand a factor’s coverage is necessary.
Maybe we can call it a documentation hole.
Paul, I always knew you had a great . . . uh, let’s skip the metaphor. FWIW, you’re spot on. GE and many other companies don’t report current assets and liabilities because it’s not relevant to them. These situation, and others like them, are not data holes. They are the inconvenient and statistically irritating but in fact inevitable reality that the corporate world is not a singular monolith in which all data-points are relevant for all companies. Much can be standardized, and Compustat does an amazing job of it. But sooner or later, we all run into areas where standardization can’t go.
Thus current asset/current liabilities thing came under discussion because somebody got tripped up trying to do a uniform analysis on the database. Think of how many years this oddity has been out there (as many year as financial results have been tabulated, audited and reported) and not discussed. Now, imagine all the other oddities out there that haven’t been discussed only because nobody has – yet – done a study or something like that which bumps into them.
If you tackle REITs or biotech, you’ll find oddities that are at least as poignant if not more so but harder to spot because conventional data exists – its just that the numbers don’t mean what you might think they mean. Media companies are often like that too. Tech is a whole different class because the accounting rules that force companies to charge all of R&D against earnings in the period in which they were expended as opposed to allowing them to do what other companies do with less human but similarly future-growth-seeking expenditures (depreciate them over the expected life of the asset).
It’s important, if you aren’t well versed in financial statements and fundamental analysis, to manage your expectations.
P123 users have seen again and again and again and again that they can succeed using the tools and ideas we offer even without getting into the weeds of financial/fundamental analysis. But for that to happen, you’ll have to ease up and allow it to happen; i.e., refrain from approaching p123, the data and the tools with expectations of precision and uniformity you might import from other disciplines.
The following from British logician Craveth Reade sums it up: “It is better to be vaguely right than exactly wrong.” Or to paraphrase one of Paul’s former professors, Aswath Damodaran, Don’t got bogged down trying to be right (as if anyone ever could be). The goal is to be a bit less wrong then everyone else.
Marc,
I understand and agree with all this.
This said, I also think we need a better tool to have a look at the data before starting to plug in variables into formulas. Otherwise, we might get unexpected results which might look vaguely right on backtest but will fail at some point when using live money.
We can do it on the screener but it is very cumbersome.
I think this is what “Data Views” was intended for. But right now, it is not very helpful.
A helpful first fix which would still be a step change would be to allow us to select custom universes in data views (see screenshot attached).
Could Aaron maybe chip in to let us know how easy or not it is to implement?
Many thanks,
Jerome
DataView.pdf (60.7 KB)
I think that plussing up the single company views is he best way to tease out the nuances between “as reported” values and Compustat “normalized” values.
Plussed up financial statements, with all articulating items shown, with option for displaying different time periods and normalizations (e.g., TTM) over custom rolling time windows, are the easiest and best way to satisfy our information requirements.
The ability to look at this data cross-sectionally is not going answer your questions about the nuances, IMHO.
Plussed up statements shouldn’t be a lot of work for P123 since the bones are already built in the panels tool.
Please make this happen.
…
For those who are not familiar with concept, CompuStat should be using an articulating financial statement balancing model to ensure the primary financial statement line items aggregate properly. While Capital IQ analysts make exceptions to Compustat’s original rules, the normalization priced does a fairly good job at standardizing different reporting paradigms.
Do not expect this.
It would require a revision (and likely a very costly revision) to our data license. P123 is an investment modeling platform and whatever display we do is tangential to it.
What you seek is a full-blown financial data reference capability. Firstly, that is not our business model. Secondly, if it were, we would not use Compustat but would have instead prefer the Capital IQ offering (see data white paper in Help area). And thirdly, the chances of our expanding into the data reference area are slim to nil since it has not proven to be an attractive business for third-party providers; the only providers I know of who do it well are the data vendors themselves, who own the data and sell subscriptions to their own platforms. As to third party providers, there’s a severe mismatch between the costs associated with licensing, developing and maintaining versus potential for monetization via advertising (not even close) or subscriptions (not enough demand at the price it would take to do it properly).
I understand your desire for it. But there are times in the life of every business when it has to simply decline a request.
I also understand, from your profile, that you hope to launch an equity fund in the future. If you go down that route, you may want to consider subscribing to the Capital IQ platform (which is, actually, quite good), and take an entitlement to Compustat data with the full reconciliations you seek and/or Capital IQ data.
I didn’t anticipate that expanding the financial statements views by several line items would’ve resulted in an issue with your data vendors.
I’m sorry to hear that this is the case.
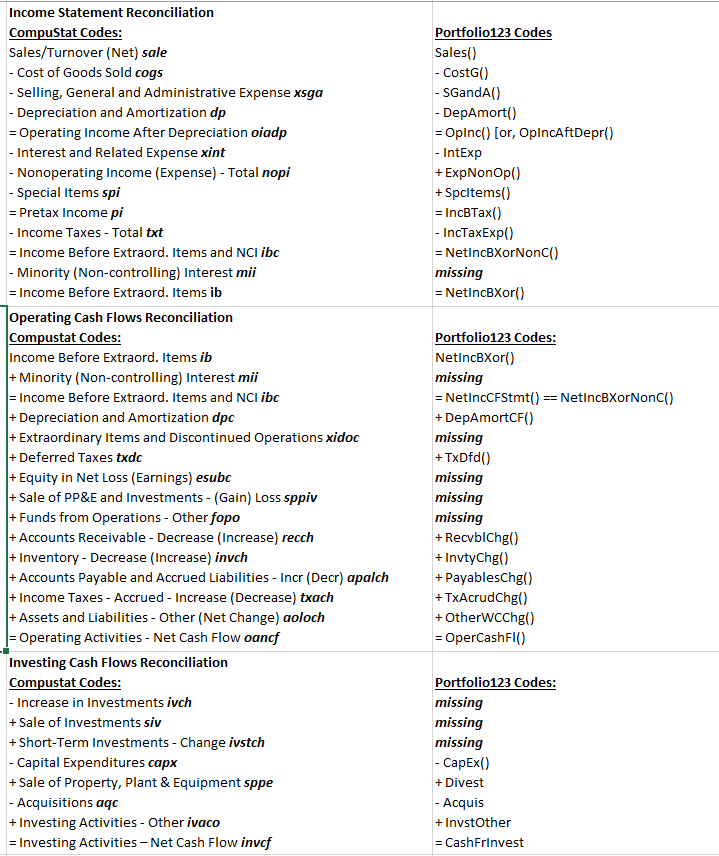
In case you decide to revisit this, I am attaching a snippet of an analysis that may helpf reconcile P123’s holding versus the Compustat’s articulating line items. In an ideal world, there would be a financial statement view to break out as many of these as possible. I don’t think anyone is asking for the supplemental data points, metadata, and footnotes that are included with a Capital IQ license. Note, that there are differences between quarterly and annual line items that affect this reconciliation.
I knew exactly what you are talking about. As noted, this is not part of our business model and not even in our radar for expansion. So it will not happen on Portfolio123.
That said, it’s clear that it is important to you. It may, therefore, be a good idea for you to look into the Capital IQ platform with a view toward subscribing. When I first mentioned it, I did so in the context of your indication, on your profile, that you may want to, in essence, become an institutional investor (that’s what funds are). And that is Capital IQ’s target market. But on reflection, I believe they are not strict about this; it strikes me as more likely an informal thing that arose out of an assumption that individuals would not want or play for the service. But if you want and are willing to pay, I expect they will work with you.
Also, as I recall, there were others who also expressed interest in this. Perhaps if there are multiple potential potential Capital IQ subscribers, a better subscription price might be negotiated. (From dealing with data vendors, it is our understanding that there is no formal price schedule – at least not a schedule that’;s shared with the outside word – and that everything is negotiable).
Let me know if this is something you (you, the singular user, or you, a plural group of users) would like to investigate further.
I am up to try getting a better price. The amount I was initially quoted for Capital IQ license was too high, but I would think again if I could I leverage collective bargaining power to reduce the asking price by one-half.
David, would you share the CapitalIQ quote? I’m not in the market now, but may be in a year or two. If you want to move the discussion off the forums, I could setup a private group.
Thanks,
Walter
I’m glad I found this older thread, as I have some similar questions on how total liabilities is calculated.
According to the balance sheet output on the “panels” screen, the formula for total liabilities appears to be:
total liabilities = current liabilities + LT debt + other liabilities
The first two factors are available in P123, however I cannot find a factor for “other liabilities” (only other non-current liabilities).
Take BIO as an example, according to the panel data, “other liabilities” makes up over 75% of total liabilities (3,231 / 4,109) , so it would be helpful to understand what it consists of.
Thanks,
Ryan
Ryan -
Total liabilities = current liabilities plus non-current liabilities. Non-current liabilities = long-term debt plus provisions for risk and charges plus deferred tax liabilities plus other (non-current) liabilities. However, for banks and REITs you add total debt and total deposits to the last three items, and for insurance companies you add total insurance reserves and total debt to the last three items; these companies do not have “current liabilities,” so that’s what you use instead. While we report long-term debt and other non-current liabilities, we do not report provisions for risk and charges or deferred tax liabilites or total insurance reserves or total deposits.
I hope this helps, but please ask other questions if not.