Wrapping up 2025, this marks my second full year investing with P123. It has been another great year filled with new insights, expanded knowledge, and strong portfolio performance. My biggest struggle this year was the "dollar implosion"; the USD lost 17% against my base currency (SEK). Despite this, my main account is up 35% (in SEK) with a Sharpe ratio of 1.93, averaging about 110 holdings across six strategies—one of which is an AI-driven strategy.
I am a big advocate of diversifying strategy and individual company risk by running many parallel strategies. However, I experimented with a single strategy of 20 holdings in one live account, which ended the year up 71% with low volatility. Naturally, this makes me tempted to concentrate my other portfolios as well.
The highlight of the past year has been running live AI strategies. Overall, the performance has been excellent, outperforming my traditional strategies. I don’t have isolated live account data to show yet, as these have been running alongside other “vanilla” holdings, but I have been tracking them collectively in a paper account to monitor accumulated performance as I allocate more funds.
There is still so much to learn about machine learning and data handling. As I progress, I can see that I made several mistakes while creating my initial AI Factors. I’ll need to go back and correct those this year, but even with those errors, the performance has been amazing.
Thank you to the P123 team and the community for a successful year and an amazing product!
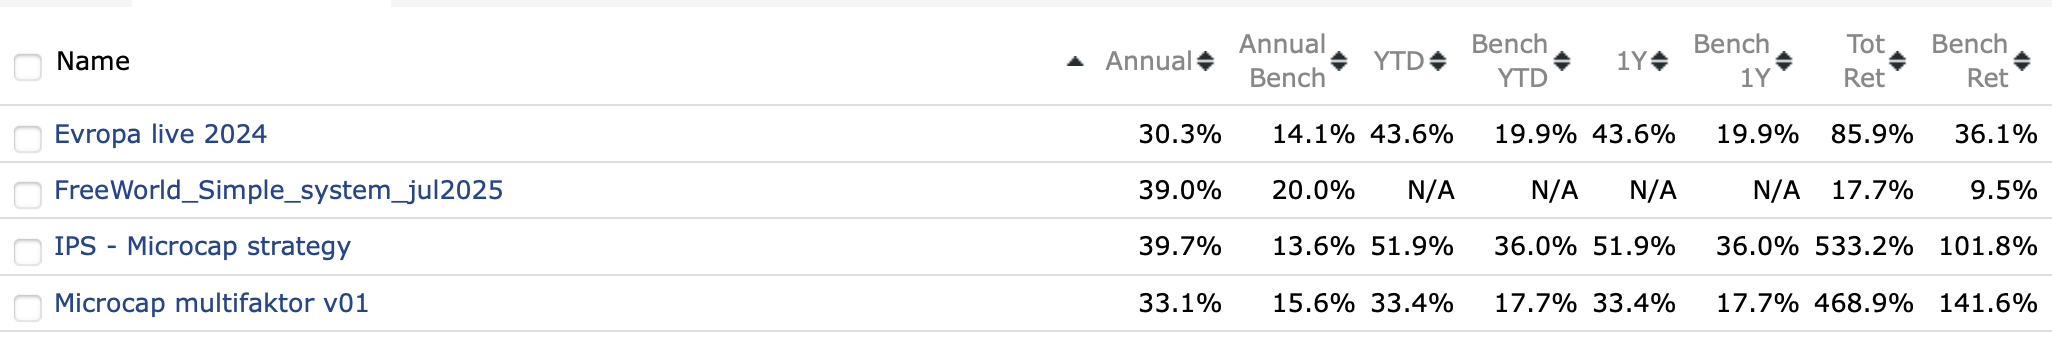
It was a pretty good year overall. “Microcap multifaktor” had a really bad year in 2024, good to return to outperformance. The “FreeWorld…”-model is currently just paper trading, the rest are live.
Thanks to the Portfolio123-team for keeping this great site running!
Congrats - these numbers are really impressive and Algoman’s too. for those of you who trade multiple strategies, how do yo think about correlations? And in general how much turnover are you ok with?
My hedge fund, Fieldsong Investments, was up 59.54% for the year. My private foundation was up 24.94%. Both of these use leverage and are hedged.
My wife's and my retirement accounts that are not invested in the hedge fund were up 34.59%. My kids' accounts were up 59.60%. These accounts don't use leverage and were not hedged.
Altogether I made $3.93M. And all of this was using Portfolio123 as the basis for all of my decision-making. Thank you P123!
I also manage two other accounts using Portfolio123 and IB. One was up 60.91% and the other was up 28.21%.
I’m a retail investor, I started my portfolio November 1st, literally pretty much at the top of the market for QQQ and SPY, though RSP has since done better. Rocky ride the last 3 months. Still finished slightly positive for the year, although barely, being beaten out by value, international, and RSP equal weight.
I’m also relying on a blend of Designer Models as finding a good strategy myself so far has been elusive, although I’ve read all of Yuval’s excellent blog posts.
Broadly, stories like these and the designer models available along with the stats really convince me P123 is a true gem in the retail space, there’s so much functionality on the site and I’m also really impressed with the wealth of information on each strategy that is provided, vs. a lot of other retail stock trading sites where you’re hard pressed to find concrete performance stats.
I’m looking forward to this year on P123, although apprehensive about the market tremors over the past 3 months. But, I do have a risk management strategy in place, so at least I’m not all in with money I can’t afford to lose.
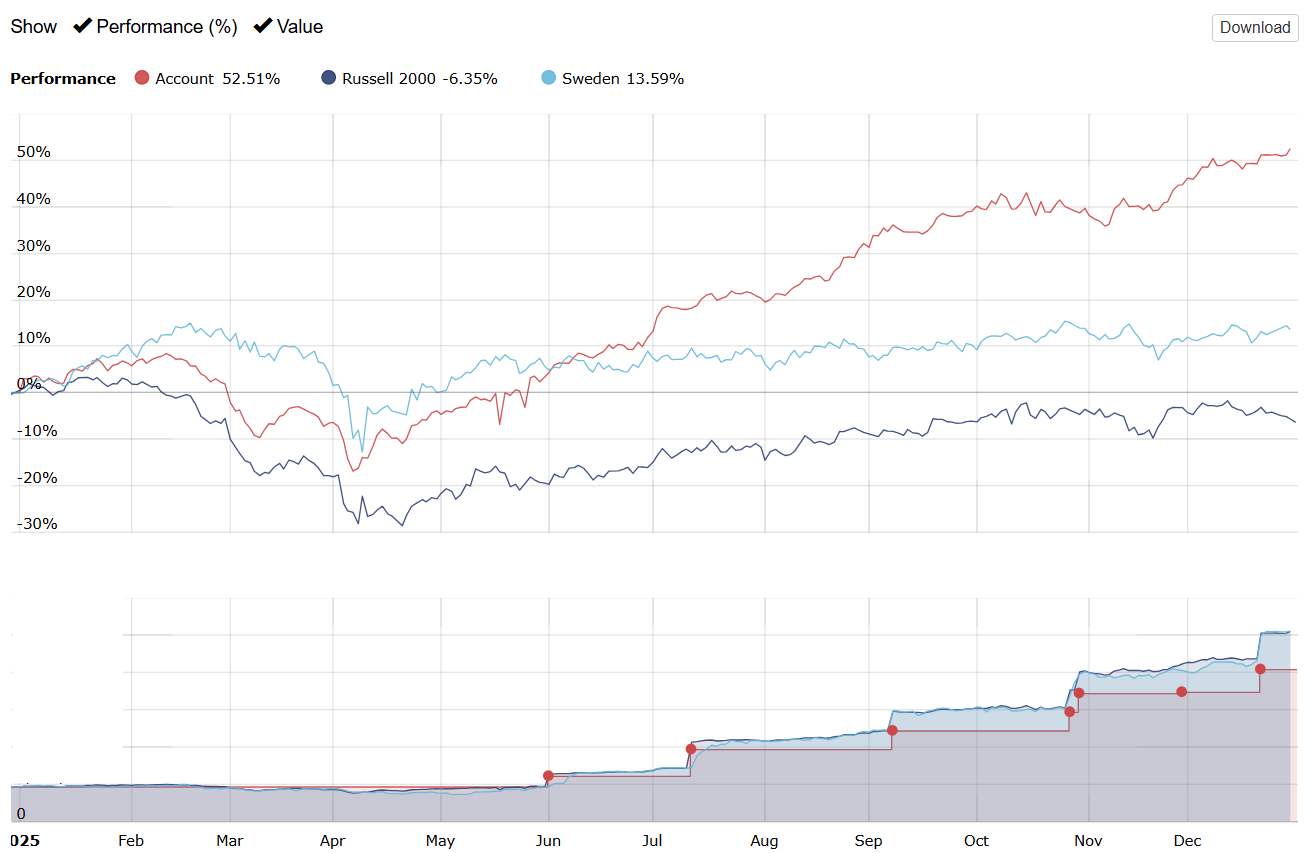
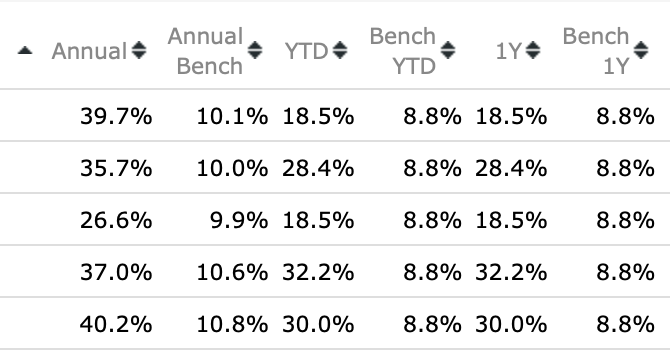
Well my portfolio uses P123 for idea generation but I do not directly trade every single idea. This year I was heavily invested in Argentina off the bottom (40% of my personal taxable account) and used options and leverage so it would not be comparable to include it here. That however leaves the door open for cherry picking so I calculated the ranking results for different portfolio sizes.
My ranking system I use for ideas with my custom universe which has all my buy rules performed as follows including ADRs:
I don’t worry about correlation among my stock strategies, but I have looked at that (with the 2 methods below).
Portfolio Visualizer allows you to upload P123’s return series and then do risk parity, Mean-variance optimization, Black-Litterman (a Bayesian method) and other methods.
I initially funded my ports at the risk parity level (including some ETFs). But I am a big believer in Bayesian Model Averaging. In this case: Multiplying my risk parity weight by the Bayesian posterior odds that my model is superior (then normalizing the weight of the holdings). For my prior odds I use a “prior” of 1 (or even odds) that my model is superior The posterior odds changed as I got more data. As my ports proved themselves out-of-sample, the posterior odds (and Bayes Factor) increased enough that including my stock models in my risk parity calculations no longer made sense.
I don’t think anyone else would have to use Bayesian Model averaging. I just have a lot of time on my hands
But I no longer do anything to address correlation of my strategies to give a direct answer to your question. Still, I do diversify and hedge with some idea of what my max draw down would be under extreme circumstances. I consider this to be my main risk.
BTW, Portfolio Visualizer can do Value at risk which I have never used.
PyPortfolioOPT can do this if you use Python.
The main problem with mean-variance optimization is that the historical returns cannot be depended upon. Even for great models there will be some regression-towards-the-mean and this cannot be avoided–making the use of historical returns a big problem and maybe useless. More in the weeds, the inverse correlation matrix used in classic mean-variance optimization is unstable. Some Python programs (including PyPortfolioOPT) have the option to use a Ledoit-Wolf matrix that is more stable, so there are methods to address this last issue.
Summary: If the cost is not too high I think Portfolio Visualizer can provide everything you need. You may need the more expensive tier to use their methods on your Ports. For people who use Python, PyPortfolioOPT and other programs may give you what you want, but I have never seen a single program that can do everything Portfolio Visualizer can do.
I don’t worry about turnover. P123’s variable slippage takes trading cost into account and may even be conservative. I believe the backtests show the trade-off between trading cost (and frequent trading) and holding a ticker too long. I just maximize returns in the backtest for my sell rule.
No, it is a system I created much later (like a decade I want to say). I am kind of apprehensive about sharing my model and have someone reverse engineer it somehow. I also feel it could create conflicts of interest. I could go back and calculate it for past years though
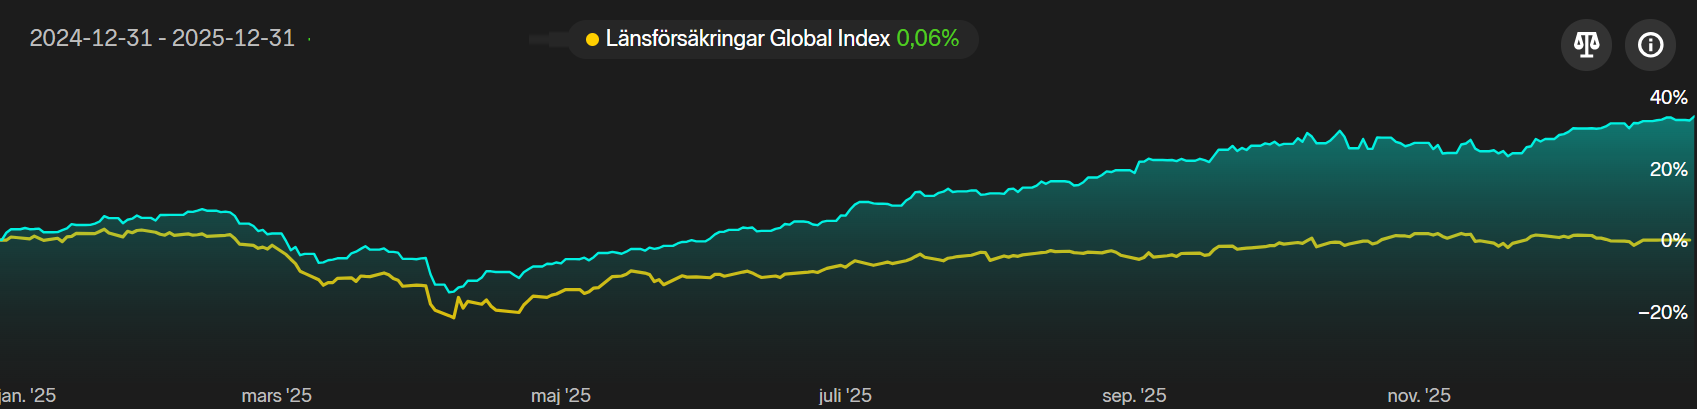
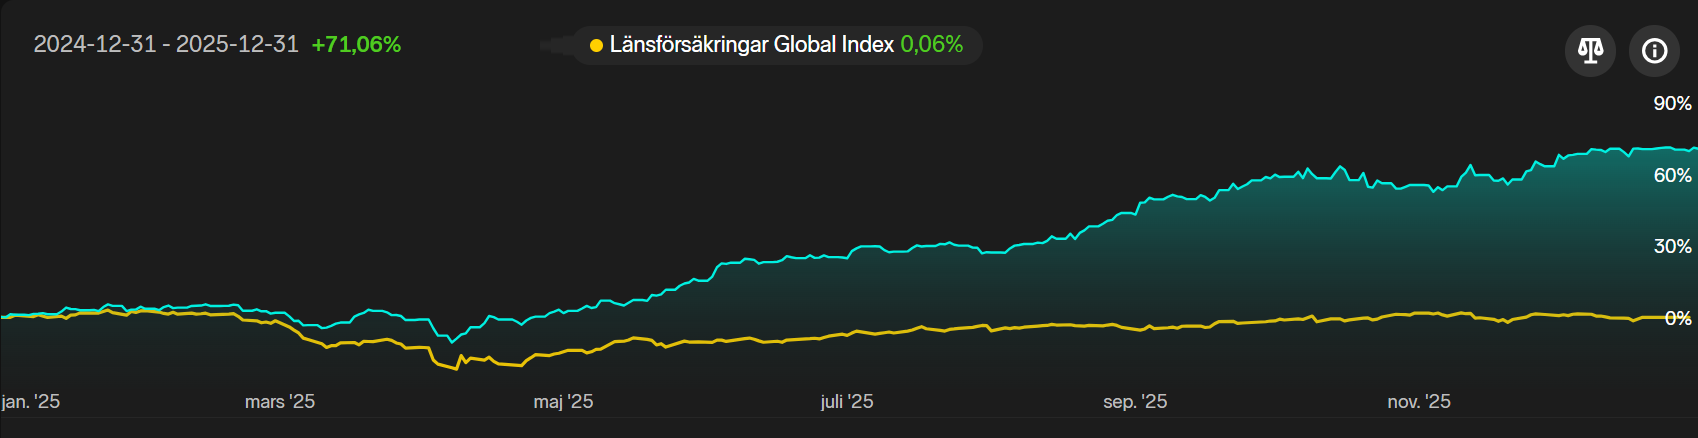
Guys, you're posting impressive results, well done! I had a tougher time this year because of the strength of my currency (the Swiss franc) against the dollar. I feel like a prisoner with a ball and chain. I'm ending with a gain close to 10% in CHF and a Sharpe ratio of 1.7 (I'm happy with this one because I rely on my investments to live, so risk management is crucial). In dollars, the result would have been better, around 22%.
@Algoman: well done, you achieved remarkable results with the SEK, which was even more popular than the CHF in 2025.
Noticing some of the currency discussion here: as a U.S. based investor, I’ve typically been closing out all non-USD currency balances after my models purchase foreign stocks (i.e., zeroing out the negative foreign currency balance).
Is this what most of you do, or do you generally leave FX exposure unhedged?
The negative means you borrowed it to buy the stock. If you close it you still have the exposure via the stock. I have some Japanese stock where I left it open though since rates in Japan were so low and still are
Edited as I think I expressed that wrong. If I leave the negative cash balance, I’m partially hedging the currency risk by being long the stock and short the currency. Was just curious if there is a consensus opinion on zeroing out or not.
Still early in the journey with Portfolio123, but after many hours spent learning, reading, asking questions, and refining ideas, I’ve started to see some encouraging results.
Current personal strategies (well diversified):
USA
Strategy 1 (higher volatility): +118% since May
Strategy 2: +51.7% since April
Strategy 3 (AI-based): +12.5% over the last two months
Canada
CAD strategy: +52% since May
Europe
Strategy 1 (more defensive): +14.85% since May
Strategy 2: +31.79% since May
Strategy 3: +26.31% since May
I missed part of the early rally in Europe, but in return avoided much of the S&P 500 drawdown during March–April. Still plenty to learn, and very grateful for the knowledge shared by the Portfolio123 and broader quant community.
Now… back to the lab — time to test some PCA factors and probably break a few things along the way
Moreover 2 Designer Models going well as well...with nice results (+33%, +41%)
Yes so if the currency falls your repayment will be easier and viceversa (assuming you keep the stock). I think a lot of it depends on holding period since most currencies are relatively stable over a few weeks. Would love to see more discussions on the topic. For me it depends also on whether the interest rate to borrow the currency I don’t have is low and allows for good real returns. For example when I borrowed the yen to buy wills inc the rates were lower than the dividend yield so I left that open and would do that again
Also conveniently, if rates are relatively low that currency could drop more too since if some of the popular currencies yield more the natural market forces can put pressure on the low yielding currency due to opportunity cost unless fdi is high due to high expected returns (not just fdi though but high expected returns in general) since it means theres no (expected) opportunity cost in keeping the currency despite the low yields
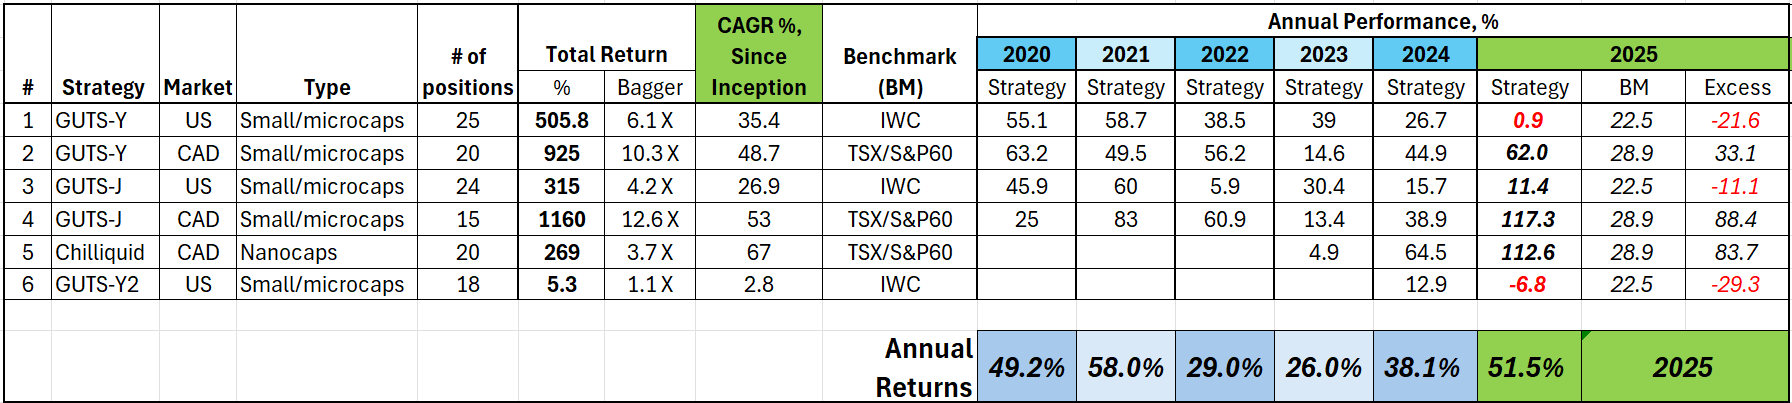
6 strategies across US and Canada, all microcaps. My Canadian strategies really outperformed this year. In general, Canada and Europe broadly outperformed US this year, so having Canadian exposure worked out, particularly with the commodity boom and some other big winners, i.e. ZOMD.
US strategies really lagged, which was surprising compared to their historical performance. That said, the stocks the strategies were finding were junk (in hindsight) - very poor performance after earnings, 25%+ selloffs very common after earnings, plus dilution, etc. No changes to the factors and weights since 2020 (for main GUTS strategies). I’d expect some performance decay, but it was a step change this year - my US strategies need an overhaul. Hoping to gain some insights thru machine learning and AI.