I made a screen public called example, it just shows Agilent's close 250 days ago as of May 11, 2023. The problem is that if I look back to May 2022, I can't find the value that close(250) outputs.
It outputs 115.3641, with 4 digits, suggesting it is calculated somehow... What is the calculation?
Historically (as in a backtest) future splits & dividends are reversed out. In other words historically it does what you'd expect it to do, which is use the price at the point in time.
CloseExDiv(0)/CloseExDiv(250) or Close(0)/CloseExDiv(250)
Close(0) and CloseExDiv(0) are always the same since there's no dividends to unwind at offset 0 (the present for a particular observation date).
PS. if you run a screen with CloseExDiv(0)!=close(0) you will get hits in the past due to miniscule round off errors in the internal number representation.
And what about all the per share and shares outstanding values, did you adjust those to make sense / reconcile with close(0)? EPS, analyst estimate eps, etc.
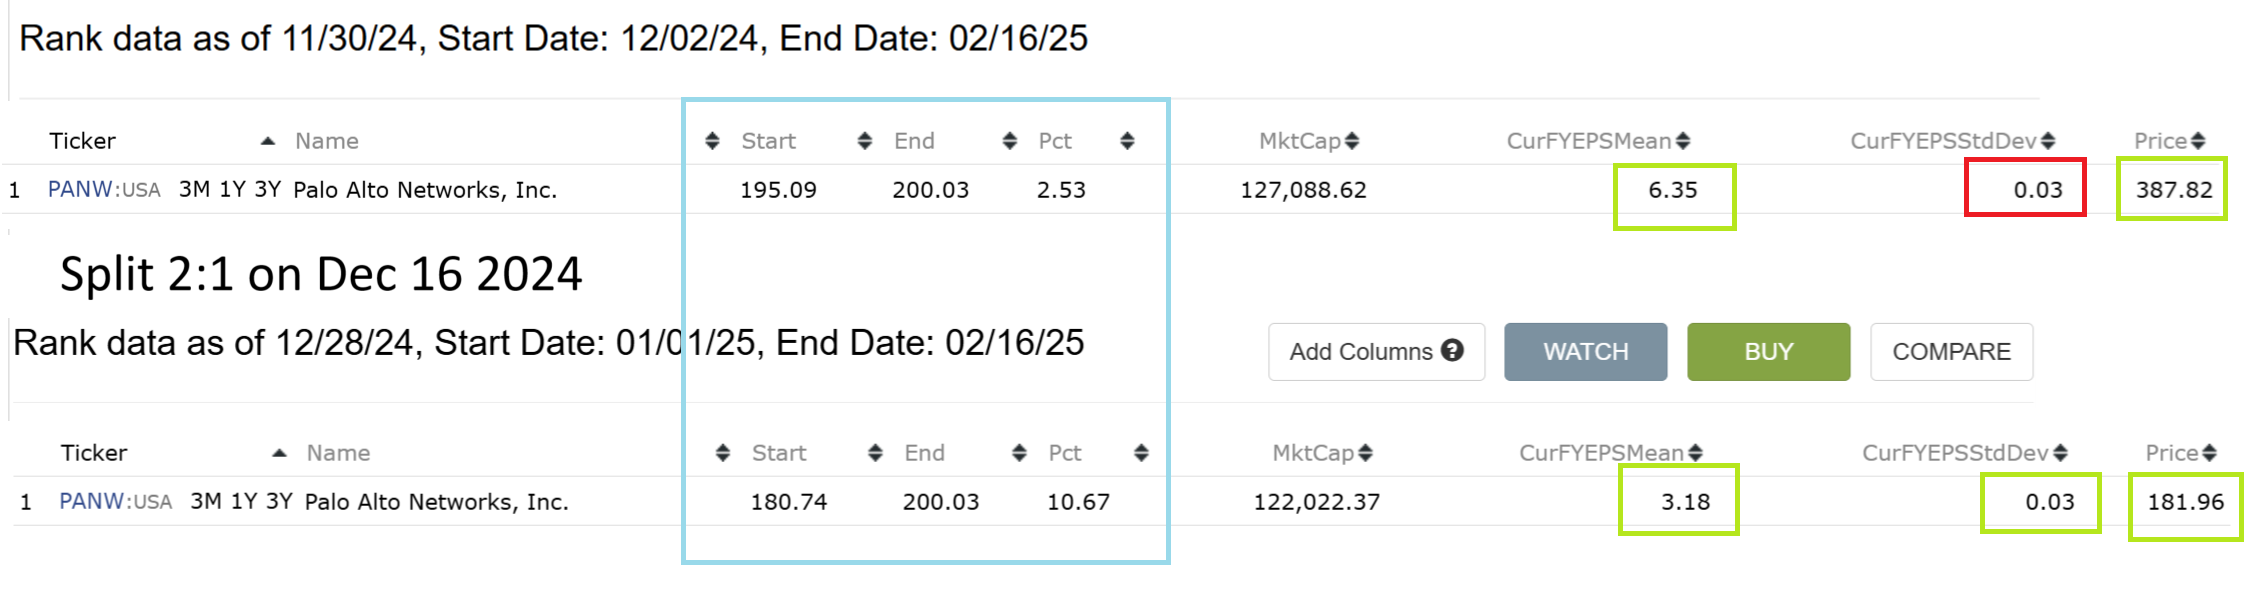
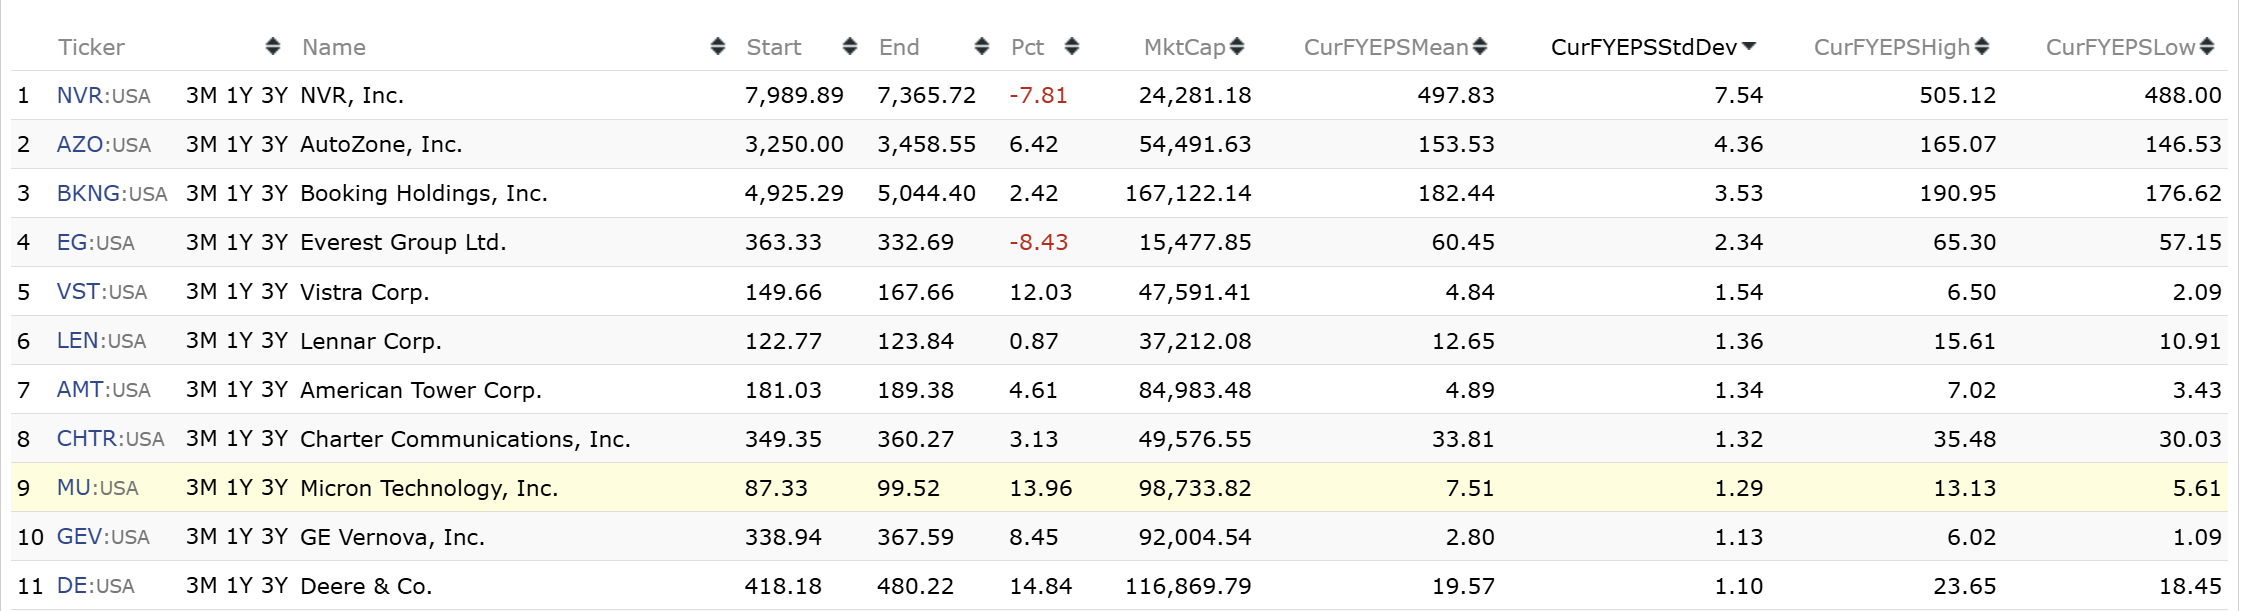
Doesn't look like CurFYEPSStdDev is done correctly, if you divide CurFYEPSStdDev by CurFYEPSMean it will be meaningless if the company ever did splits.
Also I'd recommend using ticker TNXP when dealing with this stuff - its had total reverse splits over hte years of something crazy like 1:10000000000 so it makes spotting mistakes very easy.
Marco, all the StdDev measures are absolute. RelStdDev measures are relative. I have written all my formulas to take this into account. For example, I use CurFYEPSStdDev / Max (0.02, Abs (CurFYEPSMean)), lower better, as a forecast dispersion measure. I hope you won't change one StdDev measure to be relative. Instead you could introduce CurFYEPSRelStdDev.
I think CurFYEPSStdDev compared to CurFYEPSMean is spurious any way you combine it. Its likely picking up on companies that will have reverse splits in the future (usually due to bad share price performance), so it will backtest well but it won't work live.
Its like comparing the actual past price like close(0) reflects, to the split adjusted past price - that would have look ahead bias, because you could figure out which stocks have lots of splits in the future (so share price likely to go up in the future) vs. lots of reverse splits in the future (so share price likely to do down in the future).
A good example is TNXP. If you look at the historical split adjusted prices, they're in the billions of dollars per share range back years ago. Knowing ony that, I can tell you with decent confidence the share price performance since then was bad because reverse splits don't happen when a company is doing well.
No. The problem is with the StdDev of split-sensitive estimates. There are only two: EPS and PT. These StdDEv are completely wrong in a backtest for stocks that have a split in the future of the observation date.