Just in time for the holidays: $2.99 Kindle sale on The Man Who Solved The Market through 11/26.
Dear all,
The performance of Medallion provided in the book is up to 2018.
Here are the performance up to 2022 (from public sources) and comparson with Berkshire Hathaway and S&P500.
Regards
James
| Berkshire Hathaway | S&P 500 | Medallion (after fees) | Medallion (before fees) | |
|---|---|---|---|---|
| 1988 | 59.30% | 16.60% | 9.00% | 17.65% |
| 1989 | 84.60% | 31.70% | -4.00% | -7.84% |
| 1990 | -23.10% | -3.10% | 55.00% | 107.84% |
| 1991 | 35.60% | 30.50% | 39.40% | 77.25% |
| 1992 | 29.80% | 7.60% | 33.60% | 65.88% |
| 1993 | 38.90% | 10.10% | 39.10% | 76.67% |
| 1994 | 25.00% | 1.30% | 70.70% | 138.63% |
| 1995 | 57.40% | 37.60% | 38.30% | 75.10% |
| 1996 | 6.50% | 23.00% | 31.50% | 61.76% |
| 1997 | 34.90% | 33.40% | 21.20% | 41.57% |
| 1998 | 52.20% | 28.60% | 41.70% | 81.76% |
| 1999 | -19.90% | 21.00% | 24.50% | 48.04% |
| 2000 | 26.60% | -9.10% | 98.50% | 193.14% |
| 2001 | 6.50% | -11.90% | 33.00% | 64.71% |
| 2002 | -3.80% | -22.10% | 25.80% | 50.59% |
| 2003 | 15.80% | 28.70% | 21.90% | 42.94% |
| 2004 | 4.30% | 10.90% | 24.90% | 48.82% |
| 2005 | 0.80% | 4.90% | 29.50% | 57.84% |
| 2006 | 24.10% | 15.80% | 44.30% | 86.86% |
| 2007 | 28.70% | 5.50% | 73.70% | 144.51% |
| 2008 | -31.80% | -37.00% | 82.40% | 161.57% |
| 2009 | 2.70% | 26.50% | 39.00% | 76.47% |
| 2010 | 21.40% | 15.10% | 29.40% | 57.65% |
| 2011 | -4.70% | 2.10% | 37.00% | 72.55% |
| 2012 | 16.80% | 16.00% | 29.00% | 56.86% |
| 2013 | 32.70% | 32.40% | 46.90% | 91.96% |
| 2014 | 27.00% | 13.70% | 39.20% | 76.86% |
| 2015 | -12.50% | 1.40% | 36.00% | 70.59% |
| 2016 | 23.40% | 12.00% | 35.60% | 69.80% |
| 2017 | 21.90% | 21.80% | 45.00% | 88.24% |
| 2018 | 2.80% | -4.40% | 40.00% | 78.43% |
| 2019 | 11.00% | 31.00% | 39.00% | 76.47% |
| 2020 | 2.40% | 18.40% | 76.00% | 149.02% |
| 2021 | 29.80% | 28.70% | 48.00% | 94.12% |
| 2022 | 4.00% | -18.10% | 19.00% | 37.25% |
| 30 years Annualized | 11.85% | 9.29% | 39.30% | 75.66% |
| 20 years Annualized | 8.96% | 8.41% | 39.47% | 76.05% |
| 10 years Annualized | 10.18% | 9.41% | 36.50% | 69.99% |
| 5 years Annualized | 8.94% | 10.33% | 33.93% | 63.57% |
The success with the Medallion Fund with futures might explain why 90%+ of the other futures traders have lost money. Futures is a zero sum game.
I do not understand…
1 million USD invested into medalion fund for 30 years should change into 34 trillion dollars
I guess their investment strategy works only with very small portfolio then? Like few million dollars and then it stops working?
It makes not sense to compare it to Berkshire Hathaway then.
Warren Buffet said himself, that, there is only 1000 companies in the world, it make sense for him to invest, and often he can not find any of them investable.
If you manage 0,5 Trillion of money, you need to find company where to invest at least 10 Billion, without affecting the company price much.
2 Likes
Peter66,
Based on my understanding (and according to the article/book), Medallion keeps its fund size cap at USD 10 billion (previously USD 5 billion) and it is only available to Renaissance Technologies staff only.
There is a capacity constraint on one of their main strategies, statistical arbitrage and they are already contributing to around 5% of NYSE+Nasdaq daily trading volume.
Like any strategy, there is already an alpha decay (as seen in the drop in annualized return in the past 10 years) as more AI/ML and quant players enter the space.
Regards
James
1 Like
Dear all,
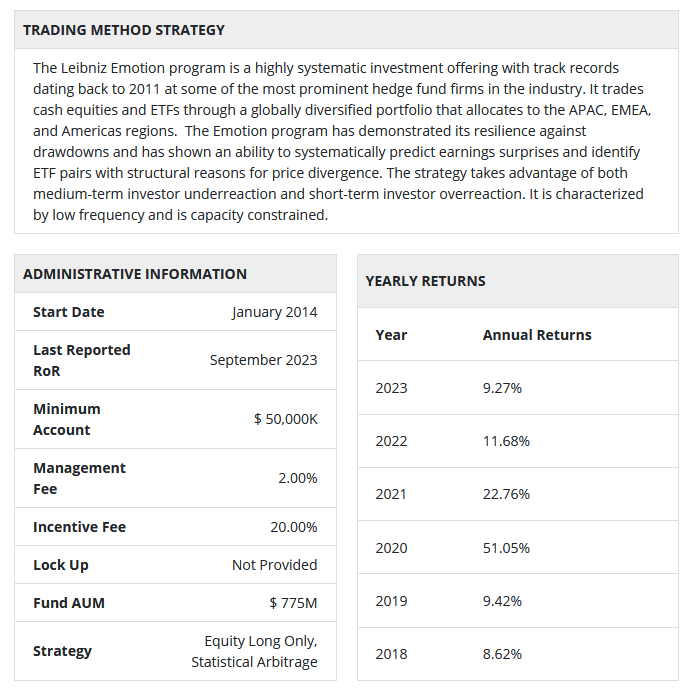
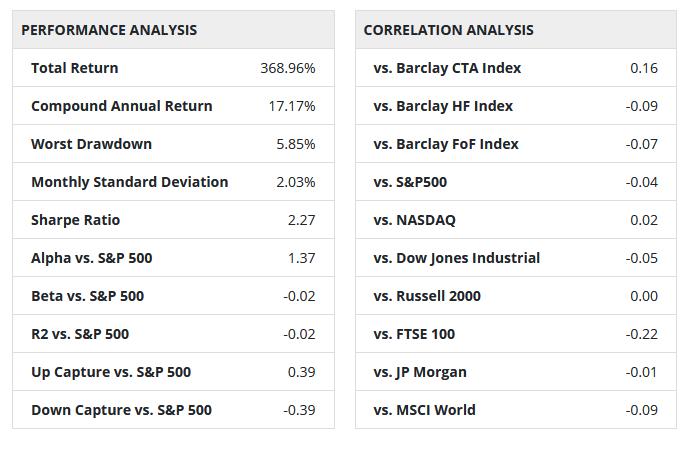
One of Medallion main strategies, statistical arbitrage is difficult to setup and do even for hedge funds. Statistical arbitrage if done correclty gives reasonably high returns and high sharpe with low max drawdown.
Here are the performances for Leibliz Emotion, the only statistical arbitrage fund in the latest top 50 performing hedge funds report. It has a long term sharpe of 2.27 and MDD of 5.85% since inception in 2014.
Regards
James
Where are you getting your hedge fund top fund reporting? I have found that info to be elusive to track-down publicly when I have looked for it in the past. I have to imagine that the CTAs did very well in 2022. 2023 could be a mixed bag of different types of funds.
Brian,
I got the hedge fund information from a hedge fund database which contains most of the existing hedge funds.
The performance of some of the largest hedge funds are obtained from an annual 50 top performing hedge fund report (otherwise only available from Bloomberg.)
Regards
James
Dear all,
In case, you didn’t get the book from Amazon.
Here is a detailed review of The Man who Solved the Market by Hugh Christensen, someone in Amazon Leadership.
Regards
James
I'll be reading this soon to get some inspiration for future tools. Obviously, even if we had all the necessary tools, replicating their strategy is simply not possible for most P123 users. Whether it's the leverage required (anyone know what their leverage is?), capital , or time commitment. P123 is first and foremost a tool to implement relatively simple to follow, rules based long strategies.
However we do want to start adding more "hedge fund" tools to do long/short for example or stat arb. From the excerpt of the review below, what do you think is a low hanging fruit for P123? For example the very first thing mentions "Lots of data". This is not simple and costly for P123, but what we can do is allow users to more easily import lots of data. We have planned an upgrade to Imported Stock Factors for example. What's else is missing in our toolset to more easily implement some strategies they use?
Cheers
General Themes/Observations from the Book
- Lots of data. As much as possible. Data mine first, ask fitting questions second.
- Lots of asset classes
- Lots of categories of signals, with lots of signals in each category: Trend, Mean reversion, Pairs, Seasonality, Factors (fundamental), Factors (mathematical), Correlations (lead/lag), Autocorrelation
- Sampling targets (eg returns, volume, etc) to small windows to reduce exogenous effects.
- Lots of small bets
- Single framework for all asset classes and all signals. Optimize and risk manage this. Easy to add/evaluate the effect of new signals.
- Bet sizing
- Ranking signal strength using pvals
- Use of leverage
1 Like
Pairing of stocks using cointegration. E.g., pair a stock in the top decile with a stock in the bottom decile bases on cointegration. Not a difficult formula which is now provided in Portfolio Visualizer. Anything else would not be accurately referred to as “stat arb.”
I think it would work but have not been able to test it. One might also need to use some pricing data, match sectors etc But I believe one could find and EXCELLENT hedge and maybe be able to construct a market-neutral portfolio. So serious suggestion.
- Allow backtest equity options strategies based on fundamental factors
- Add benchmarks for all European countries (please add for PLN currency at least)
This would be amazing. I would pay good money for options backtesting, especially if it integrated seamlessly with my exiting P123 systems.
In fact does anyone know of someone is already offering this service?
Dear all,
If you take a look at the pie chart in the link below. You can see that the daily trading volume of cryptocurrency is fast approaching total US stocks.
I think adding crypto as a new asset class will attract a lot of new crypto users.
P123 currently has a set of decent technical indicators (although only up to daily frequency) which are useful for crypto traders and investors.
Regards
James
I’ve had a few discussions with funds and when it comes to long/short there are a few things they need to make it work in order of importance.
- Variable hedge ratio and not static % based on $ (e.g. beta neutral)
- Upload any equity curve as new asset (e.g. they want a short strategy to work well with their proprietary long strategy which was not made on P123)
- Allow leverage in book (100/100 is not possible as it will instead do 50/50)
- Hedge asset to be inversely correlated to a long book (probably need AI for this?)
Yes. With correlation and cointegration being similar.
They often use hierarchical clustering which is machine learning tool to find the pairs but this is more of a screening tool. Some require the same sectors. But the correlation is not hard. Nor would the cointegration be hard (or using the same sector).
In short, statistical yes. But not really difficult for P123, I think. (correlation and cointegration doable).
P123 could search lowest decile for a match and backtest.
Thanks.
Tony and Pitmaster,
This is an article from Bloomberg earlier this month on retail options trading that you should read before consider investing in options in US.
Regards
James
Options Trading Is Rigged Against Average Investors
Payment for order flow allows brokerages and big traders to team up against the little guy.
December 7, 2023 at 8:00 PM GMT+8
By Alex Yin
Alex Yin is a student at Stanford Business School and was an options trader for Optiver and Chicago Trading Co.
Not a retirement plan.
Would you gamble your life savings on a few hands of blackjack? Probably not. But as a former manager of options trading, I’ve seen amateur investors — encouraged by posts on Reddit and X of massive, easy overnight wins, and offers of “zero-commission” trading online — lose much of their net worth on risky bets.
What bothers me most is that some big trading firms are actually paying brokerages to take the other side of these trades, knowing they have better information than the small investors and so will profit big. These payments are known as “payment for order flow.”
In 2022, large trading firms including Citadel and Susquehanna paid a total of $2.9 billion to brokerages such as TD Ameritrade Corp. and Robinhood Markets Inc. to trade against their customers’ orders, according to SEC data compiled by Alphacution Research Conservatory. In short, they are paying for the privilege of taking advantage of the unsophisticated investor.
This is akin to a few Vegas casinos paying travel agents to send them droves of unsophisticated players. The travel agent, like a brokerage, is paid by volume, and so wants to promote as much betting as possible. Other casinos, like the trading firms that don’t pay for retail orders, would have reduced access to these profitable inexperienced players.
Trading by retail investors has recently reached as high as 60% of the total market volume in options, according to new research by Svetlana Bryzgalova, Anna Pavlova and Taisiya Sikorskaya of the London Business School, with dollar volumes increasing by more than 10 times in the last decade. (The firms I worked for did not pay brokerages for orders, but benefited from increased volumes in retail trading.)
And the surge is only accelerating. Last May, exchanges started listing options that expire on each day of the week rather than three days, and they have exploded in popularity. With the potential of making 50 or even 100 times your investment in a day, they are the cheapest and fastest way to potentially win big, the biggest dopamine hit available for sale on the exchange. According to research at the University of Münster, 75% of retail’s S&P 500 option trades today are of this variety.
For seven years I ran options strategies at large trading firms, so I understand that options trading can make you rich, fast. But even though many players claim a winning strategy, the vast majority lose money. I quickly learned that the small bettors tend to choose the worst investments. And the house always makes money.
Buying an option provides you the opportunity, but not the obligation, to buy or sell a stock at a certain price. Let’s say a stock is trading at $100, and you think the price will go up. You might pay $5 for the right to buy the stock for $110 at any point in the next six months. If the stock doesn’t reach $110, the option expires, and you lose $5. If the stock goes to $150, you make $45 on only a $5 initial investment.
If our model said an option was worth a dollar, we’d buy when the price hit 99 cents or sell for $1.01, collecting the invisible theoretical penny difference. We repeated this process with thousands of different options, every time a customer wanted to trade. Those small amounts added up to big ones.
Roughly a dozen other trading firms used similar strategies, competing to offer the best price to the customer. Collectively, we made up the house. This can be highly lucrative: In my last three years running the desk, we didn’t have a single losing month. Several other firms post equally impressive results each year.
The most important rule of market making: Not all customers are the same. Sometimes, shrewd hedge funds had better information than us and also had enough money behind them to move the market in their favor. Trading against them would be a losing proposition, so we avoided these orders.
On the other hand, customers trading small sizes consistently lost money. They had no informational advantage, and their orders could never move the market against us. Taking the other side of these trades was highly profitable.
Supporters argue that platforms like Robinhood allow everyday people access to profitable strategies. However, research at MIT indicates that retail traders lack enough private information to win. And according to London Business School research, buying $100 of the popular “zero days to expiration” options would cost up to $6 to $12 just to enter the position. Little surprise then that retail traders gave up an estimated $6.5 billion in trading cost between November 2019 and June 2021, even though most paid no direct commission to their brokerage.
What can be done to protect them? First, regulators should prohibit payment for order flow, creating a level playing field where all trading firms can compete by offering the best price.
Regulators should also continue to penalize dubious advertising practices that platforms have used to attract uninformed options customers. In 2021, the financial regulatory body FINRA fined Robinhood a record $70 million for “systemic supervisory failures,” accusing the company of allowing users to make riskier trades than they were qualified for. Robinhood continues to present the riskiest options — the ones that expire almost immediately — to the user first in the options trading menu, without any mention of their dangers.
How can retail investors beat these odds? As with blackjack, it’s generally best to avoid the table altogether. Or to deposit small amounts, understanding you are gambling, not investing.
For what it’s worth, here’s my own wish list.
- Formula-based slippage. Add the ability for users to create their own formulas for slippage in addition to the variable slippage formula that Portfolio123 came up with. If possible, formula-based slippage could be specified in both simulations and in screen backtests.
- Add a simulation endpoint to the API.
- Add some industry-specific factors.
- Include dividends in realized transactions and Manage performance.
- Enable buy-based simulations (sell the lowest-ranked stocks when new stocks pass the buy rules).
- Add stop button for sims, screen backtests, and ranking system performance tests. If a user makes a mistake he/she shouldn’t have to wait in order to start over.
1 Like
#5 and #6 look particularly appealing to me. I would also include an API hook for #6 so a backtest/sim could be stopped programmatically.
Tony
I agree with these 2, especially “Enable buy-based simulations”, I think that is how most investors operate… you make a sell when you find a new good buy to replace your position with.