Yes. The thread was started because a user noticed a difference between simulations run on different dates. The discussion then turned heavily toward the differences between live models and simulations. That’s what I was trying to address. I guess the next thing I should try to address is the issue of simulations run on different dates. But regarding those, we did have some issues recently with EPSActual (see https://staging.portfolio123.com/mvnforum/viewthread_thread,12490 ) which could be the culprit there: it affected a great number of FactSet estimate factors.
The change in data providers will, in my opinion, definitely change the performance of your models. When it comes to picking stocks to buy and sell, I’ve noticed a difference of between 25% and 50% between the holdings of my models depending on whether I’m using Compustat or FactSet data. For one thing, the data providers often rely on different analysts. For another, there’s a much larger universe of stocks to choose from with FactSet. For a third, the industries that stocks are classified in are very different. And some of the line items are calculated on different bases, especially for firms in the financial sector. Put that all together and you’re bound to see major differences between Compustat and FactSet models.
Thank you for describing how you selected the models you looked at.
It is not a lot of data but 3 month for ten models is about 30 months total, I think. It would take about two-and-one-half years for an individual to gather that much data on one of his or her ports. So it really helps.
The data looks good so far but I do not think there is a more important assumption to what we do. You might think about providing a larger amount of data when you can in the future in order to conclusively close this subject (on FactSet data).
It is not hard to paper-trade a port without ever changing it and editing it with opening prices. No slippage for the sim or the port and exclude preliminary data for both. I will try to help with the data that will hopefully put this to rest. There will not be any errors.
[b]Please let me know if P123 switches to using SnapShots. Are we using SnapShots now? Could that be why FactSet data looks so much better that CompuStat data? I think Marco has said he would use SnapShots for FactSet data in the past. He has used SnapShots for CompuStat data before, I believe (off and on).
P123 could stand to be a little more transparent on the use of SnapShots, IMHO. We are talking about investing real money for most of us and we pay a reasonable amount for the data. I do not think it is unreasonable to ask to be informed about the data.[/b]
I do not think there can be any reasonable conclusions comparing FactSet data to CompuStat data from this small study. If anyone wants to say the study was so small that nothing can be concluded I would not disagree.
But if one is to consider the study, I thought we might get a random sample.
But out of 196 models with data over the last 3 months we got 10 models for the FactSet sample. Selected on this basis:
Yuval had reasons for picking these models. Many of them good reasons. It is true that these criteria could be reasonably expected to put FactSet in the best light possible. So, for whatever reasons this non-random sample of Designer Models was used for the FactSet data.
But here was the selection criteria for ports using CompuStat data:
It does not seem that the CompuStat samples are necessarily 25 stock models as is the case for the FactSet samples. This is just one way the sample are different and non-random. There is no rational reason, whatsoever, to think the samples are similar. There is some selection bias.
I am not sure if there is a difference in the quality of the FactSet and CompuStat data at this point. And if there is a difference it is possible that CompuStat data is better–if I understand Marco correctly.
I think we are forced to conclude at this point that if our models are not 25 stock models (or not similar to the selected FactSet Designer Models in general) then the results for our models could be like what was found for the CompuStat sample.
You make your own judgement on the how the CompuStat sample did.
Let me quote some of Nisser’s post The full post is above (everyone should read it in full) and I am not trying to give any false impressions by taking anything out of context. I appreciate any correction or expansions from Nisser and I will put in the whole quote or delete it if he requests this. But I think it is excellent:
So before this tread was started I would have though that this problem with non-PIT data and possibly flawed backtests could not be a factor in the underperformance of the Designer Models.
Nisser did not convince me as much as Yuval’s data changed my opinion. Certainly flawed backtests cannot be ruled out as a contributing factor to Designer Model underperformance—as Nisser suggests.
The CompuStat data performed miserably in my judgement. And this study gives me no reason to think the FactSet data is better.
There are many reasons designer models are underperforming backtests. Change of regime, overfitted models, Non rational ranking hypothesis, etc.
Many of my personal models have outperformed their benchmarks. I personally thought compustat PIT data was good. The model I presented earlier was a model generated using CS PIT data, but the same model run today, gives degraded results. I usually use my own ranking systems and rank based buy and sell rules. The question I am trying to figure out is why? Too many custom formulae in the ranking? Differences between GICS and RBICs? Though I have not changed my model and it specifically asks for GICS, etc. The performance is still decent, but loosing 4% ann over 20 years is a lot!
I’d like to give you my philosophy and my story in order to put all this into some perspective.
I first started using P123’s ranking systems five years ago. I backtested very heavily. I quickly realized that if I ran the same backtest on two different dates I would get slightly different results. I shrugged and accepted that. It took me much longer to accept that a stock that was ranked #6 on one day could be ranked #52 the next day and then back at #6 the day after that. I’m still having trouble with that one. But I accept that no data provider can be perfect, or even close to perfect. For me, Compustat and FactSet both have strengths and weaknesses. I love the increased coverage we have with FactSet and the speed with which they process domestic preliminary reports. I love the PIT-ness of Compustat data, with their effective dates and the fact that they don’t overwrite preliminary data. I like the way FactSet classifies industries (RBICS) better than Compustat (GICS), and Compustat’s methods of standardizing line items I find a little more intrusive than FactSet’s. On the other hand, I think Compustat may take a better approach to depreciation and amortization (though I’m not positive). It’s a fine balance.
I backtest a lot, and heavily. It has served me well. I trade a lot, and I’m up 52% YTD; my five-year CAGR is 36%. But I’ve learned that backtesting has to be done smartly and realistically. I don’t focus on whether a backtest gave me an alpha of 25% or 30%, or whether it was 25% or 30% last week. I focus on what backtests can tell me about factor choices and combinations. I try to look at things probabilistically. If system A consistently backtests better than system B, it is more likely to perform well out of sample. Maybe not always, and nothing’s certain. But all other things being equal, it is more likely. And more likely is the best I can hope for.
So my advice is as follows. Don’t worry about the actual numerical returns your backtests get. Don’t try to maximize those returns because they’ll change from week to week. Instead use backtesting to compare systems, factors, and approaches. Design your strategy according to what backtests best over various datasets, maybe using various performance measures. And maybe mix in some elements of strategies that performed second best, just to be safe.
If you focus on whether your backtests are completely accurate, you’re missing the forest for the trees. They’ll never be completely accurate. They can’t possibly reflect the fills you’ll actually get. They can’t possibly reflect the quirks of future stock pricing, or the way factors go in and out of favor. The only thing that’s accurate is your actual trading returns, and even there, five years of real-time trading is a very short time and won’t necessarily mean anything regarding the next five years. I have a great track record now but it could all go to hell extremely quickly. Maybe over the next five years I’ll consistently underperform my benchmark. It’s entirely possible.
But is it probable? That’s the question I want to ask. I believe that you can maximize the probability of strong out-of-sample performance by using comparisons and robust methods (try to break your strategy and see what it takes to do so), by investigating companies and strategies as much as you can.
There seems to be an assumption in this thread that backtesting should aim for precision, and if it lacks that precision, we should look for that precision elsewhere. That we should look at backtesting scientifically. That we need exactitude, not vagueness; consistency, not variety; hard, firm answers, not further questions.
I believe that in the financial world, such thinking leads to overconfidence and overfitting. Personally, I would rather get a lot of surprises from my data than none. I would prefer that my data present me with questions in addition to answers. I believe that my models will be strengthened rather than weakened by being repeatedly tested on slightly different data.
Especially lately, because of the switch in data providers, we are finding a lot of things that need fixing. And the impact of those fixes is not negligible. Last week it was interest expense and EPS actuals (which also affected EPS surprises and other estimate factors). We’re looking at other things that need fixing right now. I’m sure we’ll find more in the future. So our data will never be static. It will always be getting better and better.
I’ve spent too long talking about myself now. As product manager at Portfolio123, it is my job to see that YOU get the highest quality data available, and that you are happy with the data you’re getting. I’m trying to convince you that you should be, but if I fail, please don’t hesitate to tell me so, and to urge me to do better.
And if you think you see some fundamental mistake in our handling of data, please continue to point that out. Bugs are always cropping up.
I’m very happy with the data. P123 data served me well in 2007 when it came from Reuters, served me well from Compustat and continues to serve well with Factset.
My work is not based on backtesting as I developed my system over three years from 1994 to 1997. It has performed quite well with few changes since 1997. For me its about the raw data.
It took me years to bring my system onto P123 as a live strategy. Time and again I would run into limitations that prevented me from performing one task or another. Over the years P123 evolved, and doing so finally allowed me to automate my system on here.
I still do most of the work in Excel, and my Live Strategies with auto balancing perform close to, but do not out-perform, my work in Excel.
All that being said, I am very happy with the data. I developed my system a long time ago so back testing is irrelevant to me. Clean data however is extremely relevant, and I believe P123 delivers very clean data.
For you backtesters, aka “curve fitters”, my advice is to think in relative terms. Screener is great, but the Ranker is where it’s at. In Ranking, the data is all relative, rather than in screener where it is pass or fail.
My first post in this thread was along the lines that Andreas’ differences in the sims was not large (although thinking more about it 5% over a long backtesting period in 2 weeks is not small). And I said something similar to Steve above. I said at the time that maybe rank performance might be more important.
And I admit that any errors in data affecting sims will also affect the rank performance tests. I was not very objective in my first post.
I admit to being swayed by the volume of concerns from P123 members—many are very savvy members with a great deal of experience. But it was Yuval’s data that makes me wonder the most.
I said it before and I will say it again: This is a small, poorly done study.
So at the end of the day I am still not sure and will not make more arguments either way until I get more data. I would not just be open to more data—I am begging for it.
But here is what concerns me most. Going forward we wont get more data. P123 prove me wrong on this, PLEASE.
P123 already took its shot with data to convince us everything is okay. It failed and there will be no more data from P123, I think.
Going forward we will be on your own checking the data for our own ports and sims.
Data on all of the models over the next 6 months or even data on all of the ports now could probably put this to rest one way or the other. We will not see that, I think.
We will not even get an answer as to how Snapshotting preliminary data affects our sims (using exclude preliminary data or not). Here was Marco’s comment on this:
I don’t think we will get a full answer on this. Maybe it is just me. Maybe everyone else understood this was happening, how it is being done exactly, and has a complete understanding of how this affects our sims and ports and the comparison of the two.
I am open to more information than Yuval’s small study. But going forward I think we will have to figure it out on our own if we think it might be important.
We will have to figure out, on our own, why Designer models still underperform their benchmarks by 24% over the last 2 years.
I feel sorry for anyone who has not curiosity about this. We can, I guess, listen to a bunch of anecdotal stories and accept those over the 196+ Designer Models. Believe whatever stories are being told at the time.
Maybe you will be told that the problem with your model (and most other models) is that you were not using the dividend discount model correctly.
Or maybe you will be told that you are overfitting. Maybe you accept whatever explanation is being given at the time with not questions. No questions at all, and you do not like others asking any questions.
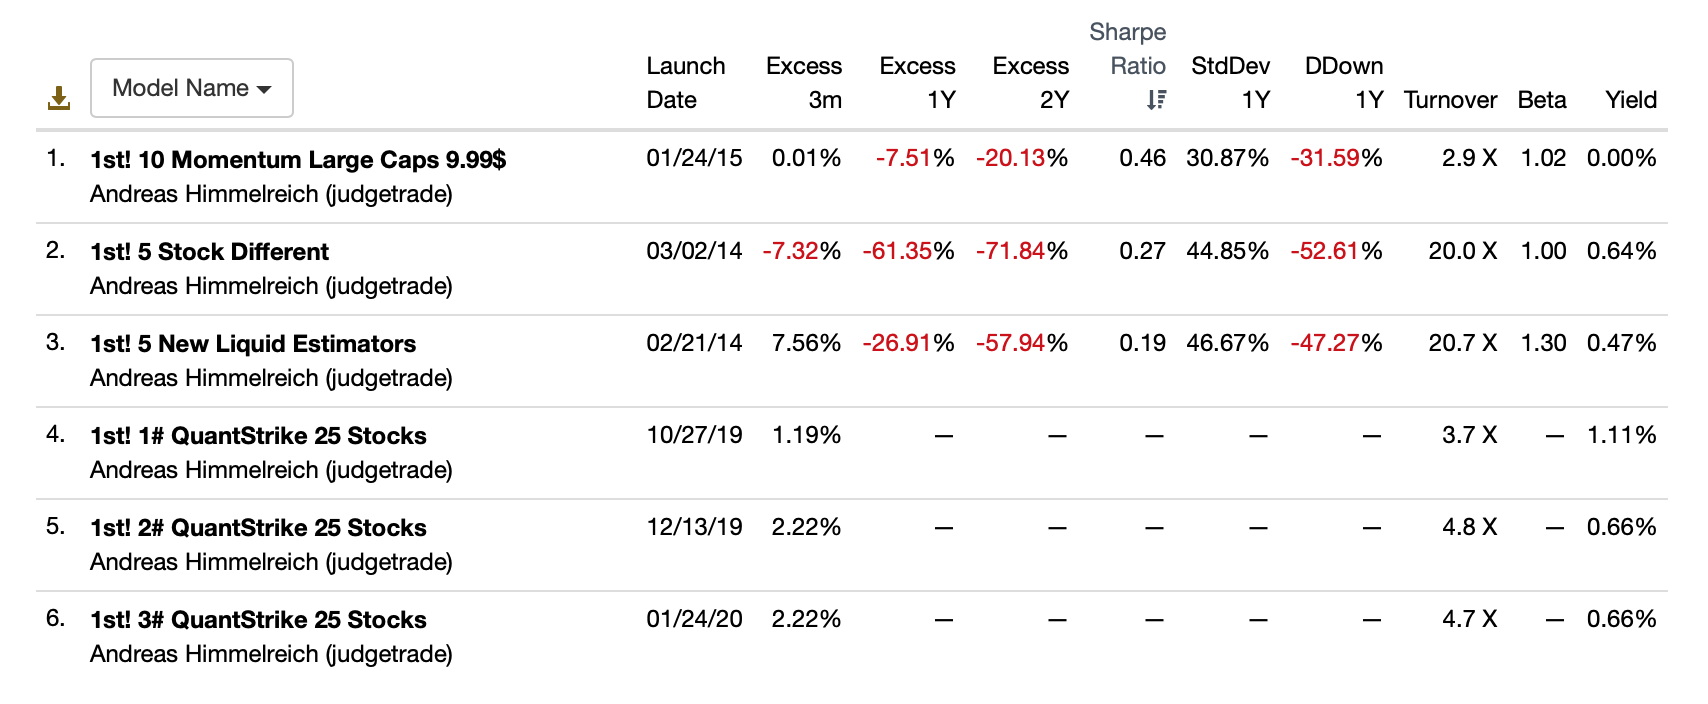
I have the most respect for Andreas (also Nisser, Chaim Brett and RT) in all of this. Every one of Andreas’ 6 Designer Models is underperforming the benchmark. And by a lot for those models that have 2 years of data (below).
He has an open mind and does not automatically blame himself. I think he makes good models based on sound theory. I am not sure it is all Andreas’s fault, myself.
He started this post just looking for some answers about the data.
Whatever my present thoughts are I have respect for Andreas, Nisser, Chiam, Brett and RT for asking some questions and looking for some answers.
Maybe Andreas is satisfied with the answer he got from P123. I cannot speak for him. But thank you Andreas (Nisser, Chaim, Brett and RT) for getting us some objective information on this.
I think it is Caveat Emptor and good luck going forward.
So I am left saying: More anecdotal stories please. They are entertaining and it is pretty much all we have.
@Yuval - considering the kind of results you are getting, would you be willing to do 1h “training” sessions for the relatively advanced users the same way that Marc used to do?
I am not sure what your exact background it (your profile seems to point to a being a writer but you have way too much Quant knowledge not to have done sth else as well). Many of us will surely benefit from your experience. I know I will.
I am conscious this could require some preparatory work but it could be minimized if caveated as “for advanced users only” and “not meant to be featuring pretty slides”. I .e. you could have one slide with an agenda and the rest could literally be running some demo screeners or orally explain your methodologies incl how your leverage Excel when P123 is not enough etc. This clearly would not be a basic training e.g. “here is how to write a rule in the screener”
You do not need to divulge your own systems. What is of real interest -and a recurring topic on this forum- is how you ensure that / test to make a system robust. For example, your post today above can effectively be your first (and possibly many more) session(s).
@others: what I noticed most of Compustat → Factset
Overall, all my systems (large caps) lost out in backtests i.e. [2%-4%] AR
This particularly impacted the Greenblatt ranker (or ersatz thereof)
This particularly impacted the financial sector as Compustat was doing some post-treatment to this sector (it also had the benefit of making this sector work for the Greenblatt ranker)
However, I spent the last couple of weeks looking at what could be done on GB with Factset.
Let me share some considerations here.
When you use the GB approach or any value approach, you effectively hope to find stocks that the market has wrongly underpriced. The value node will find low-priced stocks (relative to others) but many of them are low-priced because they should be. The other point for consideration is that when you search for “undervalued” stocks, it means that you have an expectation of growth and specifically of perceived risky growth - otherwise if there was no perceived risk involved, well, they would not be underpriced (for academic literature, look at Stephen Penman from Columbia Uni “The Value Trap: Value Buys Risky Growth”)
In summary, you want to find stocks that are underpriced relative to their potential in the close or more distant future, and that the required growth / business recovery is actually not as risky as the market thinks it is.
The GB value node alone is therefore very dangerous and will give you all sorts of junk. Adding the quality node gives you a degree of control over the riskiness of the expected growth (higher quality = less risk). But it is not perfect because if a stock ranks 99% in the value node and say 40% in the quality node, it might still make it in the top xx overall and into your port. Yet, in this case, it is likely undervalued because it should be: your expectations for the growth necessary to get the price back up is risky as measured by the relative low quality of the stock
So, I found I get better results by limiting the universe in which the GB ranker is “free to roam”. This seems to have a lot more importance with Factset data than with Compustat. I do not know why. Limiting the search space can be done in the starting universe i.e. “only high quality stocks per whatever measure you fancy” or with buy rules such as forcing “Rating(GB Quality only node) > xx% or Rating(P123 Core quality) > zz%”. You also need to add a buy rule like “Rating(GB value node) < 95% or 80% or yy%” thereby further reducing the risk that the expected growth is very risky and unlikely i.e. there is a good chance that the highest value stocks are such because there is a good reason for it even if you cannot put your finger on it. In other words, if you take a bet against the market and buy those stocks you are more likely to be wrong than right.
Delimiting the search space for the ranker is quite touchy though because if you are too strict, you leave no opportunity for the market to be wrong on the degree of risk. So you need to open up but not too much… For what is it worth, I found that to find 10 stocks via GB and Factset, it seems to work best if your “search space” is about 30 to 40 well-qualified stocks.
The above logic is of course relevant for Compustat as well but it seemed to be less “needed”. I do not have Compustat so can not confirm the degree of improvement if any.
And Yuval, while you are sharing your results (as you have already done above) could you tell us what data provider you use now? Do you use CompuStat or FactSet?
If you are willing to provide further information about the data to the rank-and-file members would you add some designer models?
If your designer models use CompuStat data could you run the same models going forward using FactSet (or vise versa)? I assume your license allows you to do so. I cannot as of today.
Switching to CompuStat is not off of the table for me. Actually, nothing is off of the table for me at this point. I am only interested in more information—doing whatever works to get more information.
I hope you understand that I would prefer not to have to run CompuStat ports and sims for the next 2 and 1/2 years before I find out that I wasted my $12,000 (each year) on CompuStat. Or find this to be true in a big way after using FactSet data for 2 and 1/2 years:
I honestly do not fully understand how “It does not make backtesting useless by an means…” should be interpreted with regard to how much value I would get for $12,000.
Thank you in advance for any information and data P123 can provide in this regard.
FWIW, I highly recommend going to Yuval’s blog and reading through all the posts (many of which are now being revised into P123 blog material). It’s extremely transparent. I currently appreciate the way he is currently going through the pantheon of classic investment books and breaking them down into P123-ease and showing results. I can also say that one of the ways that Yuval probably got his YTD returns is he didn’t sell off in the March panic or attempt to market time like most people did. How do you transfer a strong stomach in a tutorial? If you want the main culprit as to why DM have underperformed, I would say attempts at market timing which resulted in curve fitting is probably high on the list. I say this as someone who has chased the Holy Grail of systematic market timing for many years, and not immune to it’s allure.
I can understand if your goal is some sort of “personal research” in an academic nature, fluctuating backtests are frustration (as a longtime software developer I’m also pretty realistic about the fact that data is never static as bugs are fixed, processes improved, datasets are modified, etc. etc.). But if your primary goal is to make money, I find P123 to be an unparalleled tool.
The only Compustat-only-based live strategies I could find that have had NO revisions (not even to custom formulas) are the P123 live strategies. I can try looking around for more. But any study needs to have a goal. If the question to be investigated is “can the performance of live strategies be duplicated by simulating the same strategies,” I think the answer is going to be no, no matter which data provider you use. You can get somewhat close, but it’s hard to duplicate it. That was what I was trying to do in my small, poorly done study. Now if you want to suggest that I do a different study with a different goal, I can see if I can do it. I spent hours trying to figure out how to do this study, but maybe I didn’t spend enough hours, or maybe the study I did wasn’t what you had in mind. I’m certainly open to suggestions. But honestly, I did make an effort!
As for why designer models have underperformed their benchmarks over the last two years, I think the answer is simple. There are very very few models anywhere in the investment world that have outperformed their benchmarks in the last two years. Look, for example, at actively managed mutual funds. Over the past 15 years, only 37% of actively managed mutual funds have outperformed their benchmarks. Over the past one year, only 15% have outperformed SPY. I haven’t been able to find figures for two-year outperformance, but I suspect they’re even lower. 2019 was a terrible year for beating indexes. I’ve done well in 2020, but in 2019 I underperformed SPY by 14%, and underperformed most other benchmarks too. Almost all of our designer models use value factors, and we’re in the midst of a value reversal, where expensive stocks have been outperforming cheap stocks by leaps and bounds.
Data is imperfect. It can only get you so far. It’s rough and inexact and subject to change after-the-fact. What really makes a difference is how you use the data. All of our fundamental data and most of our estimates are based on accounting principles. It’s not raw. It’s not scientific in any way. It’s about the way companies report numbers that they’ve pulled out of their complicated accounting systems and massaged for public presentation. It’s hard for me to imagine any data LESS exact than that! So you’re starting out with extremely flawed data. The data providers are massaging it to some extent to make it more standardized. But this data has to be understood for what it is: the result of thousands of willful decisions by CFOs and their minions, all with different interests, proclivities, and psychologies. The only way to profitably use this data is to try to understand what it’s telling you. Backtests can help you with this, but only to a degree. What we’re trying to do here is to give you enough data, and accurate enough data, to help you do this. That’s the essence of it. But all the backtests in the world won’t help you understand how asset turnover, debt ratio, and profit margin can be combined to produce return on equity.
Can you tell us which provider is used for each of your designer models?
Marco seems to have some pretty strong opinions on the quality of data (CompuStat vs. FactSet). I do not have an opinion on this yet myself. Not an informed opinion.
But for people with a strong opinion (like the opinions expressed above by Marco and Quantonomics) would knowing which data provider a model uses be something Subs could look at? Maybe this is already provided. I do not subscribe to a model.
Just an idea/question. As I said, I do not have an opinion now. But the question of whether subs should be allowed to look at this if they think it is important aside, I would not mind being able to compare the 2 groups to get somewhat of an informed opinion on the best use of my $12,000 (per year).
That is real money for some people. And I could rent a pretty nice luxury car with that kind of money (or come up with enough money total to buy a small beach house/condo). I do not think this is a trivial question for most of the members.
For some people at P123 there may not be a choice and maybe they would not mind possibly being able to turn off the noise (and have some data instead) when people on this site tell them how bad their data is.
All my designer models switched to FactSet when P123 made the switch in late June and have been based on FactSet ever since. Prior to that they were based on Compustat data, like everyone else’s.
So I will bet anyone a dollar that the best comparison I can come up will show FactSet data to be at least as good as CompuStat (and CapitalIQ).
In case anyone has not already noticed the Designer Models are already ahead of their benchmarks over the last 3 months. While over the last year the Designer Models trail significantly.
I will bet that the year after switching to FactSet data looks better (mean excess returns of all of he models with complete data) compared to the year before using CompuStat.
Hard to do worse frankly. And I will actually be up $12,001 over the CompuStat crowd if I win (so not too embarrassing for me). Yeah, I will take that bet.
Yuval, I suspect you might agree that the trashing of FactSet data without evidence could be a mistake. Maybe you do not agree, but I do think P123 did a good job on the FactSet data and I would like to learn more about that data (as illustrated in my above posts). If you are not particularly fond of the FactSet data I would be happy to take a dollar bet with you.
I am just looking for some real data on some of this stuff. And I am willing to bet that some of (a lot of) what we think is true or are told is true is not. I do not claim to know ahead of time where we are wrong. I would like to be exposed to enough data to eventually find some of the things I have been wrong about.
For those who already know the answers, I will take your bet.
I agree, one should not fixate on numbers, but rather on construction strategy. However, given that one thinks it was done thoughtfully, the discrepancy in returns is disconcerting.