“Or at least backtest situations where they have an advantage and discard any models that do not work in that situation?”
In my opinion, simulation is meaningless for intraday trading. HFTs will run circles around your orders.
“Or at least backtest situations where they have an advantage and discard any models that do not work in that situation?”
In my opinion, simulation is meaningless for intraday trading. HFTs will run circles around your orders.
Daily fundamentals. Thx!
Marco _ i believe that tensorflow may be appropriate for image recognition and in fact would be a very interesting way to go. I would also consider Point & Figure Chart patterns which are quite useful and easier to process.
I would suggest the following:
(1) Cup with handle
(2) head and shoulder + inverted h-a-s
(3) Pennant
(4) Flag
(5) basing (not sure of the technical name but a stock that has undergone a big decline and then has flattened out or is basing).
(6) double/triple bottom/top
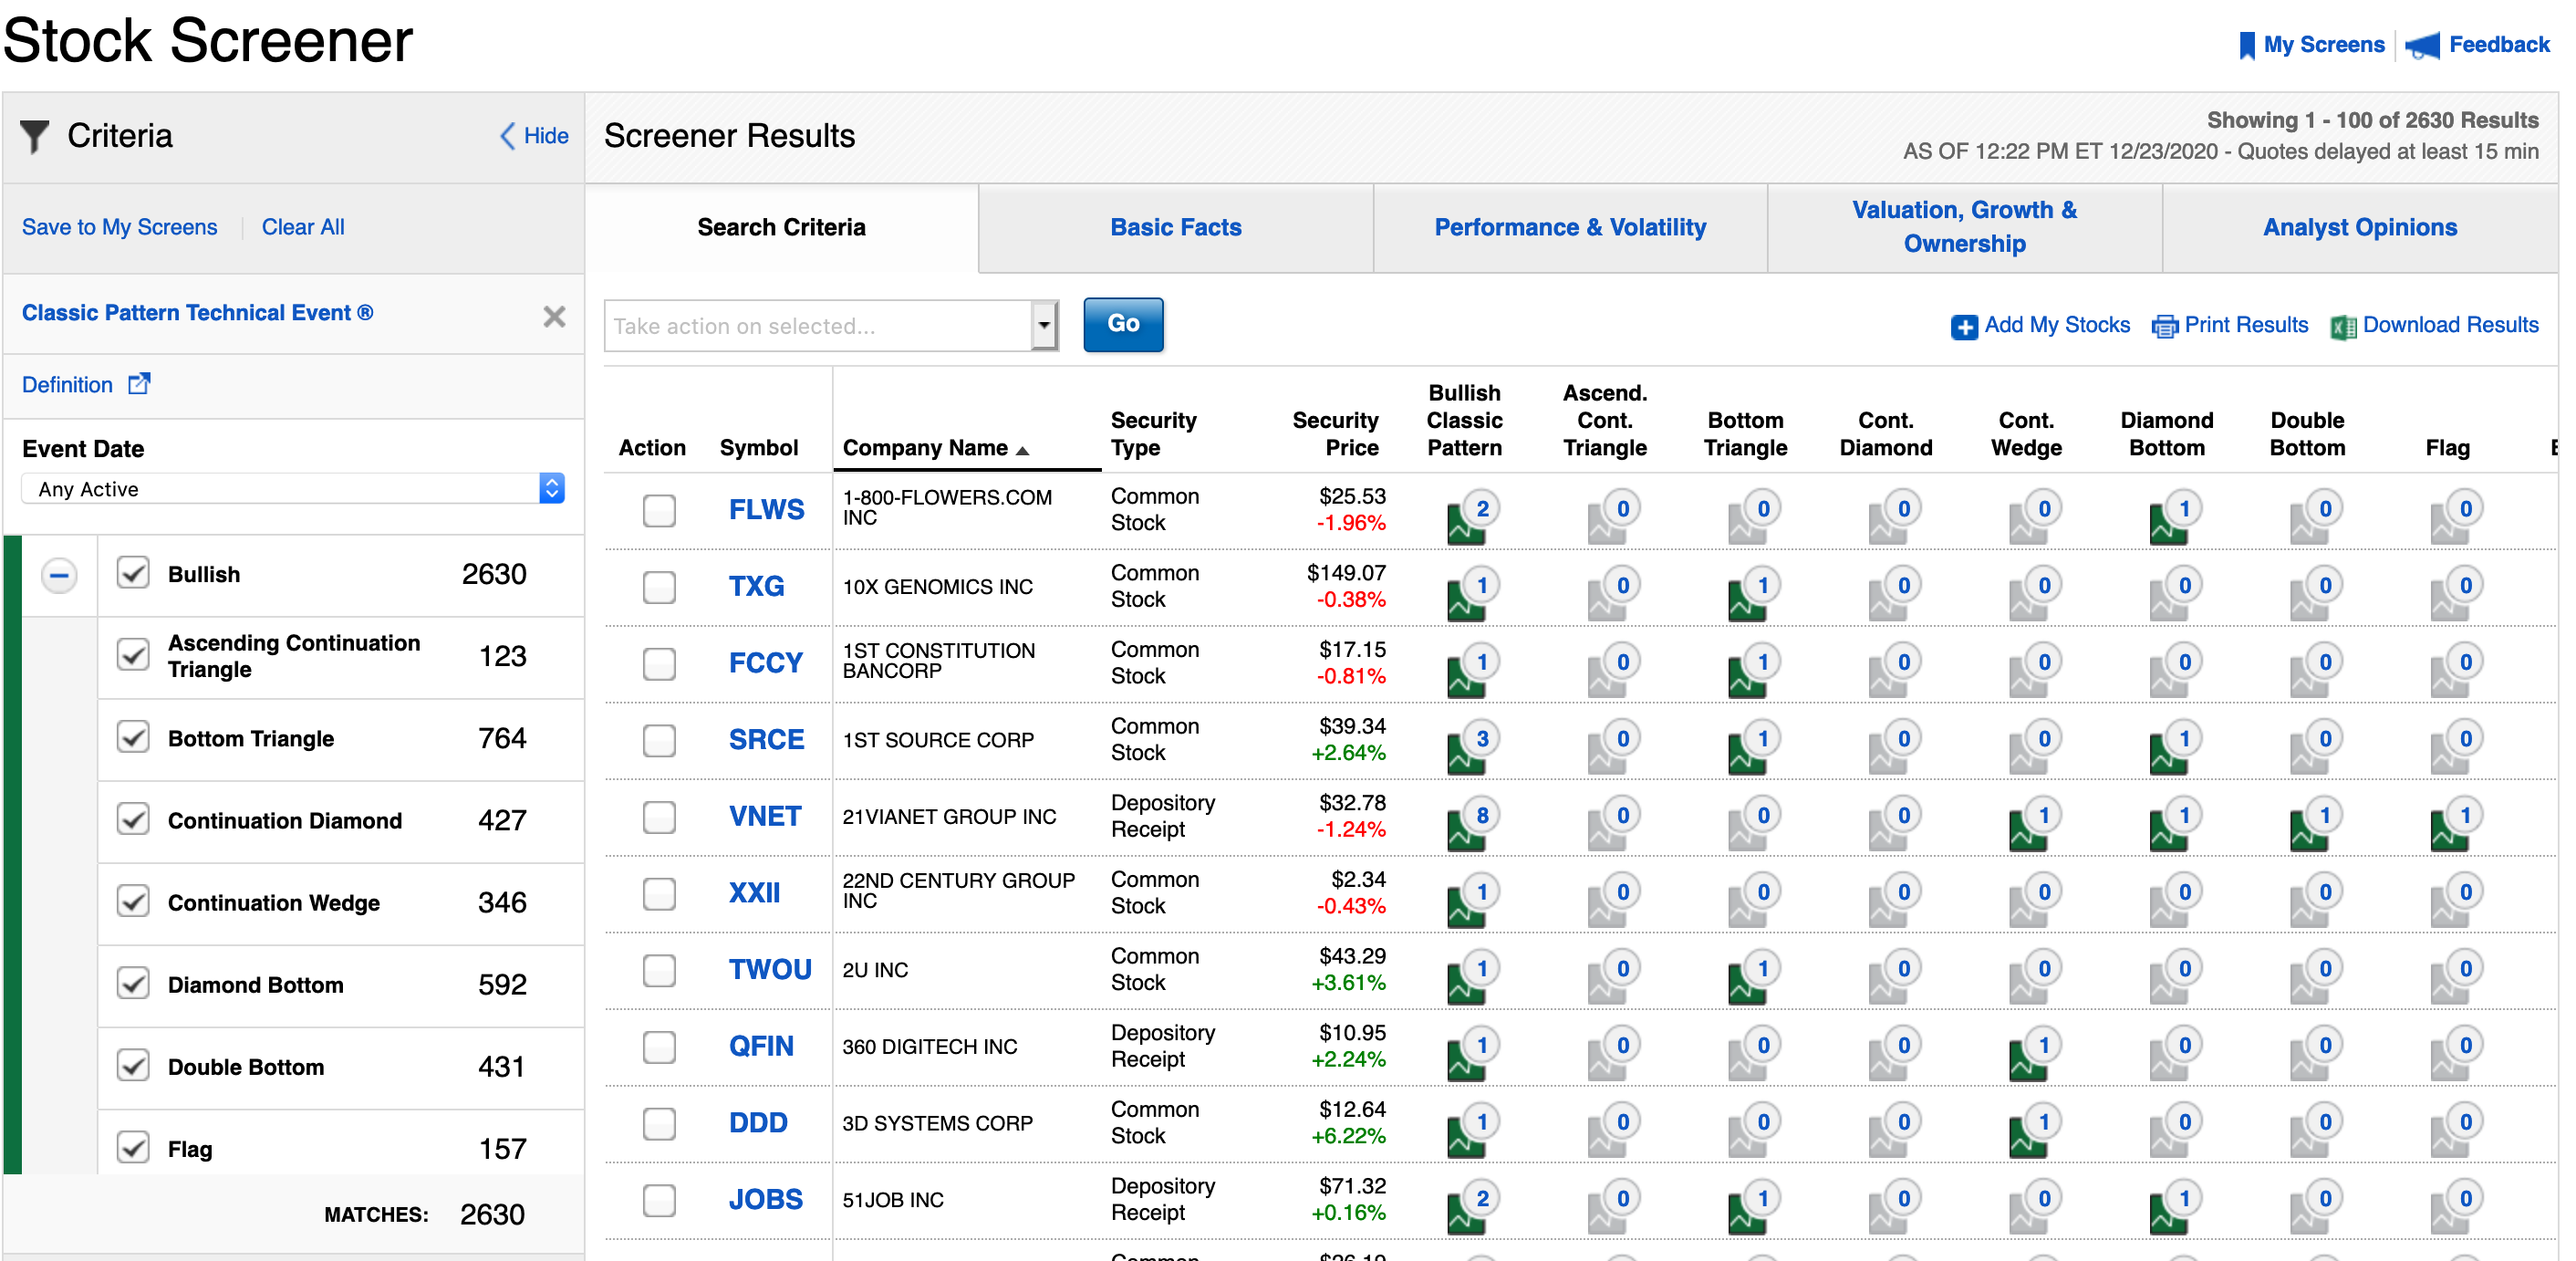
Fidelity supports this with Recognia. I haven’t found much use to it but then I haven’t really worked hard at making it work. Has anyone else used this service?
I haven’t seen Recognia. But I used to dabble with StockCharts.com and their pattern detection was Cr*p. A child could do a better job of detecting patterns.
I met the Recognia people long time ago. I don’t think they believed in it themselves. I really doubt they used AI. Also … CEO left and private equity firm took over I think, which means it’s probably all sales and zero R&D.
What about more practical TA methods like ruler & pencil ? Would be nice to have the support level and resistance level. Very hard to answer that with our rules.
I’m not sure what you mean by “ruler & pencil”. But anyways, you can do a lot with Point & Figure which is pretty practical. It takes away the time element and you can do support/resistance and other patterns pretty easily.
Attached is a P&F chart for PayPal. This was generated by stockcharts.com. You can clearly see the recent breakout from a resistance level.
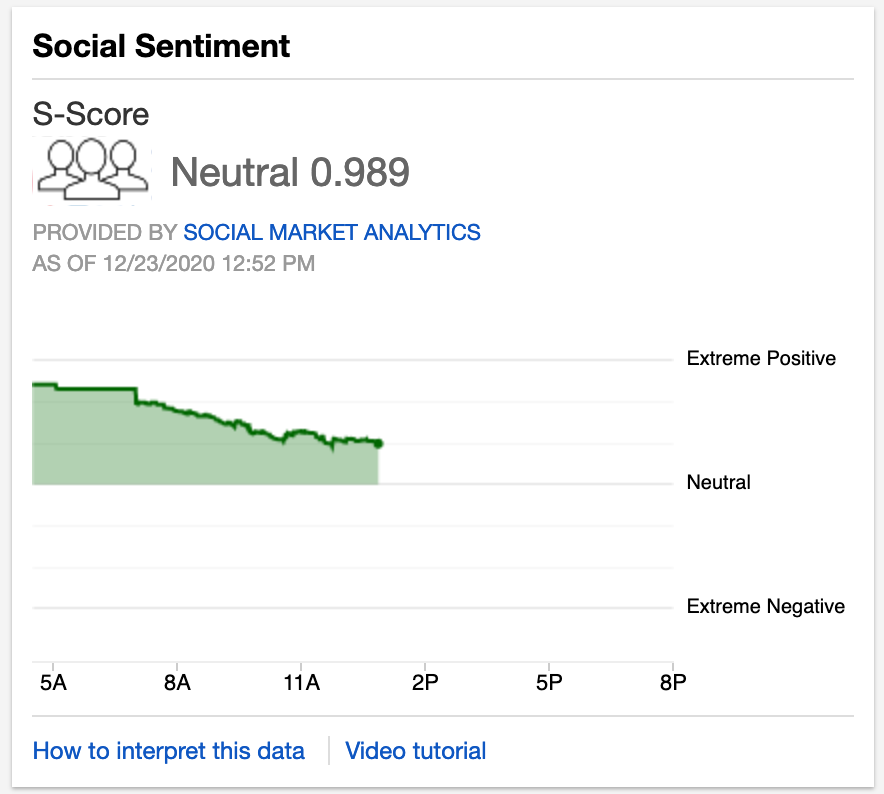
So how about a social sentiment score? Has anyone found that useful? Fidelity uses Social Market Analytics.
Marco, I don’t know how I would use this in a system, but I like the ideas of support and resistance in charts.
It’s something that seems difficult to code, but if it’s there - it usually visually pops out at you when you look at a chart.
edit: Ian McMillan on twitter often uses resistance breakouts in his examples
https://twitter.com/the_chart_life
Ciao Marco et al,
there is two ways to go about this:
Concerning 1:
There was a serious attempt buy P123 and some supporters to add the European markets. If we can’t add European markets, then let’s think about other asset classes. I’m 200% in favor of adding Crypto as an additional asset class (perhaps starting with just to top 100 coins). Data herefor are either free from some sources or available at low fees from providers like Coinmarketcap or Coingecko.
Concerning 2:
More functionality is always a ‘nice to have’, but in my view requires thinking of its usefulness as a tool in beating the market.
In summary, I’m for adding a new asset class, and in this case it should be crypto.
Best regards,
Florian
1- ETF constituent data so that you can create universes based on constituents. (history since 2010 I think). Other use cases t.b.d
2- Daily fundamental data for backtests instead of the current weekly snapshots
3- China Data
Thanks
That is another good point. Offering data in that sense could be a good step up from other platforms. I don’t know if it offers a real edge, of course…
Marco,
Here is the complete code for a first attempt I made of this (a while ago) if you are interested in looking at a primitive example.
This uses a recurrent neural network with long short-term memory (TensorFlow). This particular code is uploading pricing data for TLT. The code–as it is it–did not give me anything that would make me any money with TLT or a handful of other ETFS that I tried.
The main point in sharing this that I think people are confused if they think the coding for the machine learning portion of this is difficult. It could be done in-house if you want. Someone like Steve is able to focus, study the topic and look at the manuals (as he has done with Colab), take it step by step, remain organized so there are no errors and get it done. I am sure that Steve and the professional programmers at P123 could do this.
An alternative would be groups like Steve is talking about where people share their code freely and use the P123 API in their own creative ways. A TensorFlow technical analysis group in this case. Maybe such a group would start with this code. The 8 lines of code to set-up, run the model AND MAKE PREDICTIONS in bold:
import pandas as pd
QQQ=pd.read_csv(“~/opt/ReadFile/medTLT.csv”)
from numpy import array
from keras.models import Sequential
from keras.layers import LSTM
from keras.layers import Dense
train=QQQ[0:54]
train_X=train[[‘percent0’,‘percent1’,‘percent2’,‘percent4’,‘percent4’,‘percent5’]].values
train_X
train_y=train[[‘percent6’]].values
train_y
trial=QQQ[54:]
trial=trial.reset_index(drop=True)
trial
trial_X=trial[[‘percent0’,‘percent1’,‘percent2’,‘percent4’,‘percent4’,‘percent5’]].values
trial_X
trial_y=trial[[‘percent6’]].values
trial_y
train_X = train_X.reshape((train_X.shape[0], train_X.shape[1], 1))
trial_X = trial_X.reshape((trial_X.shape[0], trial_X.shape[1], 1))
model = Sequential()
model.add(LSTM(6, activation=‘relu’, return_sequences = True, input_shape=[6,1], dropout=0))
model.add(LSTM(2, activation=‘relu’,input_shape=[6,1], dropout=0))
model.add(Dense(1))
model.compile(optimizer=‘adam’, loss=‘mae’)
model.summary()
history=model.fit(train_X, train_y,epochs=25, verbose=1, validation_data=(trial_X,trial_y))
yhat = model.predict(trial_X, verbose=1)
pdyhat=pd.DataFrame(yhat)
pdtrial=pd.DataFrame(trial)
pdrnn=pd.concat([pdtrial, pdyhat],axis=1)
pdrnn.rename(columns={0:‘pred’}, inplace=True)
pdrnn.to_csv(“~/opt/WriteFile/pdrnn.csv”, index=False)
Jim - I’m not sure exactly what your inputs are, but I think that image-based NNs may require some more sophisticated algorithms. I think one would need to extract some features algorithmically, such as flagging a sharp increase in stock price, and consolidation. And then feed the features into the NN. It then begs the question “Is it worth it” because if you have to extract such features algorithmically, then what do you need the NN for… Is there added benefit by using a NN versus doing the entire job using a programming algorithm? Answering that question can lead to a lot of work while the answer may not be satisfactory. Anyways, that is my 2 cents.
Steve,
I have not done a lot with this and defer to you on much of this.
For image recognition one would use convolutional neural nets I think. They have pre-defined filters in Python and TensorFlow for image recognition and I think this would be doable for any serious programer like you and P123. It does not really add a lot of complexity to the above code.
But I decided to start with recurrent neural nets and I would not dismiss their ability to find patterns. They are frequently used for speech reconignion for example
So if they are so good why did it not work for me? Probably a combination of this being a primitive first attempt, convolutional neural nets are ultimately better and no one claiming that finding an exploitable anomaly for TLT was going to be so simple that I could do it on my first attempt.
Jim
Jim - you may be right. I am just thinking back to some simple tensorflow tutorials where they were actually feeding in some features into an application that detects a flower. I can’t remember how the features were being determined.
I am familiar with the “iris data set.”
The features for this data set can easily be fed into boosting and would not need the true image recognition that can be done with TensorFlow.
K-nearest neighbors–an even simpler machine learning method–also works well for the iris data set. I will try to copy and paste something on this below.
So you will get this. The code is quite short:
X_train , X_test , y_train , y_test = train_test_split ( iris_dataset [ ‘data’ ], iris_dataset [ ‘target’ ], random_state = 0 )
knn = KNeighborsClassifier ( n_neighbors = 1 ) knn . fit ( X_train , y_train ) print ( “Test set score: {:.2f}” . format ( knn . score ( X_test , y_test )))
print ( “Test set score: {:.2f}” . format ( knn . score ( X_test , y_test )))
They obtained an accuracy score on 97% in the textbook I copied this code from with the iris data set (using classification). The data has things like petal/stamen dimensions. But amount of gap-up/gap-down, 3 month relative performance, RSI etc could easily be substituted.
Jim
Yes, definitely Asian stocks, especially stocks in SEHK, SEHKNTL, SEHKSZSE, CHIXJ, JAPANNEXT, SGX, TSEJ exchanges in IB’s lists: Exchange Listings - Asia/Pacific | Interactive Brokers LLC
Marco,
I would STRONGLY advocate for this one:
1- ETF constituent data so that you can create universes based on constituents.
I may be somewhat biased, but it would immensely help me in my work.