To improve data accuracy across the platform, we are transitioning from our internal Market Cap (MktCap) calculations to FactSet’s official MktCap data.
The Beta Environment
We have launched a Beta environment to allow you to review these changes. This update affects MktCap, Enterprise Value (EV), and related factors within the Valuation category. These changes will move to Production in two weeks, pending a successful review.
Shared Database: The Beta site uses the Production database. Any changes made to strategies or other assets on Beta will affect your live production account.
No AI Stack: AI loading, training, and predicting will be unavailable in the Beta environment.
1. Market Cap & Impact Analysis
Based on our testing within the "Easy to Trade" universes, users should expect the following:
Observed Impact: Approximately 10% of US stocks and 5% of European stocks saw their MktCap values change by 10% or more on any given date.
Examples:
Production
Beta
Yahoo
SMX:USA
SMX (Security Matters) Plc
.07 M
143 M
149 M
US smallcap
RKT:USA
Rocket Cos., Inc.
44.4 B
59.2 B
59 B
US largecap
NVO:USA
Novo Nordisk A/S
212 B
281 B
268 B
US ADR
UHRN:CHE
The Swatch Group AG
1.7 B
8.5 B
8.9 B
Europe largecap
Data Coverage: FactSet MktCap data begins in 2016. For dates prior to 2016, or whenever FactSet values are missing, the system will fall back to our current method: Price × Shares.
Downstream Effects: Changes to MktCap will flow through to any ratio using it in the calculation, including Enterprise Value (EV) and valuation ratios.
2. Update to Valuation Ratios
Unrelated to the MktCap change, we are updating the logic for price ratios with offsets greater than 0 (e.g., Pr2Sales(1,ANN)).
Previous Logic: Used an estimated average price during the quarter.
New Logic: Uses the price on the period statement's announcement date + 1 day.
This change ensures that ratios reflecting historical periods are anchored to the market's reaction at the time the data was actually made public.
I was wondering whether the new MktCap is closer to SharesFDQ * Price or SharesQ * Price. The old MktCap was always closer to SharesQ * Price because that's how it is calculated. The new MktCap is now closer to SharesFDQ * Price about a quarter of the time. About an eighth of the time it's significantly less than SharesQ * Price or SharesFDQ * Price. Weirdly, about a quarter of the time, SharesFDQ < SharesQ. But that's always been the case, both with FactSet and Compustat. (This is a weird one. It has something to do with GAAP accounting for firms with negative earnings.)
For valuation purposes, I've been using a variation: $MktCap is defined as Price * Max (SharesFDQ, SharesQ).
Yes so its smaller than fully diluted for loss-making firms because more shares shrinks the loss per share so the conservative choice(gaap) is to not shrink it. Although it is odd that market cap would be smaller rather than the same (likely because of an average being used or lags) Thanks for sharing!
Will be looking into it with an eye towards doing something similar or identical or maybe mkt cap max of fdq, q, and standard factset value because there is sometimes issuance too in between quarters but not sure if Factset data takes it into account despite them having corporate actions data
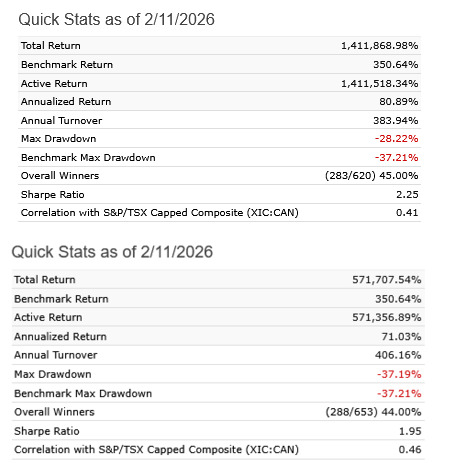
I ran my model over 16 years via the current data (top image) and then ran the same model on the beta site (bottom image). Quite the difference if only market cap has changed. Or am I missing something here?
The differences should not be small since market cap feeds many metrics. It should be more sizeable. It is also a very important aspect when evaluating the “price”. To complicate things, companies add and remove stock in between quarters. You would think market cap is set in stone but its not
As far as I am able to tell Factset might be indeed accounting for corporate actions such as say warrants or share issuance as it occurs which is a big plus: Key excerpts and details from the documentation (as long as Grok is not imagining too much). It does make sense since they have a whole team of people that all they do is monitor and log corporate actions..
Global Prices API (/corporate-actions endpoint): This provides event-based corporate actions data back to 2006 for over 87,000 global companies, including issuances. For rights issues (a primary method of stock issuance), the event is recorded on the ex-date, updating shares outstanding by the share ratio. Bonus issues are similarly adjusted by increasing allocated shares. Prices are recalculated (e.g., adjusted price = [previous close + (tender price × share ratio)] / (1 + share ratio)), and these changes flow into market cap computations when multiplied by point-in-time shares.
The API's adjust parameter (e.g., adjust = "SPLIT") applies these events to historical price series, ensuring market cap reflects issuances at the time they happened.
Security Shares Endpoint (/security-shares): Delivers historical shares outstanding data, adjusted for corporate actions like issuances. This is critical for Portfolio123's MktCap field, as it uses post-event shares to calculate market cap on any given date.
Fundamentals Database: Includes over 750 items like MKT_VAL (market value, i.e., capitalization), calculated using period-end prices and shares outstanding adjusted for actions as they occurred.
What this means for me at least is I will probably take Factset unless eps are negative. If they are I will take the larger of Factset or FDQ *Price or Q *Price. It also would be good to one day have share counts from factset as a metric since a lot of work goes toward having these be up to date with corporate events.
It seems that most of the above conversation concerns consequences related to the transition to FactSet Market Cap.
Is anyone seeing consequences related to the changes to the ratios? I ran a number of sims in both the current and beta environments yesterday and in only one case was there a relatively trivial difference.
I thought I would see more consequences. Just to be clear does the following describe what is intended with the change to the ratios?
Previously the price in Price to XXXXX ratios was calculated based on the prior quarter’s - or is it the trailing three months? - average closing price whereas going forward Price to XXXXX will be calculated based on T+1.
…if I understand the change correctly, why would knowing the ratio on the announcement date +1 be more valuable than knowing the ratio based on last night’s close? In other words, and just as an example, when selecting stocks why would Pr2Sales be more important on the day after the release than as close to “now” as possible? The price of a stock could have fallen by half or doubled since the announcement. That information would be crucial in making selection decisions.
Hi Hugh.
The change was for offsets > 0. So for example, Pr2Sales(0,ANN) is the price to sales using the sales figure from the most recent announcement. It will still use today's price. This was not affected by the change.
Pr2Sales(1,ANN) is using the sales figure from the prior year. So you would need to use the price at that time because you want the price to sales as it was at that time. Before the change, it was using an estimated average price during that year.
Have these updates been rolled out? I’m seeing different results after rerunning some saved strategies and would like to identify the reason for the discrepancy.