By the way I had a good week ![]()
I rebalnced last friday (11/08) istead of last monday 11/11 and catched XPEL before the pop.
You got to be lucky.
Best Regards
Andreas
By the way I had a good week ![]()
I rebalnced last friday (11/08) istead of last monday 11/11 and catched XPEL before the pop.
You got to be lucky.
Best Regards
Andreas
Hi Andreas,
There is something wrong with the Trade Stats you posted. Must be for another model or different slippage assumption.
The sim shows a Total Market Value= $77,684,603.
The Trade Stats shows a Ending Market Value= $160,770,485.
Those numbers must be the same.
Annualized return from Trade Stats: 51.14% not 46.03% as per sim.
1/2/1999 11/18/2019
-$28,777 $160,770,485 51.14%
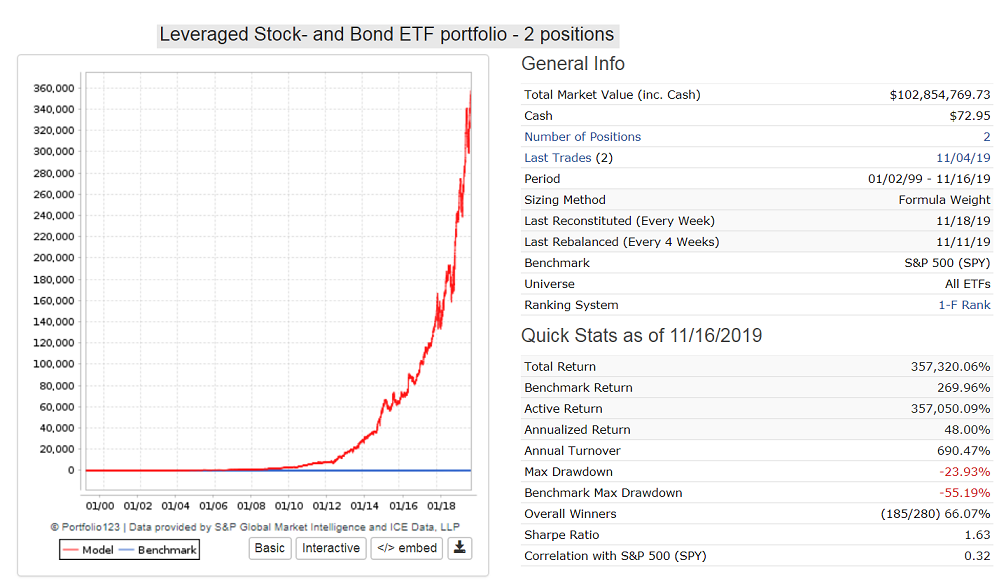
One can get similar performance from ETFs with a lot less effort and much lower trading costs.
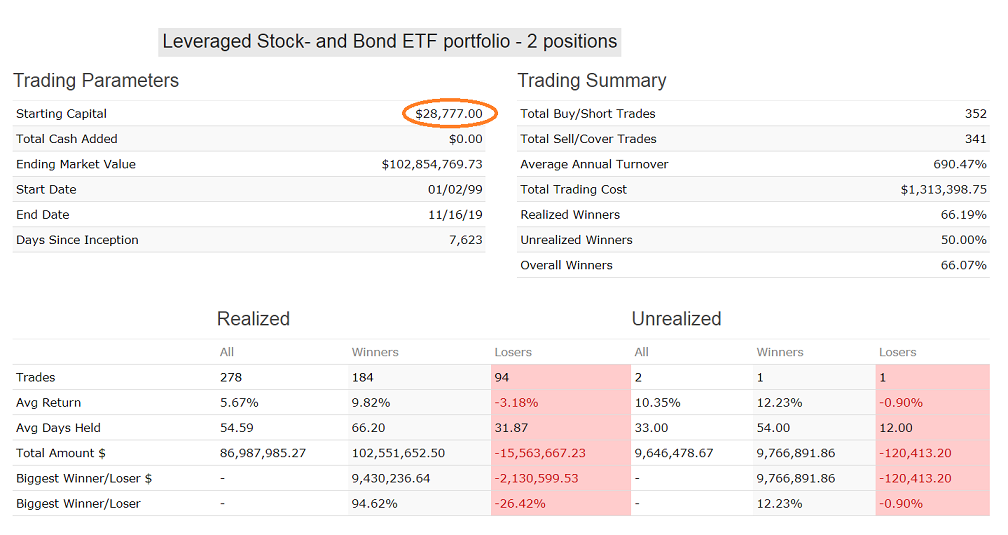
Here is a sim with the same starting capital of $28,777 and backtest period as Andreas’ model.
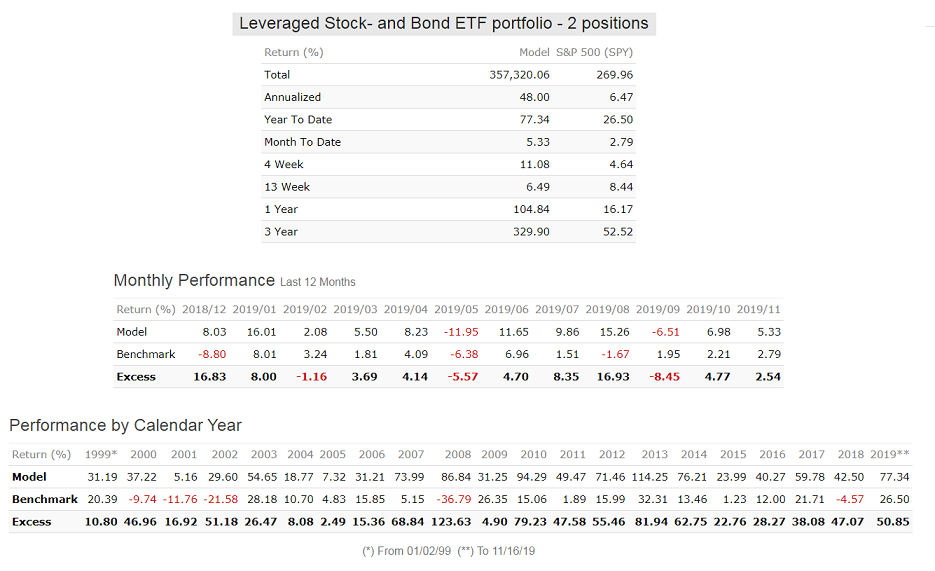
Annualized Return is higher (48%), and max D/D lower.
Positive returns and excess return over SPY for all calendar years.
Hi Georg,
that’s impressive, to say the least!
Will you be offering this here as a DM or at iMarketSignals (or a version thereof)?
Werner
Andreas - I noticed that you do not have revenue growth as a factor. If it was my RS I would be using Revenue Growth as the primary measure of growth, not earnings. It took the genius of Jeff Bezos to make me realize that earnings are not a particularly good measure of anything. We have been sold a fantasy by all those value investing legends. Why would a company show earnings as they are simply going to be taxed away by the government? Investors don’t benefit directly from earnings except to justify dividend payouts which most of us don’t care about unless we are investing for income.
I know that Benjamin Graham is going to roll over in his grave and I’ll probably take a lot of flack for saying this BUT … It isn’t in the investor’s benefit to chase earnings. Amazon, arguably the most successful company ever, only comes up for air (shows earnings) when they want something, like a capital raise for example. Other than that they are not useful and instead, Amazon feeds all profits back into capturing market share and expanding its Total Addressable Market.
Lately, I have been leaning towards using revenue growth as the primary measure. 3-Yr composite growth works well. Then, as additional factors, look for improvements in margin… gross margin, operating margin, etc. Margin improvement RS factors provide additive benefit to the base factor which is revenue growth. The alternative is to provide both revenue growth and earnings growth, factors which do not have additive benefit. If fact the earnings growth is problematic as was stated before and simply muddies the waters when employed in parallel to the “clean” revenue growth factor. In other words:
Good combination of factors:
(1) 3Yr revenue growth +
(2) Gross Margin improvement +
(3) Operating margin improvement
Bad combination of factors:
(1) 3Yr revenue growth +
(2) earnings growth
Steve
Werner, not sure that people will want to invest in those ETFs – a bit risky.
SSO, UPRO, SVXY, DDM, QLD UST, UBT.
But interesting that the D/D is so low with those leveraged ETFs. This may be because it always holds 2 ETFs.
Current holdings: 87% QLD + 13% UST. So there is a bit of protection here.
Hi Andreas, I haven’t been able to successfully work momentum factors into my models and I don’t know if this is applicable in your microcap universe, but in most cases I’ve worked with momentum I’ve found that short term momentum tends to be mean reverting. I just wanted to suggest that for industry momentum it might be worth dropping/eliminating the 4wk industry price momentum (still use 13wk, 26wk, and 52wk) and see if it makes a difference due to the short term mean reverting tendency in prices on a 4wk timescale.
HI SpacemanJones,
tried it out, gets a little less good backtest… thank you for the hint…
I think the reason why it works is, that it is not only 4 Week momentum but a combination. read some papers, where this was suggested (to combine different momentum look backs and combine short term with longer term…)
Best Regards
Andreas
Hi Steve, thank you for the hint, I will try it out…
Best Regards
Andreas
Hi Georg,
yes, this one is with 0.3% Slippage, not variable! the good think is though that the difference between 0.3% and variable is not high (about 4-5% ann.) That is the actual breakthrough to have found a small cap (before that nano cap) model, that performs!
Have to look into the ETF Space, the think is though its then mostly momentum and macro and no fundamentels and I can not capture the size effect as good, so stocks are my thing.
thank you!!!
Best Regards
Andreas
This is a formulation we use throughout p123 when one of the items in a %change calculation might be negative . . . the crossing-zero problem. Suppose I want to compute the % change in EPS fro, b (1.00) to a (1.20). Most folks would do it as a/b or 1.20/1.00 which produces 1.2. The make it appear as a %, we’d actually do ((a/b)-1)*100.
But suppose the prior (b) figure was minus 1.00. In that case, the standard formulation would give us 1.2/-1 which would ultimatley wind up looking like a negative 20% growth rate, the exact opposite of what we want.
The alternative crossing-zero formulation would be this: If a and b are 1.20 and 1.00 respectively, then its (1.20-1.00)/1.00 which is .20/ To express as a % its ((a-b)/abs(b))*100.
Suppose the b figure is -1.00. Now, it’s 1.20 - -1.00/abs(-1.00) which is .20/1.00 = .20.
It also works if the numerator figure is negative, or if both figures are negative.
That’s fine. And as you’ve seen in your work, it can be quite profitable. My quibble is only with the labels. That sort of thing can’t be called value or quality because it isn’t. Among traditionally labeled styles, the one that works best is momentum, or a different label can be created.
When we work only for ourselves, the label is irrelevant. It only becomes an issue when we want to communicate what we’re doing to others who may or may not see the formulations we’re using.
Again, we’re back to labels. Quality can be but is not necessarily about “better results.” Its about a mixture of results (return) and risk. and moving up in Quality can be and often is justified in the face of lower returns but also lower risk.
As I said, personal definitions are fine when we keep our work private. But when we share our ideas with others, we need to speak in terms of commonly-accepted definitions lest we cause confusion and misunderstanding and wind up with the proverbial Tower of Babel.
And its especially important in areas like designer models. I’ve long complained that most models are promoted/marketed horribly. You’re very strong in momentum, traditional and alternative (i.e fundamental momentum) and working with related behavioral phenomenon. Own it. Articulate it, Make it yours. That’s how sellers of investment-related intellectual property market/promote themselves.
Geo,
Warran Buffet says looking at the price is gambling not investment, ETN SVXY lost 90% in one day.
Why we not able to extract performance every year by Graham and Buffet value investing. We have all required factors and formula for value investing.
Buffet says take the market sell off to buy stocks not to sell.
Any successful strategy to buy 52 weeks low and sell on 52 weeks high. In the chart and past data it looks simple and straightforward and how to achieve same in p123 and in out of sample. That is question of thought.
Thanks
Kumar
if anyone have plan to exit the market when market is shaking/drop down you are a trader – need to monitor the market every day,
i am moving away from trader mindset.
if anyone have plan to enter the market when market is down. you are a investor. read and follow Mr.Warran Buffet’s footage.
I am leaning towards as investor.
Thanks
Kumar
Andreas,
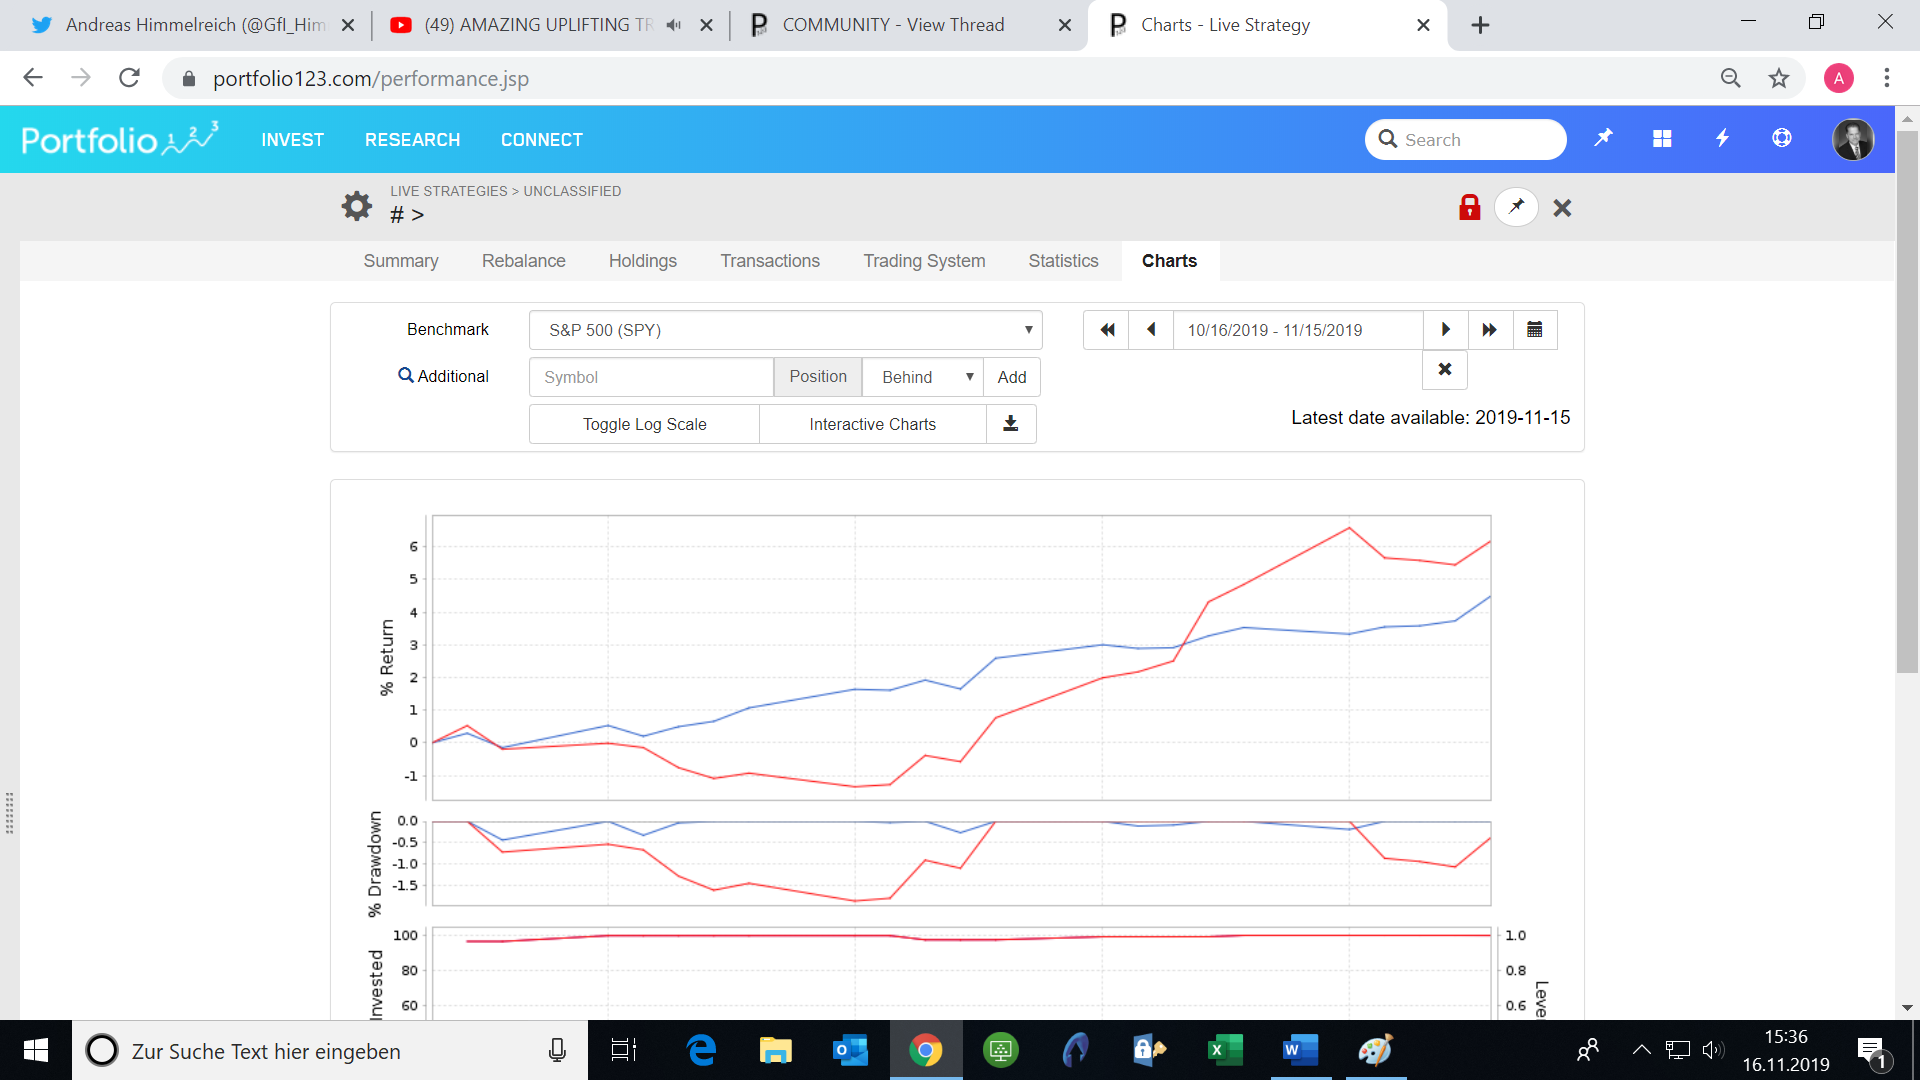
The max D/D of your model = -25.46%.
From my experience you can only get such a good D/D with market timing.
Please confirm, and if possible let us know what you use.
Thanks,
Georg
Kumar that is the reason why the model always holds 2 positions.
Also ProShares Short VIX Short-Term Futures ETF seeks daily investment results, before fees and expenses, that correspond to one-half the inverse (-0.5x) of the daily performance of the S&P 500 VIX Short-Term Futures Index. It used to be -1.0x. So the risk is less now. If they had implemented this from the start one would “only” have lost 45% in one day.
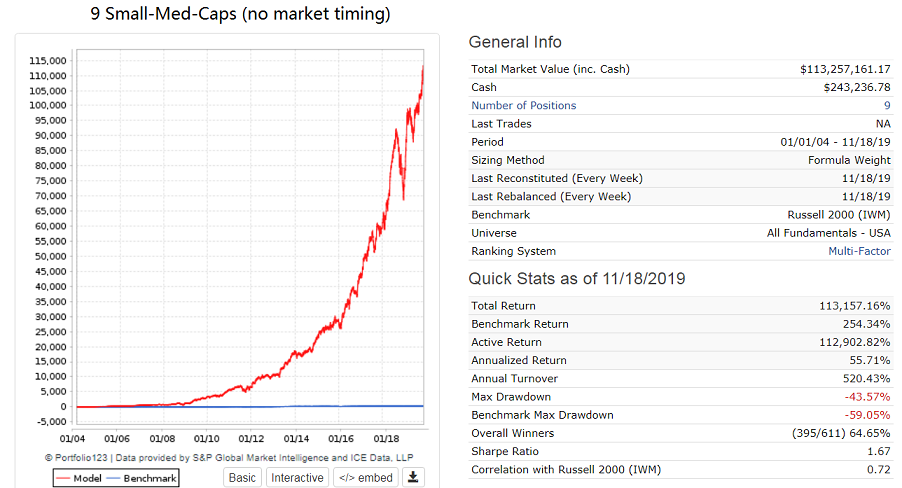
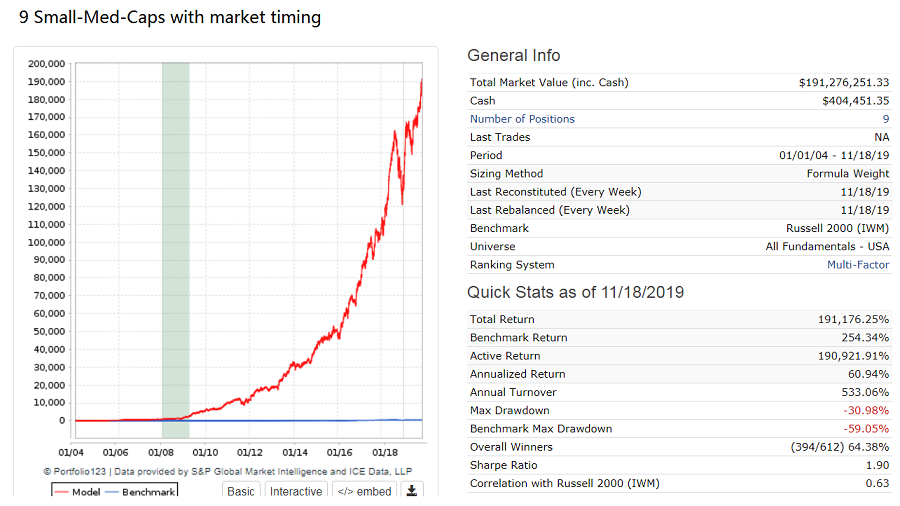
Although I prefer ETF models, it is not too difficult to design a small-med-cap model with annualized return > 50% and reasonable turnover and drawdown. Here is performance from Jan-2004 with variable slippage, without and with market timing. The buy rules are based to a large degree on Yuval’s recently posted screen rules.
Mark, you said:“Suppose the b figure is -1.00. Now, it’s 1.20 - -1.00/abs(-1.00) which is .20/1.00 = .20.”
No,in this case the result is (1.20 - -1.00)/abs(-1)=2.2/abs(-1)=2.2 (220%)…not 0.2. Am I wrong?
Anyway, despite what you said, which is terribly right, the formula a/b used by Judgtrade genarally (and I do not know why) gives a better return.
Hi Mark,
understood! (correct labeling!).
Thank you for your hints!
Best Regards
Andreas
Hi Georg,
yes, market timing is included:
Buy rule: (close(0,#spepscy)>ema(75,0,#spepscy)) or (close(0,#bench)>ema(75,0,#bench))
Sell rule: (close(0,#spepscy)<ema(75,0,#spepscy)) and (close(0,#bench)<ema(200,0,#bench))
My take: its very loose, e.g. it will not protect you from a 20% DD, but from a 2008 scenario.
It was out of the market in 2015 very shortly, otherwise it hold me in the market basically since
2011 which was fine so far.
Also: the SP500 Earnings are estimated by a ton of analysts, the whole market looks at that number, so they
might be wrong for prolonged time, but they correct regulary.
I invested a ton of time in macro timing the market and I have to say that this simple formula (combined with
a good ranking system) is really hard to beat.
And from what I have learned its really hard to be protected from DDs that are in the 10-25% range, so
I simply teached myself to withstand the vola and think more in terms of total return instead of
so called “volatility adjusted” return.
Also I regulary have a look at your work at (pops up every day at my screen when I open my browser!!!):
https://imarketsignals.com/bci/
Best Regards
Andreas