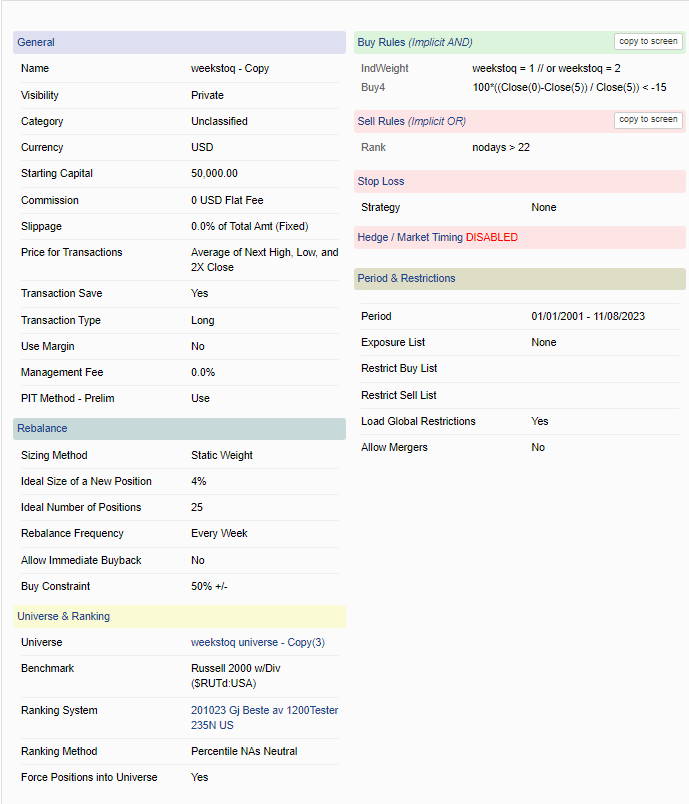
The rule in that post ( ```
100 (close(barssince(latestnewsdate)-4)/close(barssince(latestnewsdate)+1)-1)<-15 and between(barssince(latestnewsdate),5,10) ) Did not improve the results.
They stay on my ranking systems sometimes. For example, STRL just a few days ago still ranks well for me. Some systems may seek out stocks with big drops also.
I honestly don’t understand some of the behavior around earnings though, even after reading the conference call I might not really understand why a stock drops or pops post-earnings.
edit: I’d add, it’s unclear to me whether selling as quickly as possible after a big drop on earnings is warranted. It seems a lot of big droppers (at least in models I have) have some price recovery in the weeks following the big drop. But it’s anecdotal - I have not done an event driven study.
If anything. if a small cap stock suddenly drops 15+% without any obvious bad news in the top or bottomline after earnings, I’ll usually buy a bunch more and overweight and hold for a few days as the price (hopefully) pulls back. Then reasses where it is in my ranking after the dust settles. A lot of (very short term) noise going on after earnings announcements, particularly among microcaps. I don’t really have a systemic approach to pullbacks, because they’re hard to perfectly time, but this is as close as I get.
Thank you for the response, and you are probably both right.
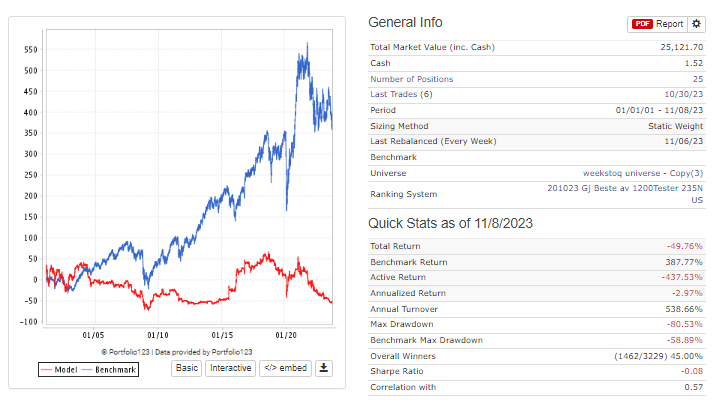
I was still surprised at how badly, according to the backtest, the stock kept on doing after earnings releases and a sharp fall ( < -15%) the same week.
Maybe I’ve seen an effect here that’s not really there. When searching through the public screening, rankings, and simulation criteria, very few use WeeksIntoQ, so may thats a sign?
Unfortunately, I have to think there’s an unsatisfying “it depends” on this. If there is obvious bad news on earnings, executive fired/fraud/huge miss/major guidance guide down I can see getting out asap before the bad news filters through the market. It might be quite a while until sentiment changes back positive.
Yesterday, LWAY went down 26% on earnings. I searched all day for the reason and couldn’t find one. Beat expectations on top and bottomline. Nothing pessimistic in the earnings call transcript. I tripled down and put 3X my original allocation to it and it’s up ~+20% the next day at the time of this post. Strange things go on around around earnings announcements, but even more so in microcap land. Major price dislocations happen all the time.
Very nice trade. If you’re willing to share, do you normally keep cash available just for this opportunity? or happen to have cash due to recent sale? or did you have to sell positions to create the cash?
I was rebalancing my portfolio on Monday during the LWAY drawdown and was selling stocks from my Sell Rules. Instead of putting the money towards my new Buy recommendations I just poured it all into LWAY. I will probably take my gains and equal weight my portfolio today with new buy recommendations.
But I do think I’m going to start holding more cash in my portfolio for discretionary “special situations” and I’ve implemented my own system of out of the money Puts (inspired by Yuval). I was already down the road on this by putting CashPct>XX in my Buy rules.
Great info. I’m not a “market being manipulated guy” but price behavior like this makes me speculate that something may be systematically going on around earning in the micro/small area to perhaps trick up other algo systems that trade on earnings? I read both the press release and conference call for LWAY and as you mentioned there was seemingly little there that could spur share dumping. Actually the opposite. But I have no experience drinking the product though, or no experience with the new cheese product they launch. Still contextually numbers and comments were favorable, better than expected.
I also wonder if some companies maybe trade on “getting-ahead-of-themselves”, and LWAY might be in that category based on the huge jump on earning in previous quarter jumping from arondd $6+ range to $11 range. Stock goes nowhere for 3yrs and suddenly doubles - can create an unease amoung holders eager to protect gains at any sign price weakness? I don’t know, just thinking out loud. Alot of small companies act strange on earnings and I honestly am baffled sometimes and it would be good to have a framework to think about it. I suspect the risk/reward around earnings is asymmetric in the downward direction, at least in the companies I invest in, and would like to understand it better.
FWIW, I have been following LWAY for a while out of my own curiousity. It’s one of the few microcaps I’ve owned where I personally use their product (or at least my wife does). So they’re a family owned and operated public company. Mom is the CEO and son is (was) the CFO. Evidently there was a huge family split and things got really contentious to the point where the son left and tried to have the mom removed as CEO and I think there are is still pending ligitation that he has put out. He is still a huge share holder, and there’s always lots of speculation that he’s dumping shares whenever the stock has a big down day. The company has had huge margin and operating income growth in the last year, so maybe the son was a problem.
The soap operas of microcaps are a blast. You don’t get this kind of entertainment owning IBM or 3M.
Very interesting. I can attest their kefir is a very good product.
My strategy was holding LWAY too but it sold on Monday which was the absolute worst timing. I generally follow and do not override long recommendations, so that my trading is as high fidelity to backtested strategies as possible. My thought is that I’m not pausing to review backtested trades at each point-in-time, so would my manual decisions in real-time actually have positive expected value? On the short side, I have to manually review and override trades as p123 is currently oblivious to actual borrow costs.
But this was a case where I would have loved to override the sell – the drop post-earnings did not make sense to me either. What I would love is to have a manual discretionary strategy, and a “Transfer Position” function in p123 to have a single position journaled between p123 strategies at the latest market price. This would allow my account strategy to follow the live strategy perfectly, but still allow me to hold on to the position, and perhaps more importantly, track the performance of my discretionary overrides over time.
I’ve made this request in the past, as the current “Transfer Transactions” functionality is not granular enough. It’s a shotgun when all I need is a scalpel.
Does Portfolio Visualizer have a new tool for this? Cointigration (and the Augmented Dickey-Fuller Test) are universally used for pairs trading. If Coke and Pepsi are cointegrated and Coke gaps down one might buy Coke and short Pepsi (after additional research). Cointegration makes it more likely the Coke will “mean-revert” based on the Augmented Dickey-Fuller statistic.
Simplified use: if an asset gaps down (whether you are already holding it or not) one could see if the asset is cointegrated with the benchmark (or sector or industry) and likely to mean-revert—as just one piece of information to be sure.
Edit: Theoretically it can be expanded to multiple assets using a “Johansen test” and used for portfolio construction. I played with this today and it seems difficult at best. I deleted tha portiont. I think the Augmented Dicky-Fuller test it remains promising for looking at gap-down stocks and can be tested easily using Portfolio Visualizer.
Here are a couple of links where cointegration is paired with Bollinger bands. In the first there is not pairs trade. One could use Bollinger Bands with or without a gap down.