Jrinne, he was just responding to my post, which was just a joke.
But, seriously, I think geov and some others outside of P123 have done some interesting stuff on seasonality. Its a thing, even though I don’t think anyone really knows why.
Jrinne, he was just responding to my post, which was just a joke.
But, seriously, I think geov and some others outside of P123 have done some interesting stuff on seasonality. Its a thing, even though I don’t think anyone really knows why.
Thanks.
Too bad it was just a joke.
But time-series are tough. I can see why you have not tried it in a serious way. Although I think you could if it became an area of interest for you.
-Jim
Seasonality of stock market:
The seasonality of the S&P 500 is easily verified. The S&P 500 with dividends from 1960 onward returned on average 1.92% for the yearly six-month periods May through October, the “bad-period”. For the other six months, the yearly “good-period”, from November through April, the average return was 8.47%.
I have quantified this now with Likelihood Ratios. .
The time over which I tested this is from January 1960 to April 2019, which held 59 cyclical good-periods and 59 cyclical bad-periods for stocks, totaling 118 six-month periods.
Applying the concept of Likelihood Ratios, one can calculate the probability, which turned out to be 65%, that the good 6-month periods from November to April will provide higher returns than the average-return of 5.20%. (The Null Hypothesis is the default position that there is no relationship between two measured phenomena, or no association among the two groups, and therefore both periods in our case should produce the same average-return of 5.20%.)
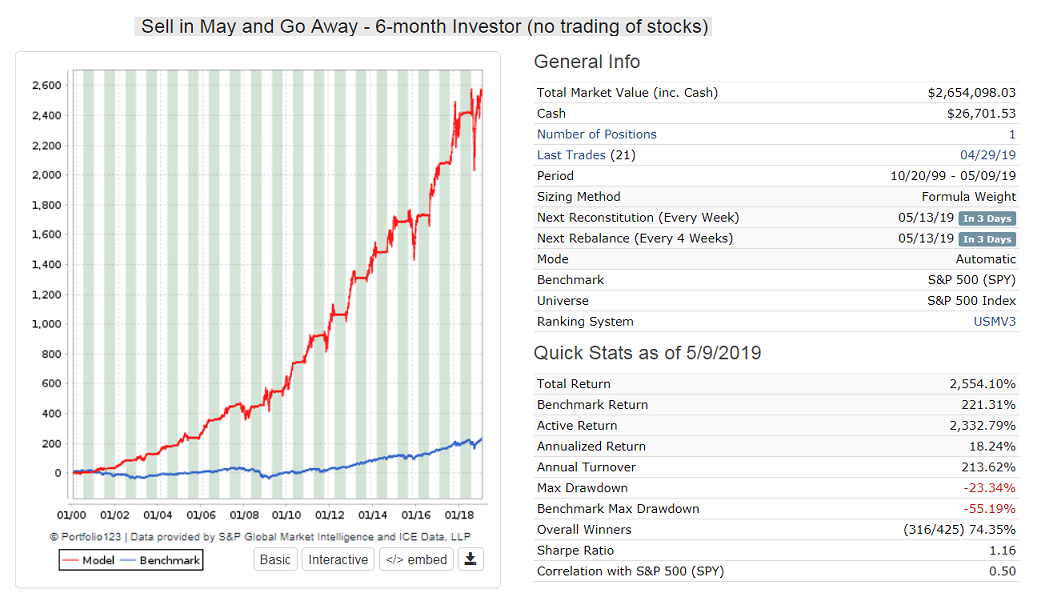
See also my DM, which is open for people to observe - but you would be foolish to subscribe at $1,000 per month.
https://www.portfolio123.com/app/r2g/summary?id=1531420
For the US, this too shall pass.
All of my timing indicators look fine.
Be forewarned, the European markets will be in a similar disruption in October when the ‘new’ Brexit date comes due.
Jim, my response was indeed in response to the tongue in cheek joke made…
I usually stay out of the fray, but since you asked. I traded S&P futures in the 90’s using neural networks. They were a thing back then. As I recall I had something like 25 inputs. Due to the lack of computer power in those days it would take hours to run. The signals were decent, but after a couple of years I moved on as the results weren’t much better then reading charts.
In the early years I was a chartist. This worked out great for me. However I ultimately moved on to quantitative analysis as it is far more objective. Turned out to be a good move.
You are correct in that my system is extremely complex and has pushed the capabilities of P123 to the limit over the years. I joined in 2007 to be able to download raw data on stocks. This was then served to Excel where the heavy lifting happened.
When P123 changed the download limits it pretty much killed my research. So I had to move my Excel work onto the P123 platform. This took years to do as I would get so far, then find out P123 didn’t have the capability I needed to get to the next step. I developed some workarounds to the download limits, but those took what was once a 30 minute process to run my macros into two days or more.
When P123 introduced variables, that changed everything and I was then able to essentially start writing the code that allowed me to convert from Excel to P123.
Overall it took about seven years to completely get my system running on here. I always ran into constantly pushing the limits of P123 and would have to wait for future developments/improvements.
It now works great, however still not exactly as my Excel work ran. The thing I’m waiting for that will complete the work is for P123 to introduce dynamic weights in the ranker.
I follow these threads with interest, sometimes cringing as I read how difficult some make their systems. My observation is that almost everyone on here is curve fitting, whether they know it or not. Thats just the nature of screen development, back testing and optimization.
My system is completely objective. I don’t get involved with it except for some due diligence when reviewing the stocks that get output from the run. It’s taken years and years to port my system onto here. We have a really good thing with the work that Marco and his team have done, and continue to do.
I’ve often contemplated making my work public for the benefit of all. Trouble is it took me from 1992 to 1997 to fully develop, and I’ve been successfully trading it now for 22 years, without changing it at all. So, it’s just not time yet to throw it out onto public domain without compensation.
Having said that I am open to dialogue about what I do if anyone is interested.
Now, back to work…
-Steve
Steve, how have your results been on a year by year basis of your model? What is your benchmark?
I am always interested in hearing about the results of long time users of tools like P123. thanks in advance.
Steve,
Thank you for your thoughtful reply. I thought about deleting my comments.
Looks like I skimmed and missed the tongue-and-cheek. I actually did look up the lol (for alternate uses) before I posted because I had trouble believing that you were making fun of Cary’s technique. You weren’t. You laughing WITH him and not At him.
I did not delete because I do not think I was too harsh on anyone. I have no complaints about "complex’ techniques as long as whoever is using them has taken whatever steps they think are necessary to avoid overfitting and they are not throwing stones at someone else for doing the same thing.
Plus, I hope to use my own neural net or other complex time-series ideas, sometime.
Thank you for sharing.
-Jim
My objective when I designed the system was to rival the top 5% of money managers in the country. Back then it meant having a 10 year annualized return north of 18%. I was successful at beating that, some quarters I would land in the top 2%.
My long term objective is simply to outperform the major indices by 5%, which I do regularly, and often by far more than that. My work did take a pretty big hit in 2008/2009, along with everyone else.
I know there are some on here that are putting up some pretty big numbers, but that seems to be with a very small number of holdings primarily in micro-caps. My portfolio invests only in listed stocks north of $10 per share. I hold 18 to 25 positions with typically 100% annual turnover. I’m into consistency, manageable volatility and compounding.
On here I use the Russell 3000 w/div as my benchmark. Thanks for asking!
Steve, thank you. Encouraging for me. I have had up and down performance over the years but am always trying to keep the faith. It is good to hear about other’s real world experience.
I invest in SP500, SP400 and some (liquid) PRussel 3000. Mostly large caps. 65 positions over 5 ports. 35%<TO<175%/yr. My goal is to beat SPY, over time. Not a high goal but it still can be tough in some years. All in an IRA for retirement so I am very conservative about it.
All this tells us is that it is an analysis of hindsight statistics.
Sevensisters:
“All this tells us is that it is an analysis of hindsight statistics.”
Unfortunately we don’t have anyting else. Future statistics are not available because the future is…the future!
Well, yeah. On both counts.
Problems that can be addressed (to some extent) with a hold-out set for cross-validation or hold-out-testing.
Far from perfect for a host of reasons. Maybe the method could/should be discarded in many situations, but it generally should be at least considered if there is enough data to create a training and test set that are large enough. The training and test sets are combined later so there really is nothing to lose.
I would be the first to start a list of reasons why this is not perfect. de Prado’s book (Advances in Financial Machine Learning) would provide a list of problems/best practices from someone that understands this better than I do.
In this case seasonality is so well-know, discussed and published that data-snooping may make a hold-out set useless here. You would be testing data for which you already know the result. So I am personally okay with the way Georg has done this. And it may be more honest here than presenting a test set pretending you do not already know what the data will show. So, it may only be useful for the development phase and not so useful for presentation: who knows if someone else might have peeked at the test data.
So, hmm. Good points and maybe I don’t have much of a solution (for this case).
-Jim
Jim,
thank you for your elaborate comments.
Werner
EWT looks for a big decline, going from 2900/3000 to 2100/2200
I was aware of this seasonal SP500 strategy 25 years ago so I believe that it works. There is one caveat however and it applies to all seasonal patterns. The caveat is that if the pattern does not hold for a given season then it will not hold “big time”. This tends to skew stats.
There is one seasonal S&P500 trading strategy that I remember from ~2000 that tried to take care of the above caveat. Basically, you only enter the S&P500 after October 16th when the MACD crosses above zero. I believe that stockcharts.com still carries this strategy but I’d have to track it down.
It looks like this IS going to be something bigger.
We are going sharply lower as of this writing.
Steve and Georg mention the SP500 in the above posts.
I think Georg has specifically excluded other indexes from this effect in past.
Something to keep in mind if you plan on using the seasonality signal. Most members already know this, I think.
-Jim
This doesn’t reduce it’s effectiveness if that is what you are getting at.
The SP500 seasonal pattern reflects the natural yearly business cycle. People take holidays throughout the summer and return for work in earnest in the fall. The business environment can’t truly be evaluated during the summer and numbers (employment, GDP, etc) don’t firm up until the October-ish time frame. And politics (elections) adds to the uncertainty every two years. We start getting a better understanding of how retail is going around US Thanksgiving. and this extends into January. Then we get into quarterly/year-end reports that reinforce the economy numbers previously published. This takes us to mid-April and IRS which marks the start of the summer season.
Generally speaking, October-May is bullish most of the time (70%??) but you should be able to tell how the winter season will play out in October based on Fed Reserve activities and politics.
The most important thing to remember is that issues (trade, foreign affairs, fed reserve actions, etc) occur all of the time and are outside our control. But market sentiment determines market action, not the news items. If there is a positive sentiment, then the markets don’t bat an eyelash with negative news. If the market sentiment is bad then it is like crisis mode even for things we know will blow over in a short period of time. Market sentiment usually works for investors during the winter months, and is stagnant during the summer months.
Steve, thanks for providing some reasons for the seasonality.
It’s not just the S&P that shows this anomaly. A German investor told me he is using futures on the DAX and makes about 10% return from the seasonal effect. In Europe many go on vacation during the summer months. Some while ago when I worked in Barcelona, the town was virtually empty July and August, same for Paris, Vienna, etc., and even the Germans take part in this summer ritual.
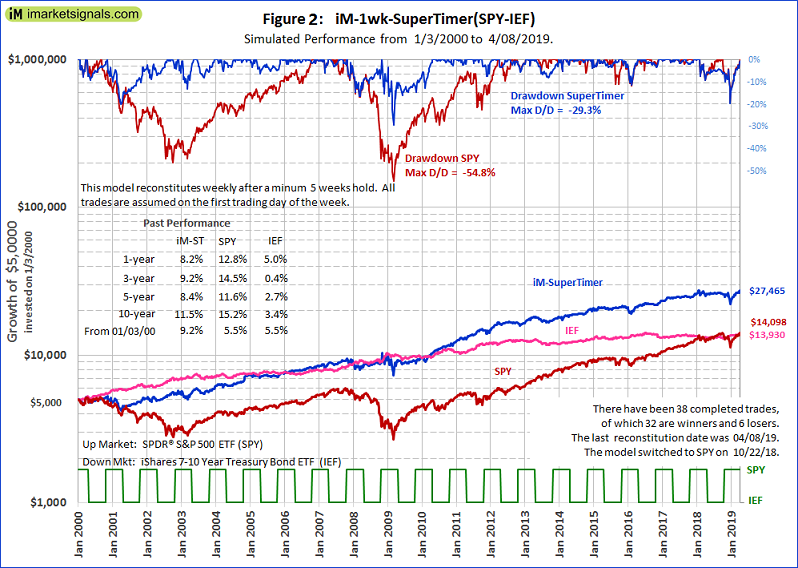
Here is my SuperTimer(SPY-IEF) from Jan-2000 to Apr-2019. For the seasonal switching strategy 14 of its component market timer models were turned off, only leaving the seasonal timer model on. Growth is plotted to a logarithmic scale, and the investment periods for stock fund SPY and bond fund IEF are depicted by the lower green graph in the figure.
For those who are interested, the iM-1wk-SuperTimer with all the 15 component market timer models from its arsenal turned on would have produced $169,692, for an annualized return of 20.1% with a maximum drawdown of -10%. There would have been 45 completed trades, 39 of them winners.
Just interested in whether this applies to my smallcap models.
Thank you Steve and Georg!!!
-Jim