uses only one feature for prediction (SMA for the same feature as a target)
Its parametric assuming linearity and normality.
most uses of SMA assume trending, while we found mean reversion dominates
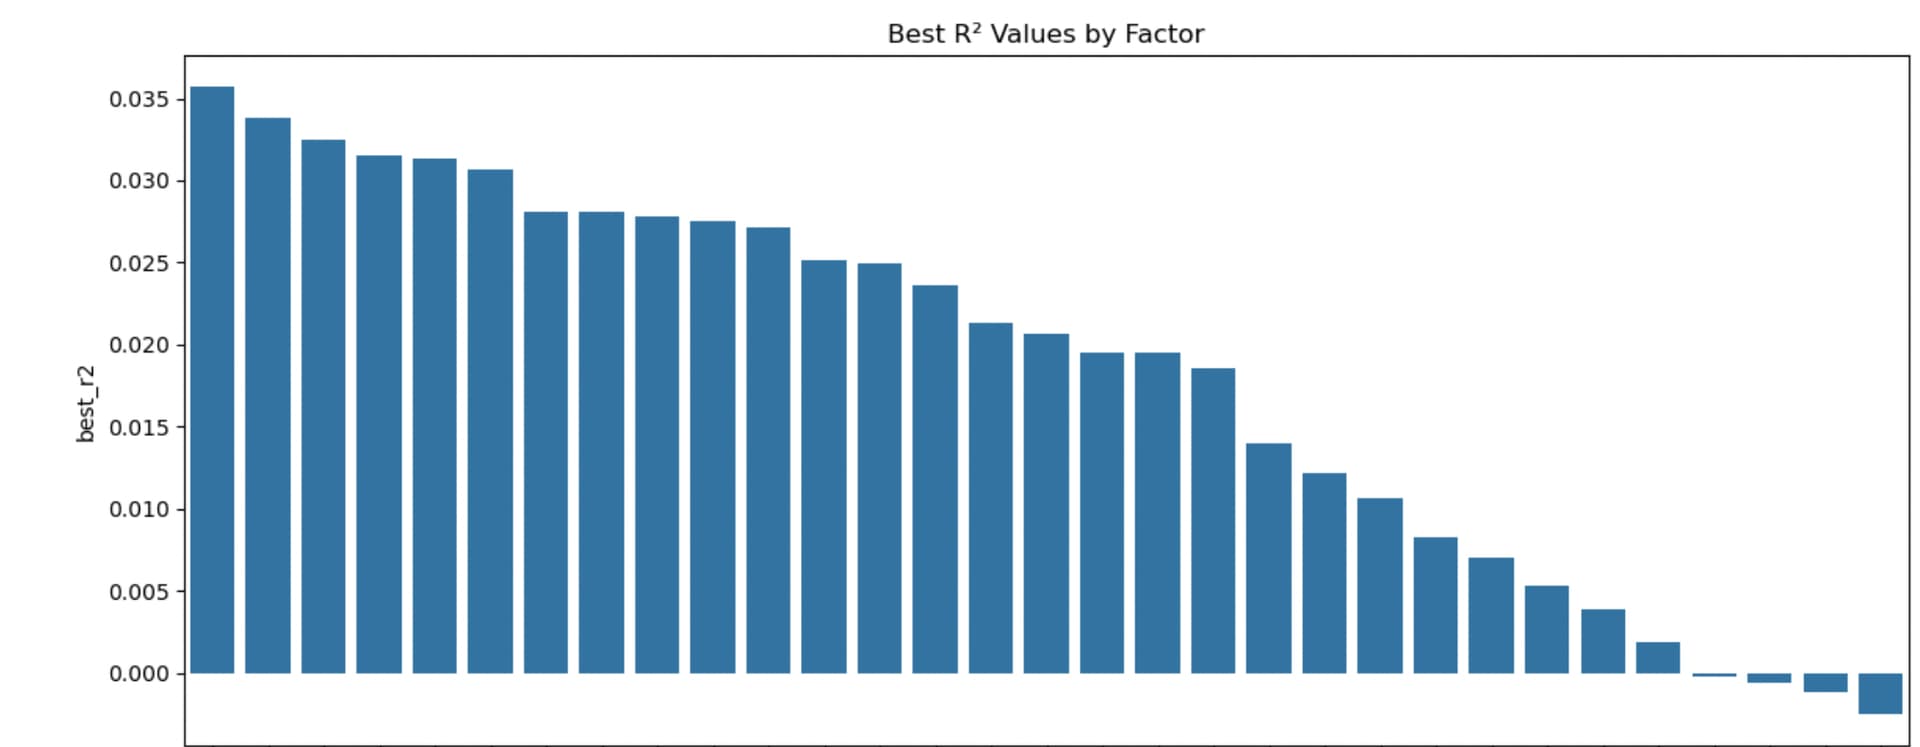
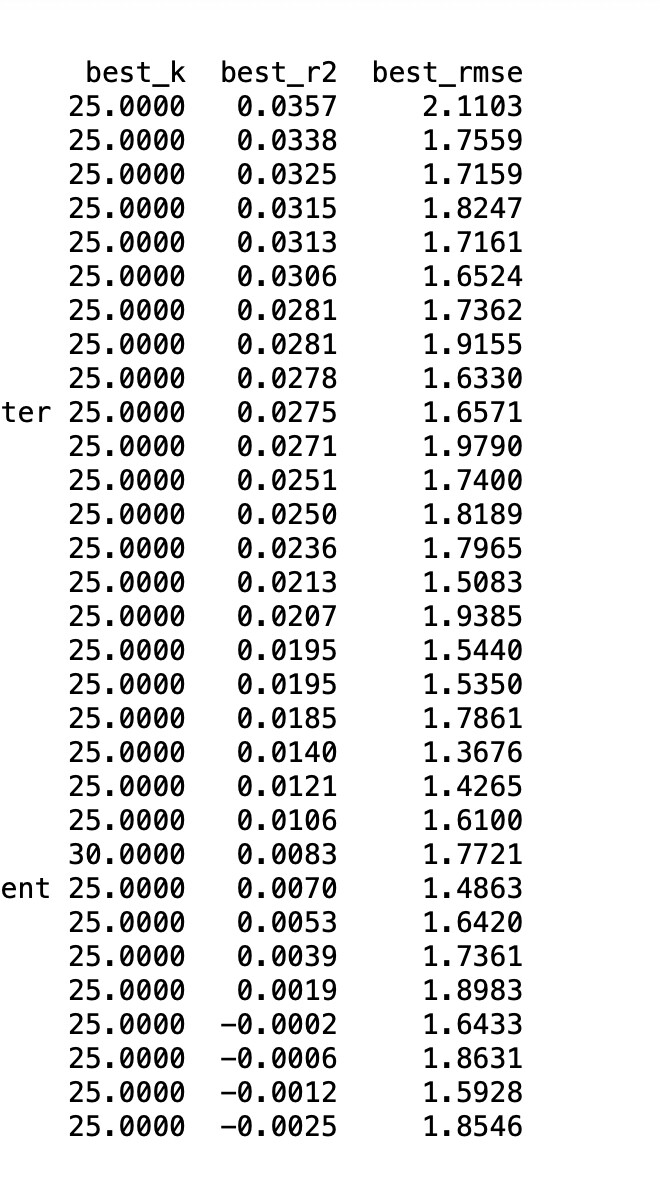
I did a similar analysis using K-nearest neighbors (KNN) and the SMAs of all features to predict the future returns of a single target feature. Repeating this for all target features.
Implications:
Using all factors together provides marginal improvement in predictive power
Non-linear relationships may be present but are still quite weak
Even with more sophisticated methods, factor predictability remains challenging
The improvement in R² values suggests there is some benefit to considering multiple factors together, but the overall low values still indicate limited predictability in factor returns.
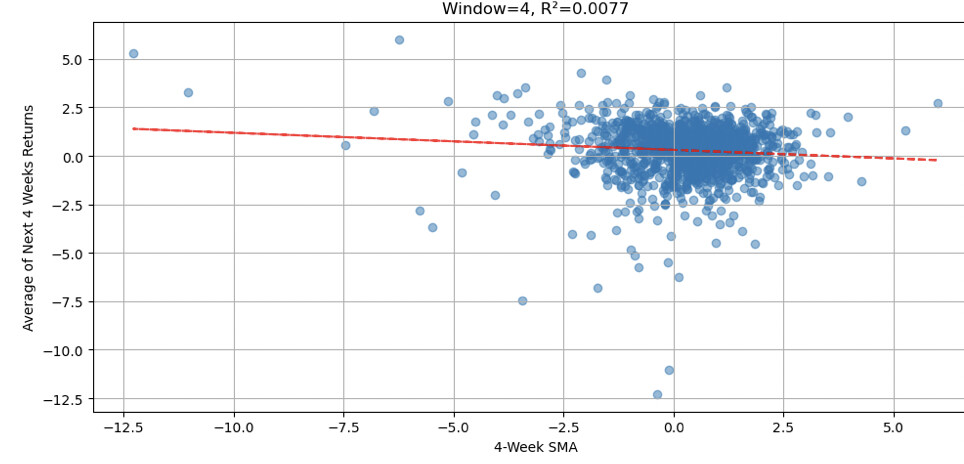
Specifically, I used 4 weeks of returns to predict the next 4 weeks of returns. Here is an example of a factor that mean-reverted. Here the regression line had a negative slope. At the far left of the graph, the 5 data points with the worst 4 weeks (on the x-axis) went on to have some of the best months going forward (the y-axis). None of those 5 data points showed negative returns.
But one could argue for a U-shaped curve with this data which would be one reason to use KNN as it does not assume linearity. Looking at the scatter plot, extreme negative returns (left side) AND extreme positive returns (right side) both tend to be followed by positive returns, suggesting a U-shaped relationship. However, it gets more difficult to classify a factor as just trending or mean-reverting when encountering U-shaped curves. While less descriptive, KNN methods may have more predictive power when data is not always linear.