I can give you some suggestions, I can’t guarantee that any of them will work. I can guarantee it will be a lot more work, however.
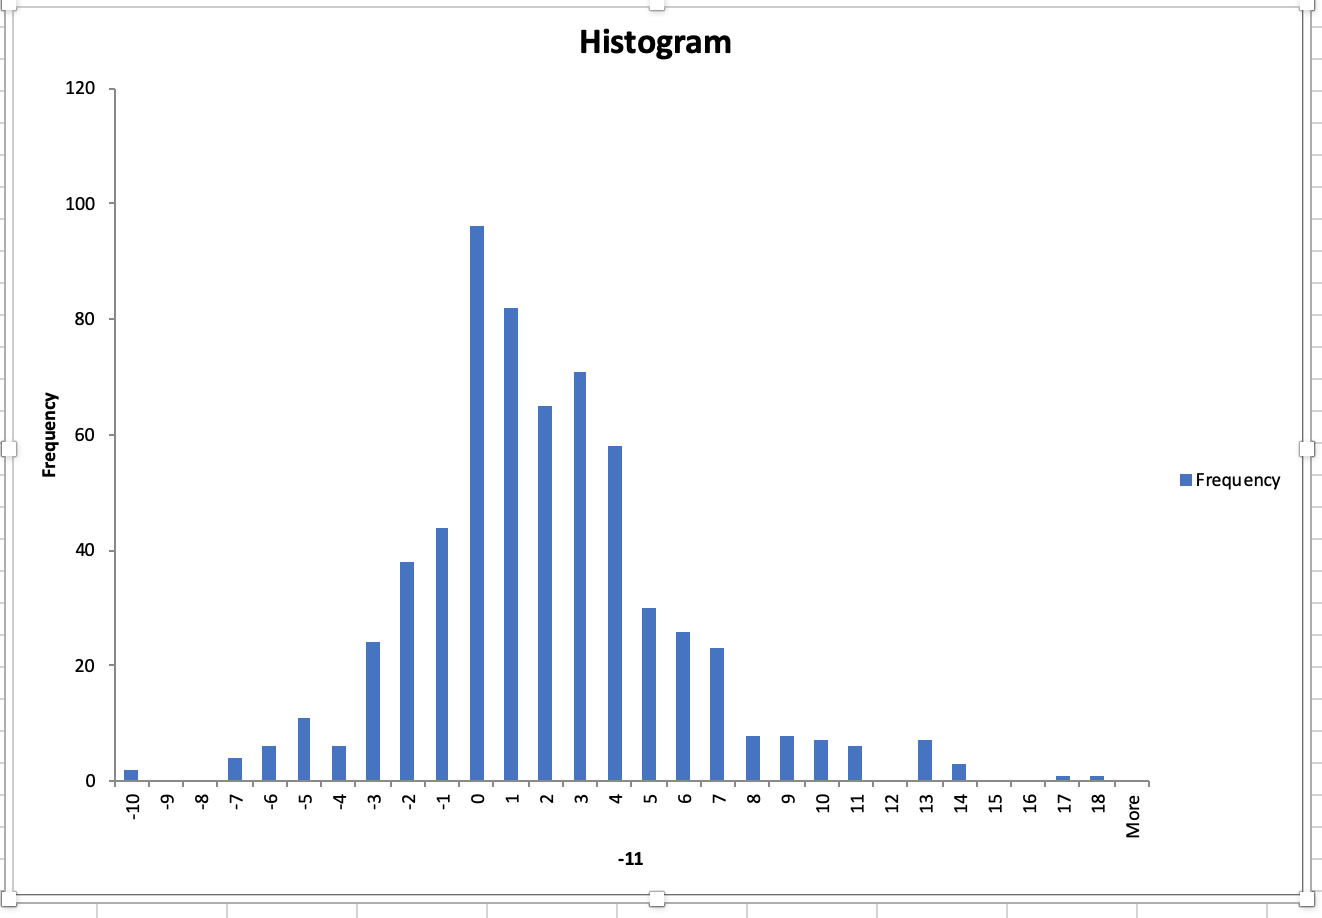
For starters, you want to make sure you have a good target (output). By that, I mean that you want a histogram that is pretty much flat across the spectrum. i.e. equal number of samples in each bin. It doesn’t have to be perfect but you don’t want 99% of the samples close to zero and 1% large positive or negative returns.
I suggest starting by using the log of the output instead of the output itself. I think you can instead use the arctan if memory serves me correctly. Second, you probably want to throw out most of the entries where the output values are around zero and perhaps duplicate the entries for the large output swings to get a better approximation of a flat histogram.
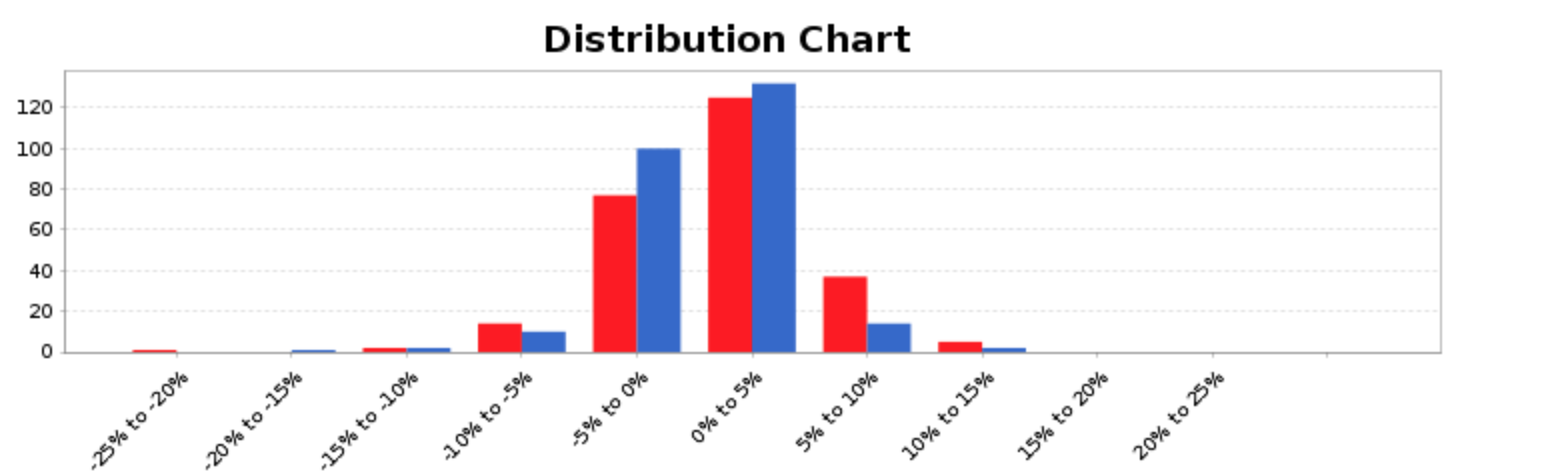
You didn’t give me the same type of graph for the validation set as for the training set so I can’t compare the two. But you should strive to get a similar histogram for both sets.
You might also want to consider changing the definition of the output. For example, instead of the %change, you could calculate a 10-sample best fit line through the weekly data. Then take the difference between the next week actual versus the trend line projection and use that as the output. Convert to log value of course.
For the inputs, you want to use timeframes that are larger than for the outputs. In other words, if your output is one week change, then your inputs should be 1-3 months change, not one week change. You also want to be more focused on intermarket and/or breadth data as inputs, again using 1-3 months lookback. Using the same time series for both input and output won’t get you too far.
Stay away from binary inputs to start i.e. moving average crossover…
Keep it simple, not too many inputs and try to work with inputs that you have experience with or know that have a chance of working. For example, you could start with Georg’s inputs to his iMarket timer. I can imagine that it might be difficult getting all of the data but you gotta do what you gotta do.
Also, minimize the number of internal nodes. Don’t create a deep neural net because all you will succeed in doing is memorize the data. The number of internal nodes should be 50% or less of the number of inputs. But the less memorization that occurs means the more averaging that occurs. That is why you want flat histograms. Otherwise, you will end up with an output that is an average, typically positive.
It is also good practice to normalize the inputs from 0 to 1 or some other limits. This way you won’t end up with an input that is off the scale in the OOS data.
As a final suggestion, you want to minimize the noise in both the input and output data. If you are working with weekly data, I suggest that you consider applying a gaussian filter on daily data. Instead of using the close one week ahead, you would use 1day3 + 4day4 + 6day5 + 4day6 + 1 *day7
Anyways, these are my suggestions that may or may not help.
Good luck
SteveA