Market Timing or Regime Identification Success?

Hi all,

I am curious whether anyone has had success with Market Timing or Regime Identification to tell them when to go long or short, or when to avoid going long or short.

I spent waaay too much time sifting through macro signals from FRED and applying all kinds of algorithms to see if I could convince myself that market timing is possible from Macro signals. I "think" there may be something there, but the signal is just much worse than I wanted. e.g., maybe helps with 30+% drawdowns... but is impossible without a lot of thrash for 20%+ moves like 1987 or COVID or even 2022.

I haven't tried HMMs for market regimes or any other algorithm yet, so I'm wondering whether anyone has opinions or evidence that Market Timing or Regime Identification is anything more than luck or curve fitting and has helped them OOS.

Thoughts?

I tested a bunch of approaches on this, and not only on U.S. markets. Globalization is here, so a lot of the same pressures show up across regions more than they used to.The main caveat is that each real crisis is driven by different factors, and plenty of what looks like a crisis in real time is not a crisis at all. Identification is the whole game. If you catch the genuine large ones you can improve the path of the book, but false positives chew up long-term CAGR. That is the part that kept showing up for me, and it matches what you saw with the FRED/macro stack: maybe useful around the 25-30%+ drawdowns, a lot of thrash if you try to treat every 15-20% move like 1987, COVID, or 2022 as a regime you must trade. If you do that the risk of overfitting is 100% real (the Universe sample of crisis with meaningful data is very limited). What worked better than hard long/short or cash/risk-on switches was slightly smoothing the curve with a few factors that tend to be common across markets, then using a modest cover—shorting something like a Russell-style ETF when those factors deteriorate. I think of it as soft market timing rather than regime identification in the HMM sense. It is not a free lunch. You usually get better control of the high drawdowns and a cleaner Sortino, at the cost of some CAGR.I would not claim it is more than a risk-management overlay that sometimes helps OOS. Hard timing and fancy regime labels were easy to curve-fit and easy to regret. The softer version was more usable, still imperfect, and still a trade-off rather than an edge that lets you skip the ugly periods for free.

I wouldn’t reach for the famous line that “this time is different.” In terms of drawdowns, each time really is at least peculiar.

Macro data is a slow sensor. It sees slow things. 2000–02 and 2007–09 were slow, macro-driven bears, and macro data saw them. 1987 and COVID weren't macro events. There was nothing in the FRED series to find, and the thrash you mention is what happens when you lower a threshold until a signal fires on things it can't actually see. That's not a flaw in the signal; it's asking it to do a job it wasn't built for.

So I split the problem. Fast, violent moves go to something convex that doesn't need to be right about when. I hold cheap, far out-of-the-money crash protection, most of which expires worthless. Signals get the other job: modulating how much risk I carry through long questionable stretches, gradually, without the drama of trying to be all in or all out.

I'd also push back on "maybe helps with 30%+ drawdowns", because that's not a consolation prize; it's the entire prize. In geometric terms, shallow or quickly-rebounding drops don't cost much to sit through. COVID round-tripped in five months. Though you don't know in real time which kind you're in, which is why the insurance is there. The drawdowns that do lasting damage to a portfolio you're living off are the ones that grind for two+ years, and that is precisely where you find signal.

2022 is the interesting one on your list, because it was catchable, just not by growth or employment data, which stayed strong all year. It showed up in rates and in price trends well before it showed up anywhere else. That's why I believe in using several sensors from different domains rather than one sensor turned up to eleven. Each kind of trouble has a data series that notices it first. A single signal that tries to notice everything thrashes by its very nature.

I can't prove it's robust rather than luck or curve fit. All I could do was use best practices: test vetted rules, keep them simple with almost no knobs, weight them equally, and write down in advance what failure would look like and what would make me retire a rule or the system as a whole. In practice, I suspect "failure" means it dings return more than I'd like, or a drawdown runs deeper or longer than I'd like — and even then my guess is I'd still prefer the experience and the result to running unhedged.

The part that makes this viable for me is that because I run protected, I lean far less on cash, bonds, or alts for ballast and carry more equity exposure than I otherwise would. I expect the modulation to cost a little return in good times and to make the bad times materially better. The extra equity exposure is what pays for the insurance.

Lastly, I'm not sure anything catches 1987, and I don't want to try. That's what the insurance is for.

Hi tgoudie000 and All,

There's a useful distinction hiding inside your question. Most of what fails out-of-sample is timing — trying to call direction and get long or short at the right moment. That's the stuff that curve-fits, because you're optimizing entry and exit parameters against a specific history. What tends to survive OOS is something narrower and more honest: risk identification. You're not predicting that the market will fall. You're recognizing when the distribution of outcomes has changed — when the left tail has gotten fatter — and adjusting exposure accordingly. That's a more modest claim, and modest claims are the ones that hold up.

Two families of measures have earned that status for me, and I'd argue they work for structural reasons rather than fitted ones, which is exactly why they don't decay.

Credit spreads. These are the single most reliable class of risk indicator I know of, and the reason isn't that bond investors are smarter than equity investors. It's mechanical. Corporate debt is a senior claim with capped upside, so its price is dominated by downside underwriting — the market prices credit off the probability of the bad outcome. Equity is the junior, convex claim on the same firm assets, so the same deterioration shows up as a small repricing in bonds and a large one in stocks. Credit is measuring the shared input with less noise.

A few spreads worth watching, and they say different things:

  • ##CorpBBB minus ##CorpAAA (the quality spread within investment grade). This is a clean read on how the market is pricing corporate risk generally, stripped of the Treasury/rate component since both legs are corporates. When the gap between BBB and AAA starts widening, investors are demanding more to step down in quality — a change in risk appetite, not just a change in rates.
  • High yield vs. Treasuries (the HY OAS). This is the more sensitive gauge. ##CorpJunk is where marginal risk appetite shows up first, and option-adjusted spread already nets out the rate move so you're seeing pure credit risk premium.

Two cautions that will save you a lot of false signals. First, the level is nearly useless as a trigger — spreads are highly persistent and can sit tight for years. It's the rate of change and the percentile rank against a trailing window that carry the information. Second, watch the composition of a widening. The 2015–16 blowout was concentrated in energy and commodity issuers after oil collapsed; it looked alarming in the aggregate series but never generalized to broad corporate solvency, and equities recovered. A spread move driven by one sector is not the same signal as a broad one.

Market breadth. Breadth deterioration is the other structurally-grounded warning, and the logic is simple: major tops are almost always preceded by a shrinking group of stocks carrying the index. The averages make new highs while participation quietly narrows. The measures that capture this — percent of stocks above their 200-day moving average, the advance-decline line, new-high vs. new-low counts, the percent of members in their own uptrend — will diverge from the index before the index rolls over, because the selling starts underneath the surface before it reaches the cap-weighted top line. You very rarely get a serious decline without breadth deteriorating first. (You do sometimes get breadth deterioration without a serious decline — see the false-positive point below.)

The honest caveat on both: these are confirming and conditioning variables, not standalone triggers. Each will fire on episodes that resolve without a real drawdown, so any one of them alone will whipsaw you. Their value is in combination and in what they gate. I don't use them to go short. I use them to decide when to reduce gross exposure, tighten position sizing, or simply stop adding risk — the "avoid going long" case in your question. Used that way, as a regime state that scales exposure rather than a signal that flips it, they've held up out-of-sample for me in a way that direction-calling never has.

Both of these are available as data series on P123, and the fact that you can point them at your own universe rather than a generic index is worth exploiting — index-level breadth is fine, but breadth measured across your holdings is more informative.

Agree with all Chawasri said, and said better than I could have, especially the risk-identification framing.

To me, it's a similar concept to using a ranking system to score stocks.

I run four families of measures from different domains and am looking at sub-measures within each. More measures does help with whipsaw, with the qualifier that they have to be measuring different things; two versions of the same sensor just flicker together (fine enough to consider in a family composite). Case in point: two of my measures have been flip-flopping lately, in opposite directions, and net exposure has barely moved. That's the composite doing its job.

The other thing that changed when I moved into microcaps: the first x% of risk reduction is expressed by shorting Micro Russell 2000 futures (M2K) against the book, reducing net exposure, and I only start selling holdings once enough of the measures agree. In larger caps, selling the holdings was fine. In thin names a false alarm costs the spread twice, whereas a futures round trip costs almost nothing. Behaviorally it's also easier: I hold the positions longer and let the short do the flinching. I would have preferred this approach with my large cap holdings, too, but had never considered it until microcap slippage/friction came into my world.

"With four parameters I can fit an elephant, and with five I can make him wiggle his trunk." [1]
-Von Neumann

So I would be cautious with HMMs, but I believe they are probably the best way to look at trying to time the market. I think things like trying a bunch of moving averages is just literally fitting the curve with a large number of degrees of freedom. And at times one could make a crude fit of an elephant-shaped-curve with moving averages.

HMMlearn uses clustering which limits your degrees of freedom. So maybe you would not be wiggling the trunk at least. That is a real benefit for reducing overfitting.

And ScifoSpace has a great point too:

Not only are the samples limited but the next crisis will probably be different. For example, it is easy to create an HMM that does well in 2008 by making it go to TLT. But bonds were not a safe-haven 1973-1974 or in 2022. 1973 - 1974 cannot be tested with P123. Again as @ScifoSpace has said the sample size is a bit too small and the future crises will look different than the historical crises.

And maybe the most important point of all is that transaction costs are a serious problem. I think it will never work for ports if you are selling or buying stocks. For ETFs and perhaps with futures maybe there is something....

So to avoid overfitting to market regimes, one might try just pricing data without a lot of FED data to start:

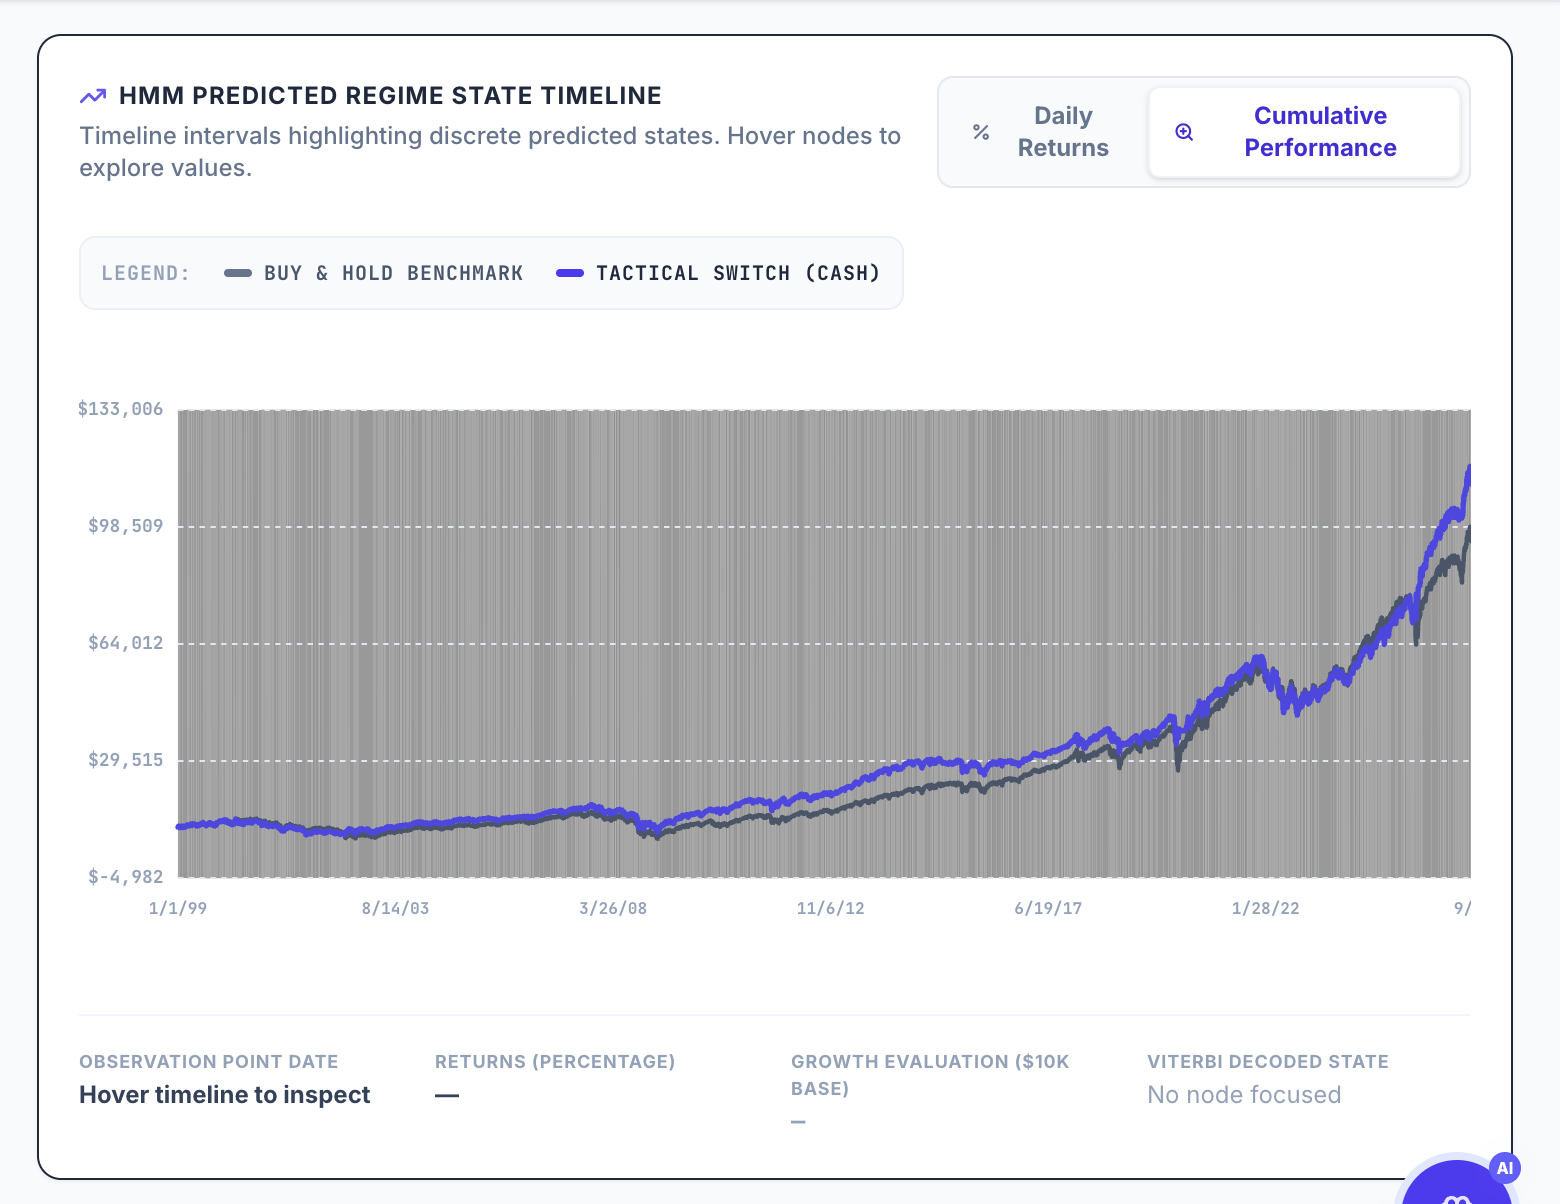
Here is an HMM for SPY using just pricing data:

This is a fair test with a signal on Friday that trades on Monday, 0.05% slippage, and the HMM was done as a walk-forward--training only on data available at the time.

Personally, I think the results are pretty marginal with this example and I would not use this. One might do better with FED data, but as ScifoSpace suggests, the risk of overfitting is real.

Has anyone tried allocating to structurally uncorrelated alternative ETFs?

BTAL (AGFiQ US Market Neutral Anti-Beta Fund)

  • Mechanics: Systematically goes long low-beta stocks and short high-beta stocks in a dollar-neutral format.

  • Regime Fit: It provides a pure equity-based hedge during market panics without taking on interest rate risk. When the broader market sells off, high-beta typically underperforms low-beta, generating a negative correlation to SPY exactly when you need it most, without the drag of cash.

DBMF (iMGP DBi Managed Futures) & CTA (Simplify Managed Futures)

  • Mechanics: Both utilize trend-following strategies across multiple asset classes (equities, rates, currencies, commodities). DBMF attempts to replicate top-performing CTA hedge funds via futures, while CTA focuses specifically on a suite of trend models.

  • Regime Fit: Managed futures shine during prolonged, inflationary bear markets where both stocks and bonds suffer simultaneously. Because these funds can dynamically short bonds or go long commodities, they mechanically adapt to the current regime rather than relying on a static inverse relationship.

Blending these instruments allows a portfolio to maintain lower sensitivity across dramatically different market regimes. It shifts the burden away from building hyper-tuned timing signals that risk curve-fitting past crises, and toward holding assets with absolute structural non-correlation.

Unfortunately, there is no free lunch they reduce returns but they also reduce volatility and drawdowns.

A quick look at its chart shows that BTAL might be an excellent way to go broke. It has lost 52% of its value since its launch in 2012 (and -43% since mid-2025). How would you use it in a port or sim?

That is a completely valid observation if you evaluate BTAL in isolation. It is a slow bleed—much like paying continuous premiums for catastrophic insurance. Its utility isn't in its standalone absolute return, but in how it alters the risk-adjusted metrics (Sharpe, max drawdown) of a broader portfolio.

Volatility Harvesting (The Rebalancing Premium) Because BTAL is structurally negatively correlated to the broader market, combining the two creates a systematic rebalancing engine. During a sustained bull market, equities drift higher while BTAL decays; you periodically rebalance by harvesting equity gains to replenish the BTAL allocation. When a severe market shock occurs, BTAL rapidly appreciates as high-beta stocks crash harder than low-beta ones. You then sell the spiked BTAL to buy equities at fire-sale prices.

Capital Efficiency and Leverage BTAL is frequently paired with leveraged equities (such as UPRO) or highly concentrated, high-beta stock screens. Instead of a traditional 60/40 stock/bond split, an allocator might run a more aggressive equity book while using a 10–15% BTAL allocation to aggressively dampen the portfolio's overall beta. The hedge smooths out the volatility drag of the equities, allowing you to take on more risk in the primary growth engine.

Replacing Cash and Duration Risk Bonds carry duration risk (as seen in 2022) and cash is a continuous inflationary drag. BTAL provides a pure equity-based hedge disconnected from interest rates. Even if it loses a few percentage points annually, a small allocation can reduce maximum portfolio drawdowns more effectively than holding a large cash position, thereby freeing up more capital for alpha generation.

In a P123 simulation, BTAL should never be evaluated as the primary engine. It is best modeled either as a fixed 5–15% allocation to explicitly target a higher Sharpe ratio, or as a dynamic regime-filter overlay that scales in only when specific volatility metrics or moving averages are breached.

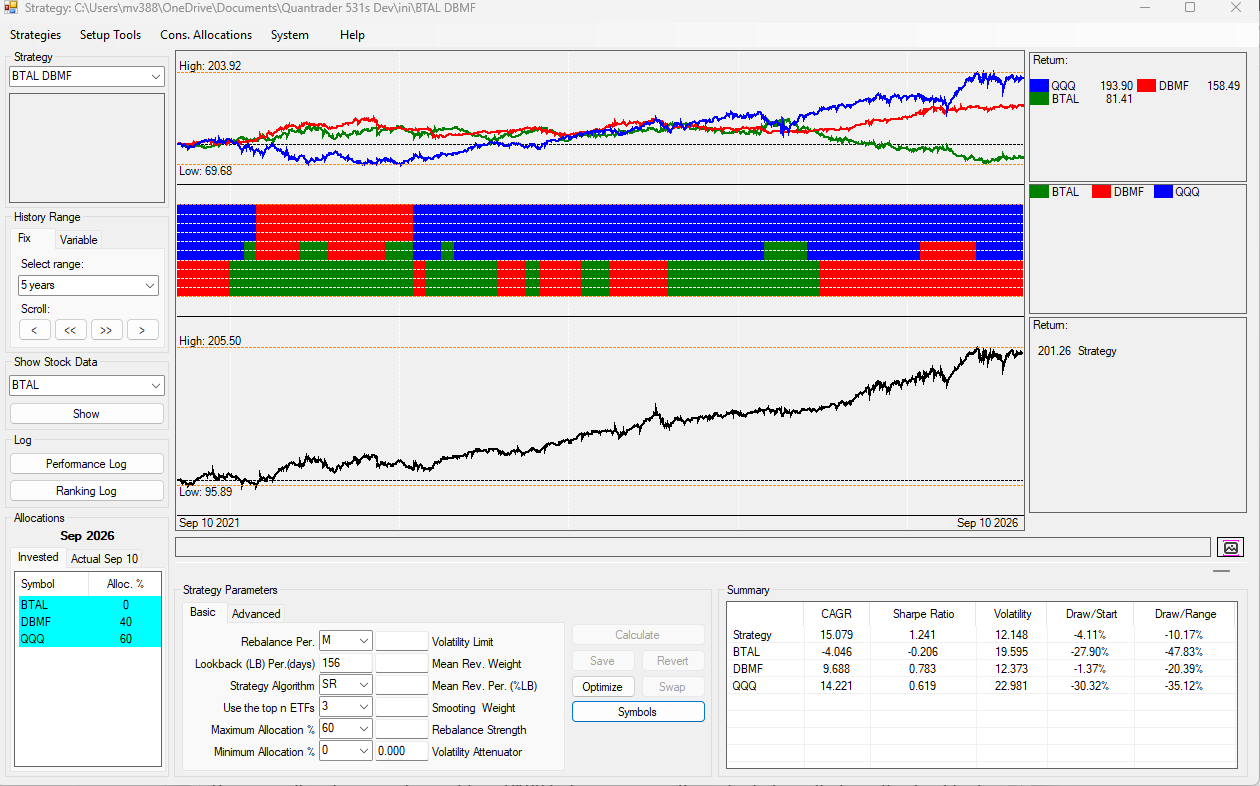
You can also use it by dynamically allocating BTAL, DBMF and QQQ to achieve almost the same return as QQQ but with half the volatility and 1/3 the drawdown and 2 times the sharpe ratio of QQQ. These are backtest results so I would not think the OS would be the same but it shows what can be done.

Hi **mv388158,

Thank you for that explanation. I'm intrigued. Do you have a working strategy that you can share? Or even share a screen capture of your port's summary section? Thank you.**

Using P123 your only choice would be to allocate evenly across all three assets in a book. The results achieve a reduction in drawdown, vol and return. You should be able to do this your self. Dynamic allocation is not possible in P123 but you can see the potential results from this backtest:

Again these are not actual results and most people on P123 do not believe in dynamic allocation. The only verified Dynamic allocation is 42 Macro and they do not use BTAL. The implementation of BTAL in a portfolio is not easy since your return is going to come down but I think it is a useful tool for some people.

I wanted to note that a system built to assess market risk is entirely doable in Portfolio123. Using Custom Formulas and the Aggregate Series section to build a multi-factor system is the correct approach.

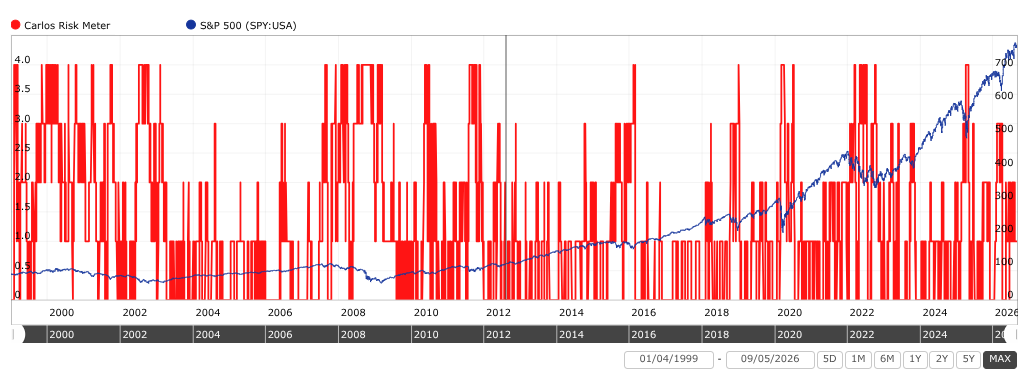
Kurtis Hemmerling has a good example (for free) in his Group, called Hemmerling Models. The series assesses six different risk measures, including Credit Spreads, Breadth, the VIX term structure, and Standard Deviation. You can see it here:

https://www.portfolio123.com/app/series/summary/17621?st=1&mt=8

Kurtis uses a level of three or higher to signal high market risk, which should trigger a user to reduce equity exposure. I use a different combination of more factors myself, but the possible combinations to build your own Risk Meter is nearly unlimited in P123, especially since we can import outside data sets.

FYI, the Carlos Risk Meter is currently (Sept. 11, 2026) at 2.

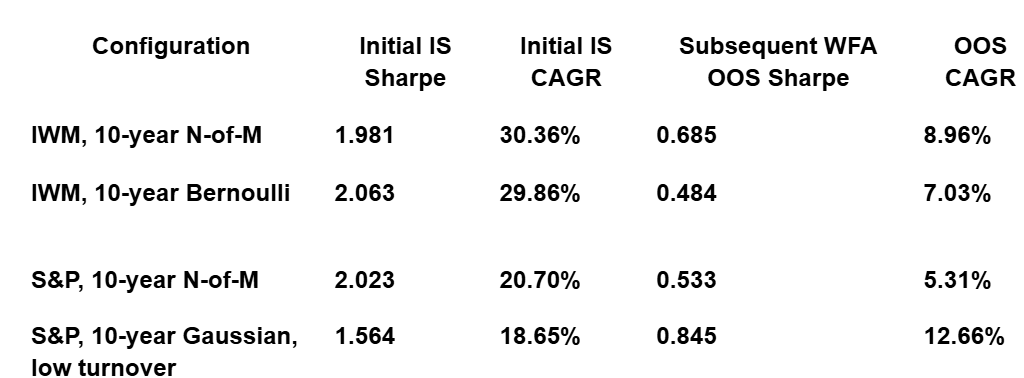
This exactly matches how I tried to build a macro timing model. I use N-of-M series and triggers, and I use a WFA each year so that, as new macro series come online, I can incorporate them. And my results look very similar; e.g., it's choppy AF. And unusable with P123 because you are constantly dumping and rebuying assets. I'd have to come back to hedge on hedge off if that helps; I haven't run that analysis yet.

Without more details, I can't understand how you build your smoothing model. I've tried similar approaches with mixed results. The simplest would be a 10-12 Mo SPY SMA and going 0.5-0.0 Beta stocks as a hedge when SPY is above/below the SMA. This absolutely gives better drawdowns with lower CAGR, but it's still kind of mid for me and has been choppy post-2010, so I'm afraid it's curve-fitted.

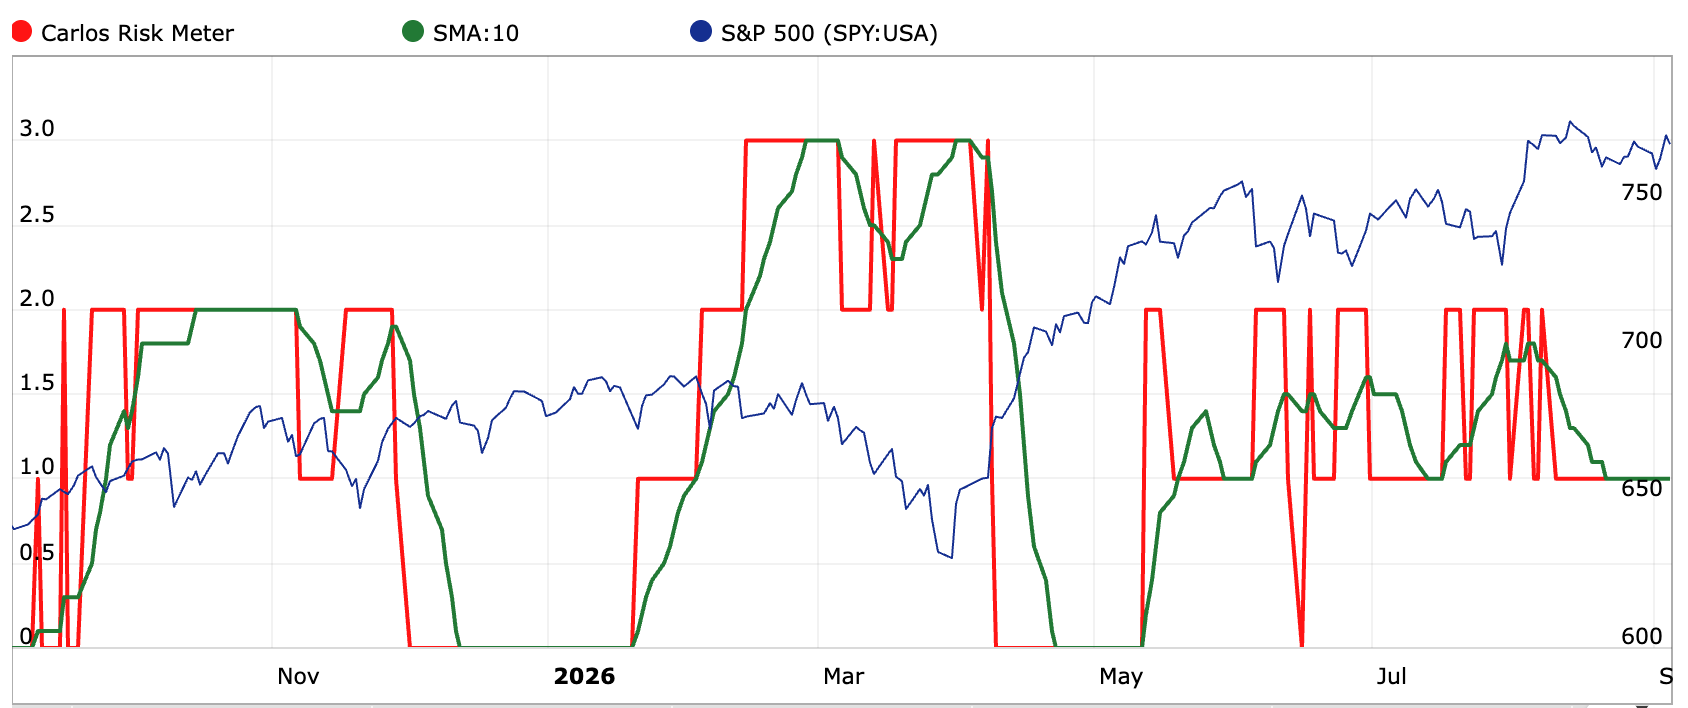
tgoudie000 - Yes, the raw signals can be very volatile. Try adding a simple 5 or 10-day SMA or EMA to the raw signals. I think you'll find that will smooth them into a much more consistent and useable signal. The SMA(10) is shown here in green:

The Carlos Risk Meter uses six inputs. My Risk Meter uses 10, and I’m experimenting with adding a couple more. If you have a proper set of valuable signals, they should tend to confirm one another that market risk is authentically increasing.

If you just want to trade in and out of a market-following ETF (such as SPY) without the significant drawdowns that accompany notable increases in risk, you can use a rule like this:

Eval(SMA(10,0,GetSeries("Carlos Risk Meter"))>=3,ticker("BIL"),ticker("SPY"))

Of course, you can also use this approach to determine when to be invested in a portfolio of stocks ranked by your favorite set of fundamentals, or to hold cash, thereby avoiding significant drawdowns.

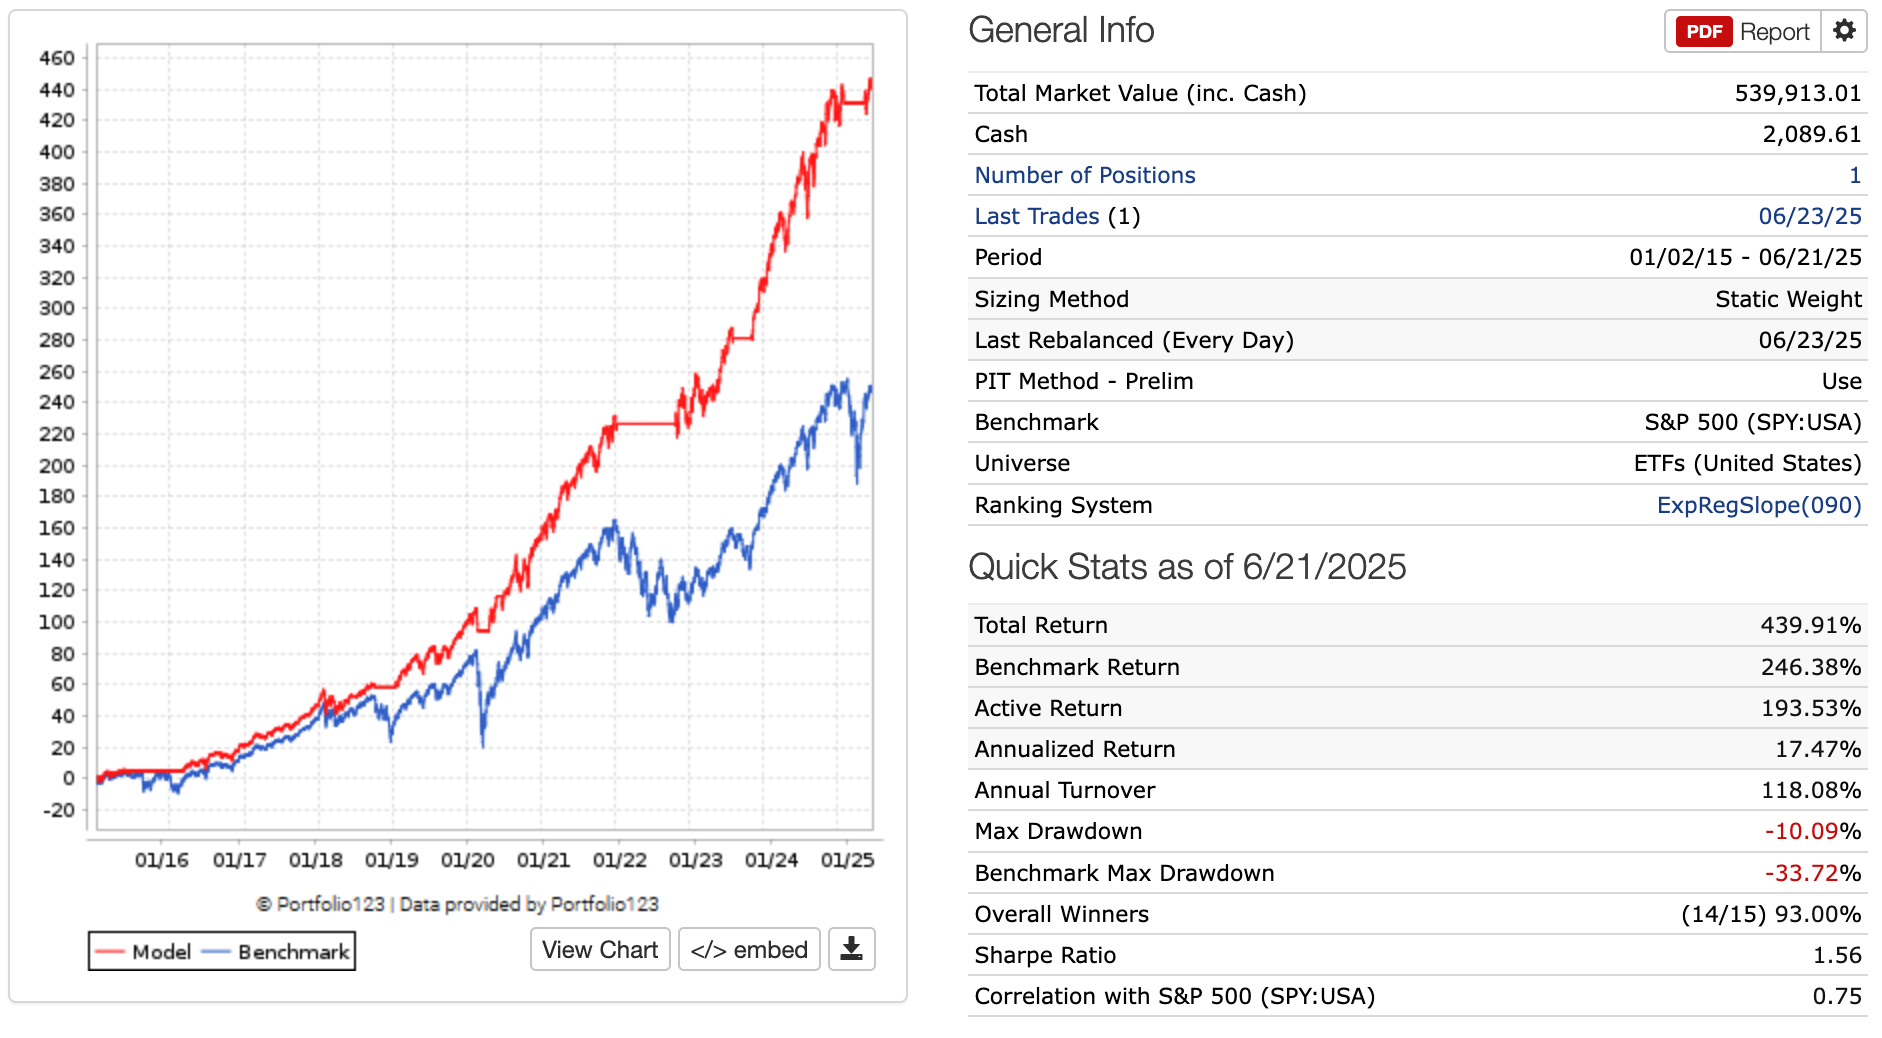
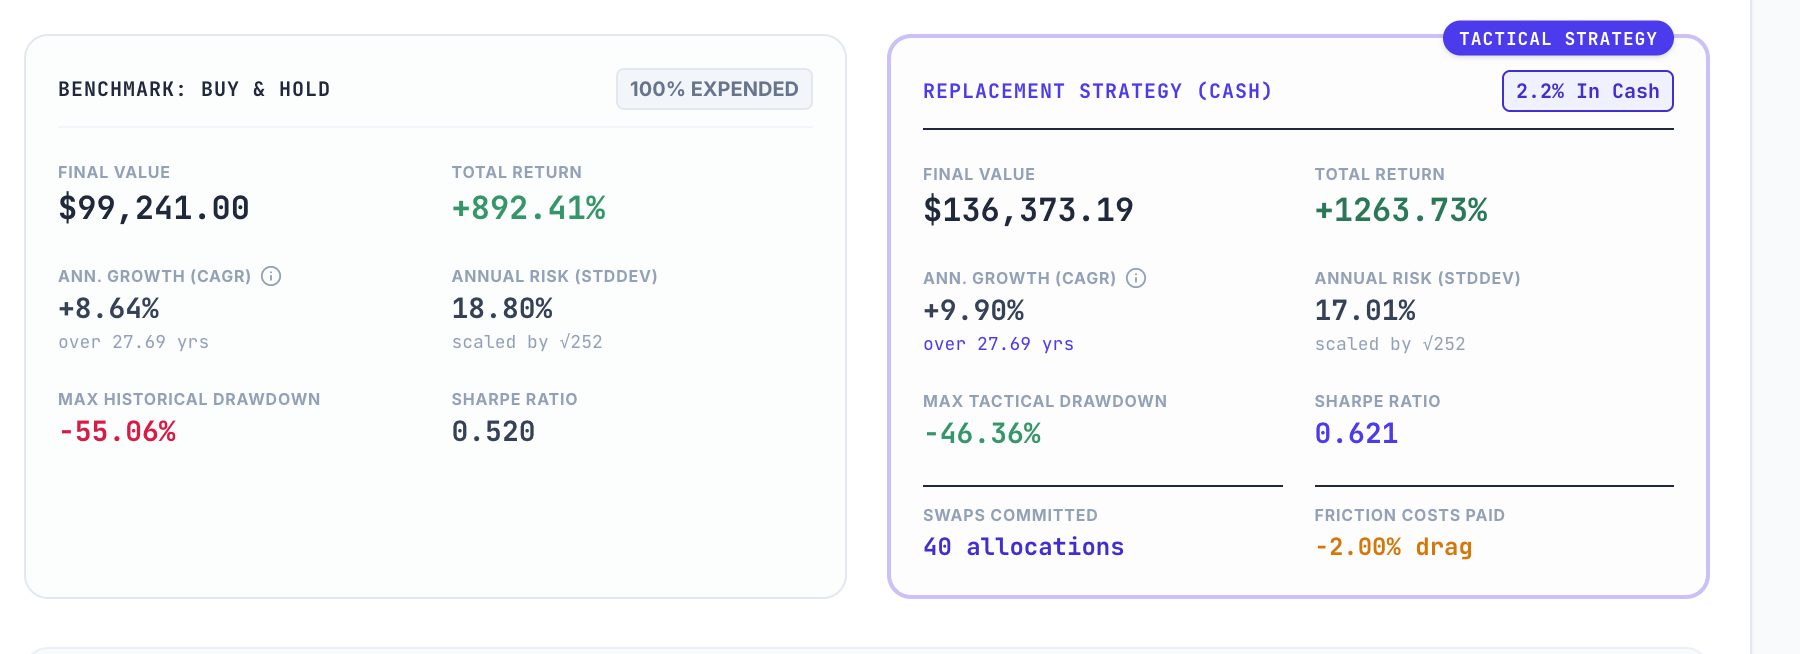
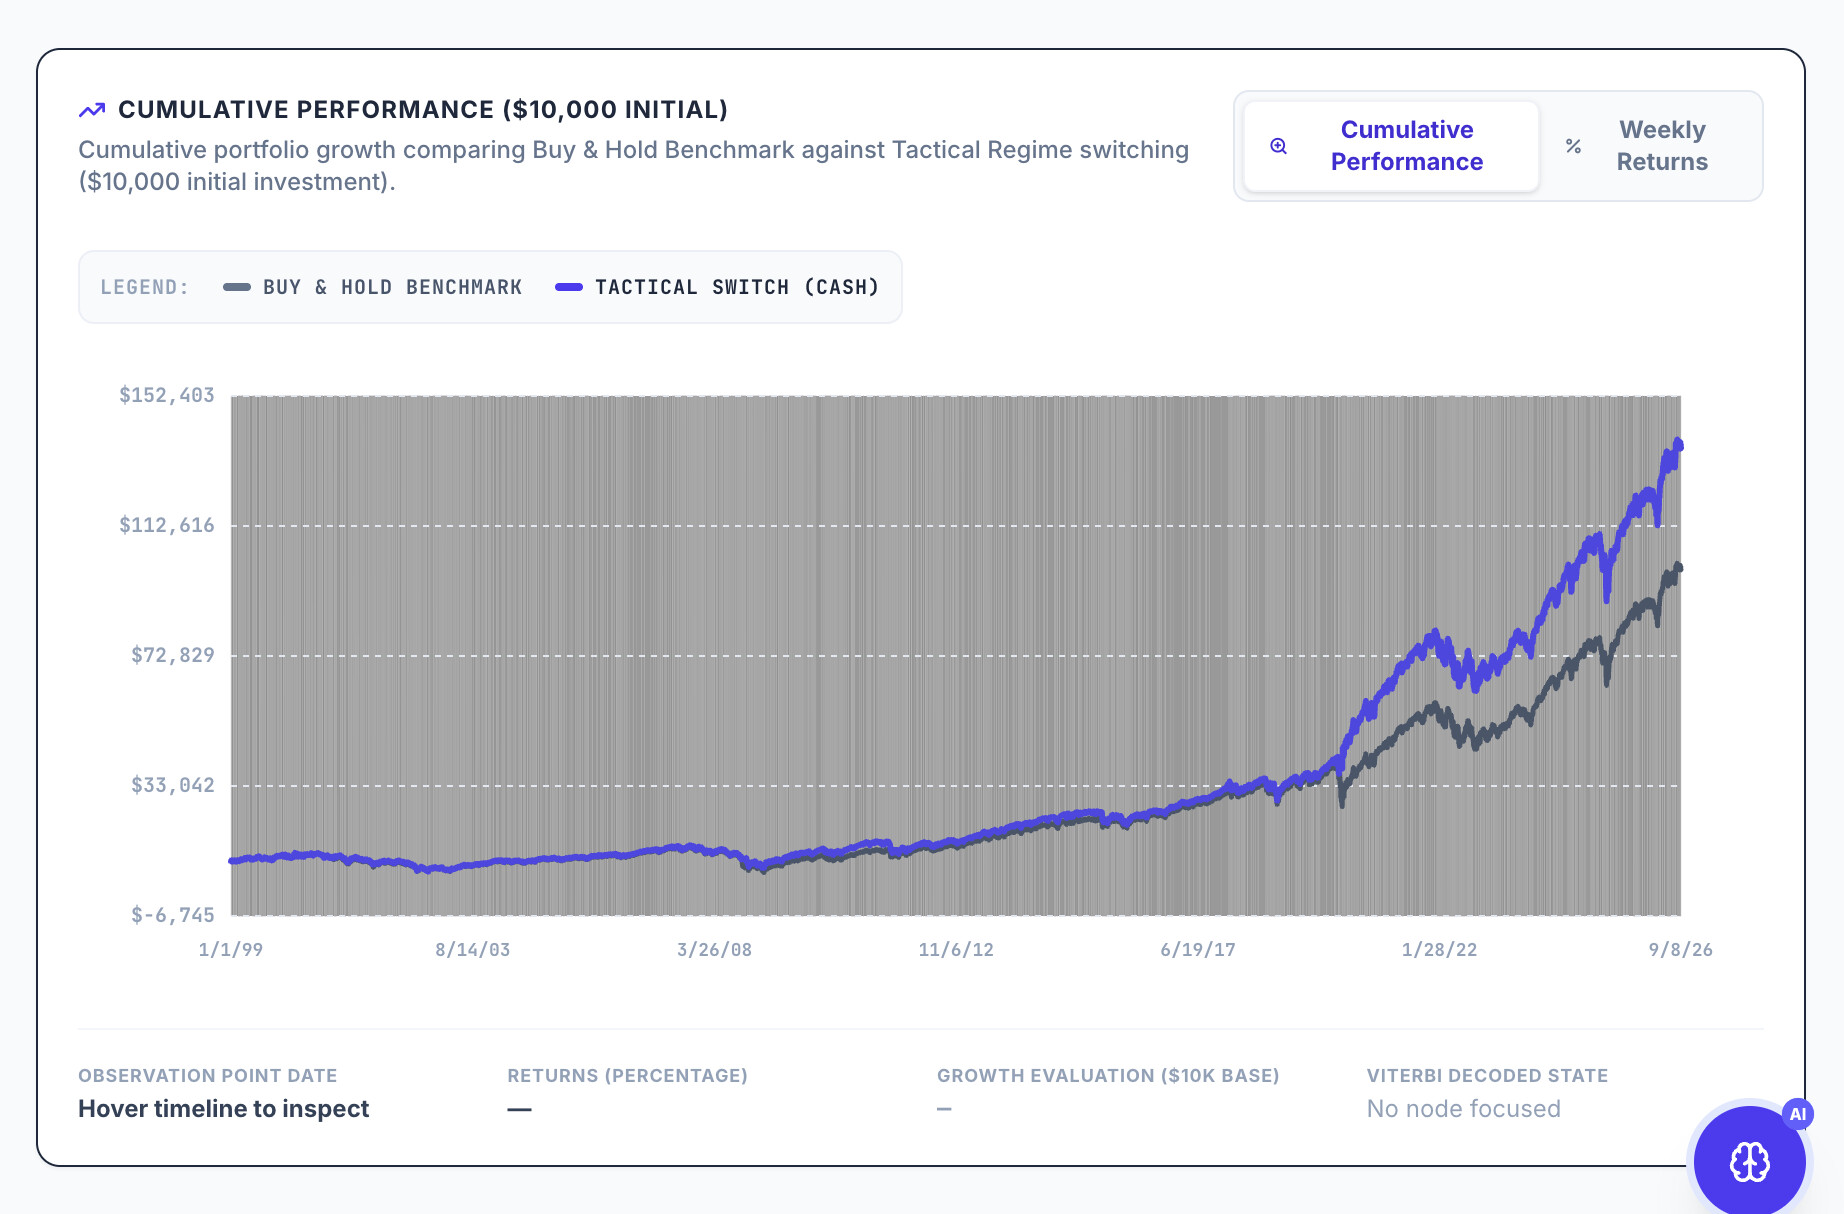
One of my risk-assessment systems, which is a bit more sophisticated and has more components, can be demonstrated with a risk-on ETF (SPY) and a risk-off ETF (BIL), producing this performance:

This approach ensures you don't worry about losing a consequential amount of money. I’m also working on a system that will dynamically adjust market exposure each weekend (on a percentage basis), rather than using a blunt on/off risk-assessment switch.

Here is a Gaussian Naive Bayes model which sounds complex but is similar to N-of-M series and triggers.

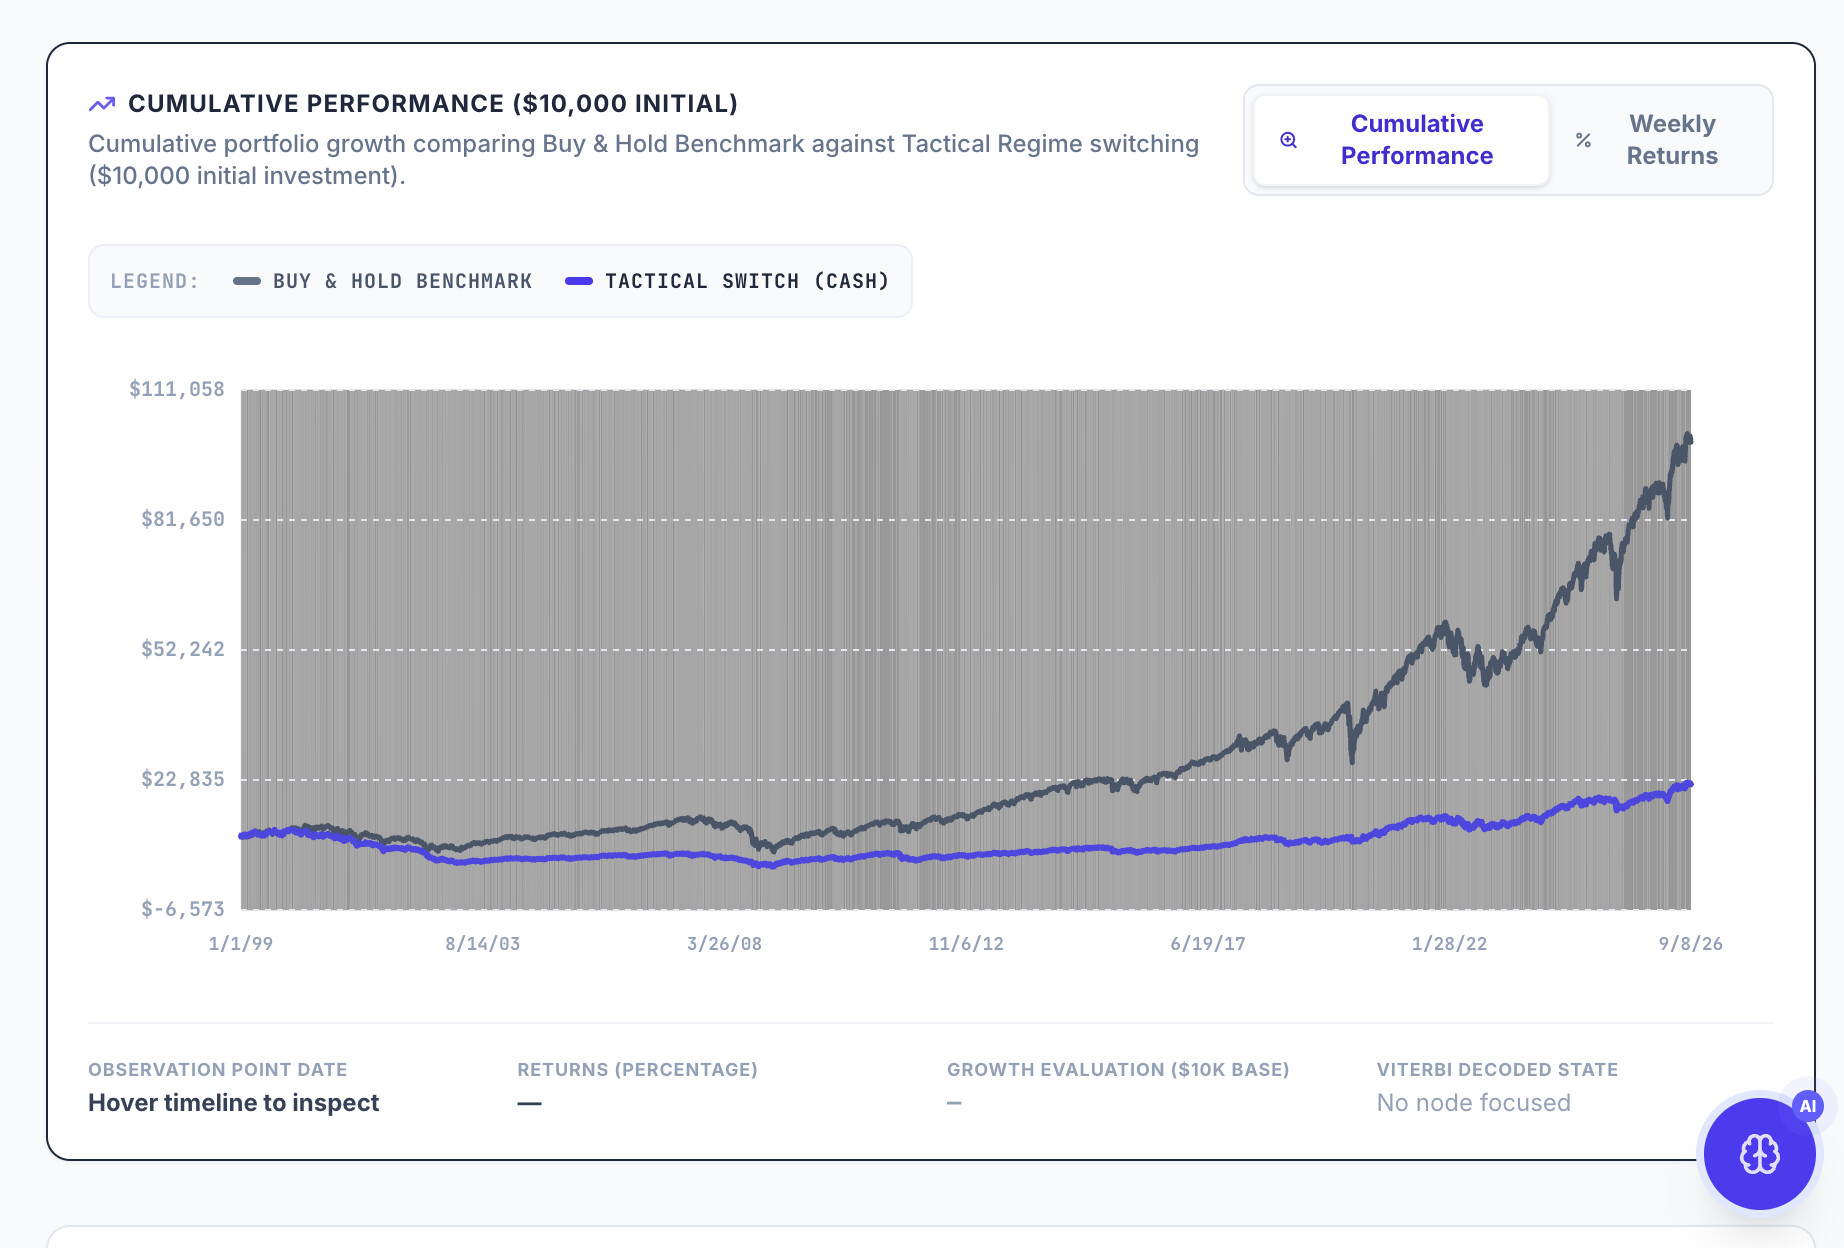
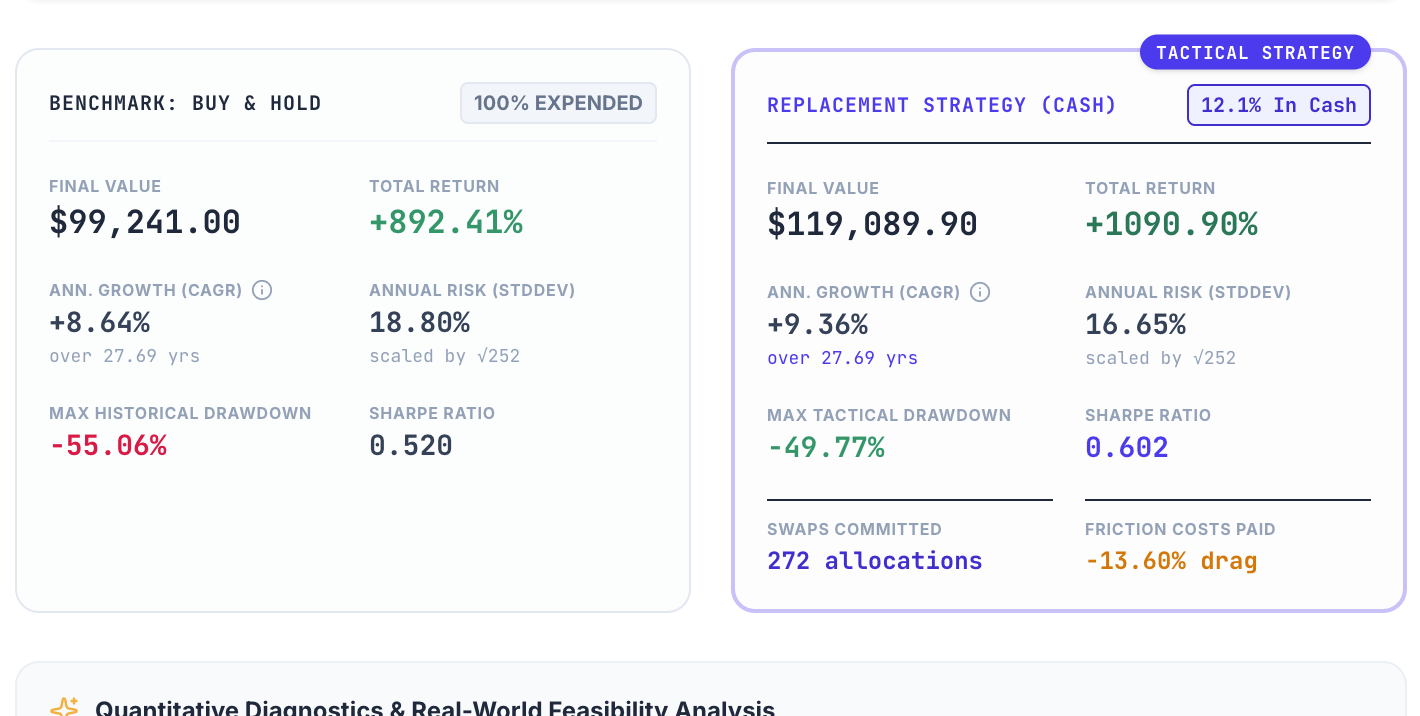
The full backtest seems to work to some degree with just return data. The app allows you to add features for a multi-feature Naive Bayes model and the model will probably benefit from adding additional PIT time series. This could include VIX, spreads etc. This is lagged with a signal based on the Friday close and traded on the Monday close with slippage:


But here it is as a walk-forward backtest and no future data leakage:

You can look at this yourself with an updated app that does HMM and Naive Bayes. It may need to be forked for further optimization: https://hmm-return-state-predictor.ai.studio

But this is a fair way to see the difference of a backtest over the entire period with data leakage vs a walk-forward backtest without data leakage.

My personal view is that there are some effective timing strategies. I have used timing myself. But one should have modest expectations (including the effect slippage can have on a model). And unless someone can say a Naive Bayes backtest is an exception for some reason, then a backtest over the full period (without some sort of safeguards against data leakage or regularization or something) is at risk for overfitting and performing poorly out-of-sample.

I have linked to this app previously but now it has a Naive Bayes option. They can be done as a backtest trained over all the data or as a walk-forward backtest: https://hmm-return-state-predictor.ai.studio

Modest expectations are exactly the right wording. The reason I "sort of trust" my timing reacting methods is that the effect is modest and there is a trade-off.

That is also why I "sort of dislike" the methods. The composite won't always be right; the components will often disagree and whipsaw, and sometimes you will be starkly out of step with the market, which can be tough to commit to. The old adage that "it's ok to be losing your shirt as long as all your friends are losing theirs, too" — you need to be OK on your own path, at times for better, at times for worse.

I believe that risk mitigation should not be a liability. It should be additive in nature. The catch is where you measure it. Judged on its own, the composite is a bit wishy-washy and not a clear-cut winner by that standard: it typically sacrifices some CAGR, reduces drawdowns quite a bit, and improves risk-adjusted metrics. Judged at the portfolio level, it looks better because the smaller drawdowns let me hold a much larger allocation to the strategy than I would dare unhedged — that sizing is where the additivity shows up. And if you are drawing on the account, it isn't a "may matter more": sequence risk makes drawdown reduction directly additive to terminal wealth, and that is my situation.

The SPX crash protection has to be held to the same rule. Judged on its own, a put overlay is a known annual bleed, and the long-run record of systematic put buying is not impressive. It passes the standard only through the same mechanism: the known cost buys the right to run the portfolio hotter in good times and clips the left tail in crises with an influx of cash when assets are at depressed prices — provided it is executed and monetized well, which is at times easier said than done.

I've also explored many CTA-type funds, DBMF, CTA, and especially KMLM, which is particularly interesting because it holds no equity exposure and has a longer backtestable history in index form. Trend-following tends to help in crises, but only the ones that trend — excellent in 2022, largely a bystander in March 2020. I keep exploring this, but always revert to modulating my exposure instead, because it lets me be more net long more often, rather than carrying a massive tranche of KMLM. But it is an interesting fund, especially recently.

The puts are the mirror image: a contractual payoff in a fast crash, not much help in a slow grind. But the slow grind is what the reacting composite is for, and the fast, gap-down crash is the one thing nothing else in my portfolio can be counted on to cover.

This is the approach I use in one of my accounts where I have a shorter investment horizon and I might want to tap into some cash at some point for whatever reason. This account is not what I use to live on, so I want a better return than the ~3-5% or whatever I could get in a money market or treasury bill. I want to be in equities to beat inflation, but I want to err on the side of preserving capital over maximizing alpha in this particular lump of money. I gradually blend in and out of market exposure based on a collective sample of risk flags rather than risk getting whipsawed by an over-reliance on 1 market timing factor.

Let's say you have 5 risk signals. Create an Eval function for each signal that raises a 0 or 1 flag for each of them.

So in this case we'll use unemployment rate as a risk flag.

$Flag 1 = Eval(EMA(2,0,#UNEMP)<=EMA(2,3,#UNEMP),0,1) //Unemployment Risk Flag

If have four other risk flags like this, so then aggregate all 5 market risk flags out into one cash position Function ....

$CashPostion = $Flag1 + $Flag2 + $Flag3 + $Flag4 + $Flag5

Let's say hypothetically In a perfect risk on environment I wanted to go 90/10 portfolio of equities/cash. In total risk off environment I wanted to go 60/40.

In my portolio Buy Rules utilize the CashPct function

Eval($CashPosition=0,CashPct>9,Eval($CashPosition=1,CashPct>14,Eval($CashPosition=2,CashPct>19,Eval($CashPosition=3,CashPct>24,Eval($CashPosition=4,CashPct>29,Eval($CashPosition=5,CashPct>34,CashPct<39))))))

Reverse the operand logic n the Sell Rules...

Eval($CashPosition=0,CashPct<9,Eval($CashPosition=1,CashPct<14,Eval($CashPosition=2,CashPct<19,Eval($CashPosition=3,CashPct<24,Eval($CashPosition=4,CashPct<29,Eval($CashPosition=5,CashPct<34,CashPct<39))))))

One could break out the Carlos Risk Meter into individual components and blend in and out of cash as each one of them flips.

Of course you can put the cash position into whatever risk off hedge you wish. But just in the spirit of the simple heuristic "The best way to hedge is to own less of the thing you want to hedge against" it does the trick.
Hi **InmanRoshi -
**
That's a very interesting and well-considered approach to adjusting exposure. Thank you for sharing your ideas. I'm going to set up a test implementation of your approach and see how it works for my needs. Much appreciated!

Chawasri,

You may have utter gold here, but this looks dangerously curve-fitted to me. Have you run your rules OOS without optimizing for the current market? e.g., can you apply the same rules from 2000 or 2005-2015, and do you get similar results? I've never seen a timing system provide that type of Sharpe OOS that didnt have some lookahead bias or picked from the best OOS, and I've run a lot of simulations. I could just be the stupid one, however.

Furthermore I also tested your SMA to the N of M systems it helps smooth the results but usually at the cost of performance which I think is reasonable but my results are still worse than B&H for CAGR ...

Finally Jrinne, I dabbled a bit with both a Gaussian and a Bernoulli Bayesian configuration... neither performed well enough OOS for me to be convinced either would help, perhaps you've had better luck?