Here are a few links from CXO Advisory about the results from overfitting in-sample data (they make one page summaries from well known academic papers.)
Nice table and nice method! Thank you for sharing!
I appreciate that you have done this both in-sample and as a walk-forward analysis (WFA)—showing that one can get strong results in-sample that may not hold up out-of-sample. And nice addition of the Bernoulli method!
To answer your question directly, I have not found anything I could use with Naive Bayes. I actually looked at Naive Bayes methods again—adding it to the app above—mainly because of this thread and Naive Bayes' similarity to N-of-M. But I have only looked at pricing data with Naive Bayes recently.
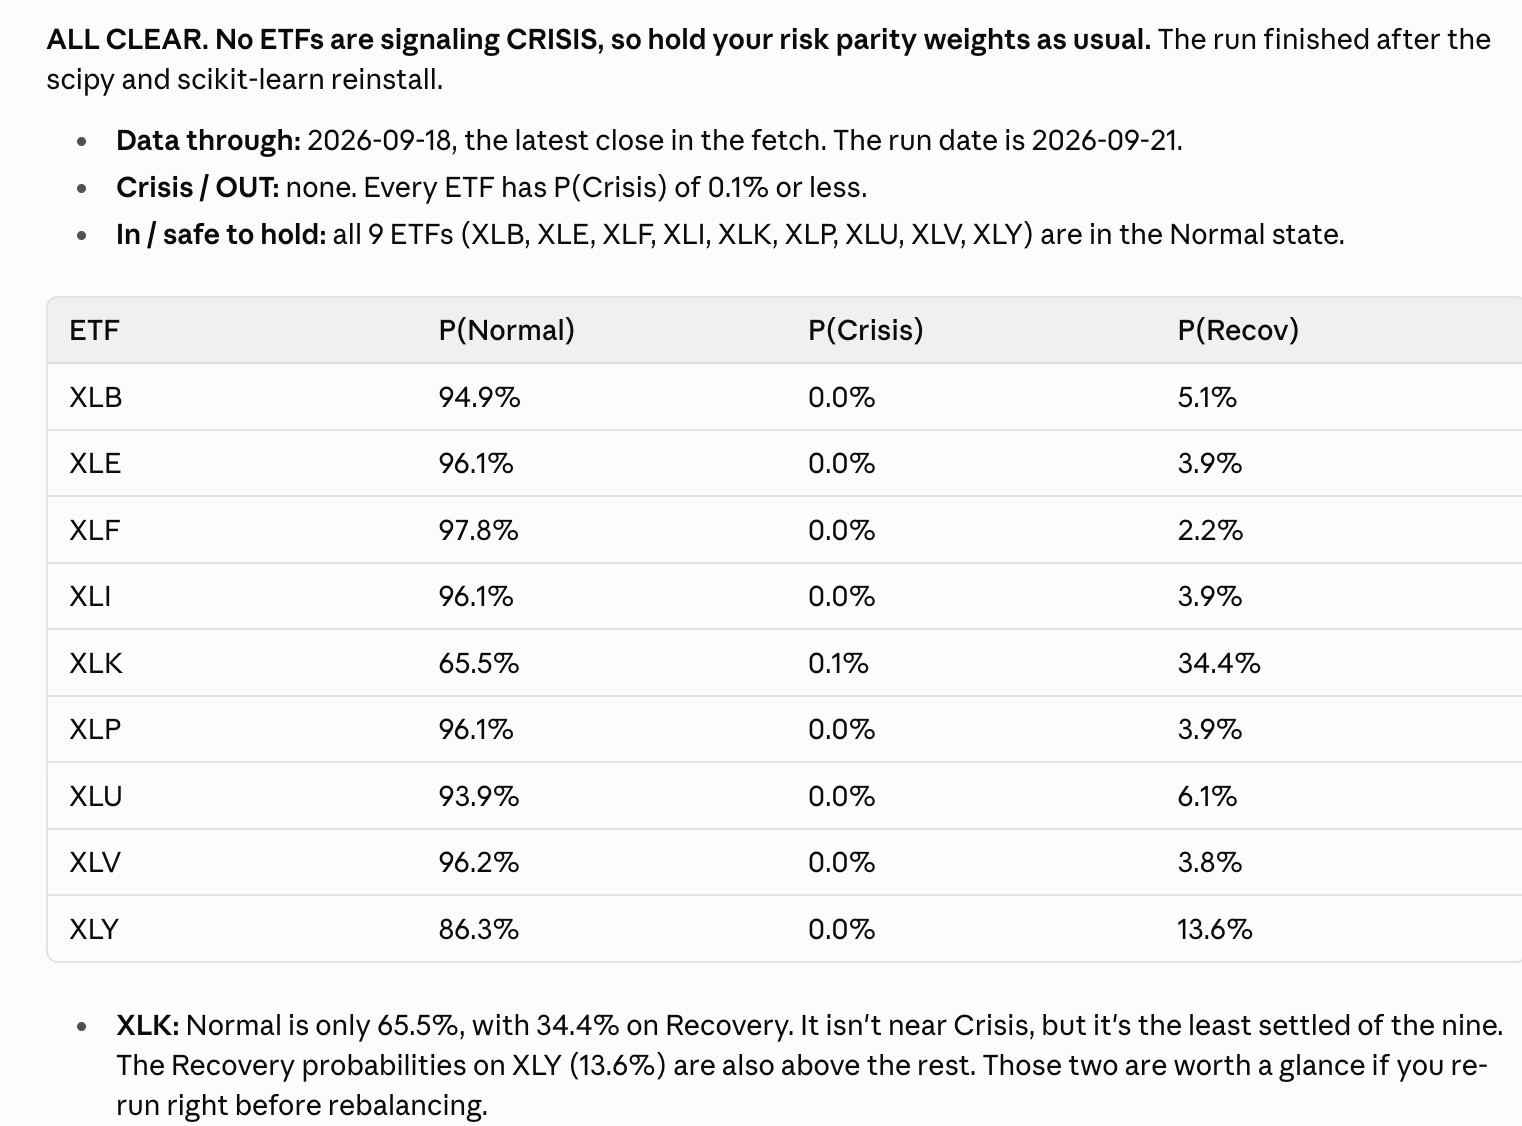
Most of my recent work has been with HMM. I found a model that seemed to work BUT the results were not statistically significant, and after a long discussion with Claude, I decided it could easily be overfit. It worked particularly well in 2008, but I suspect it was fit to that particular market regime. And again, it was not statistically significant, so maybe it was all just luck. There was a multiple comparison problem in that I added time series and adjusted the number of hidden states to get my final results. So if one uses a Bonferroni correction accounting for the number of trials, it was not even close to statistically significant.
Your initial question in your first post was whether anyone has had success with out-of-sample results.
My HMM has not given me a signal to move out of any sectors (SPDR ETFs) since inception. So nothing to report on true out-of-sample results other than no false positives so far.
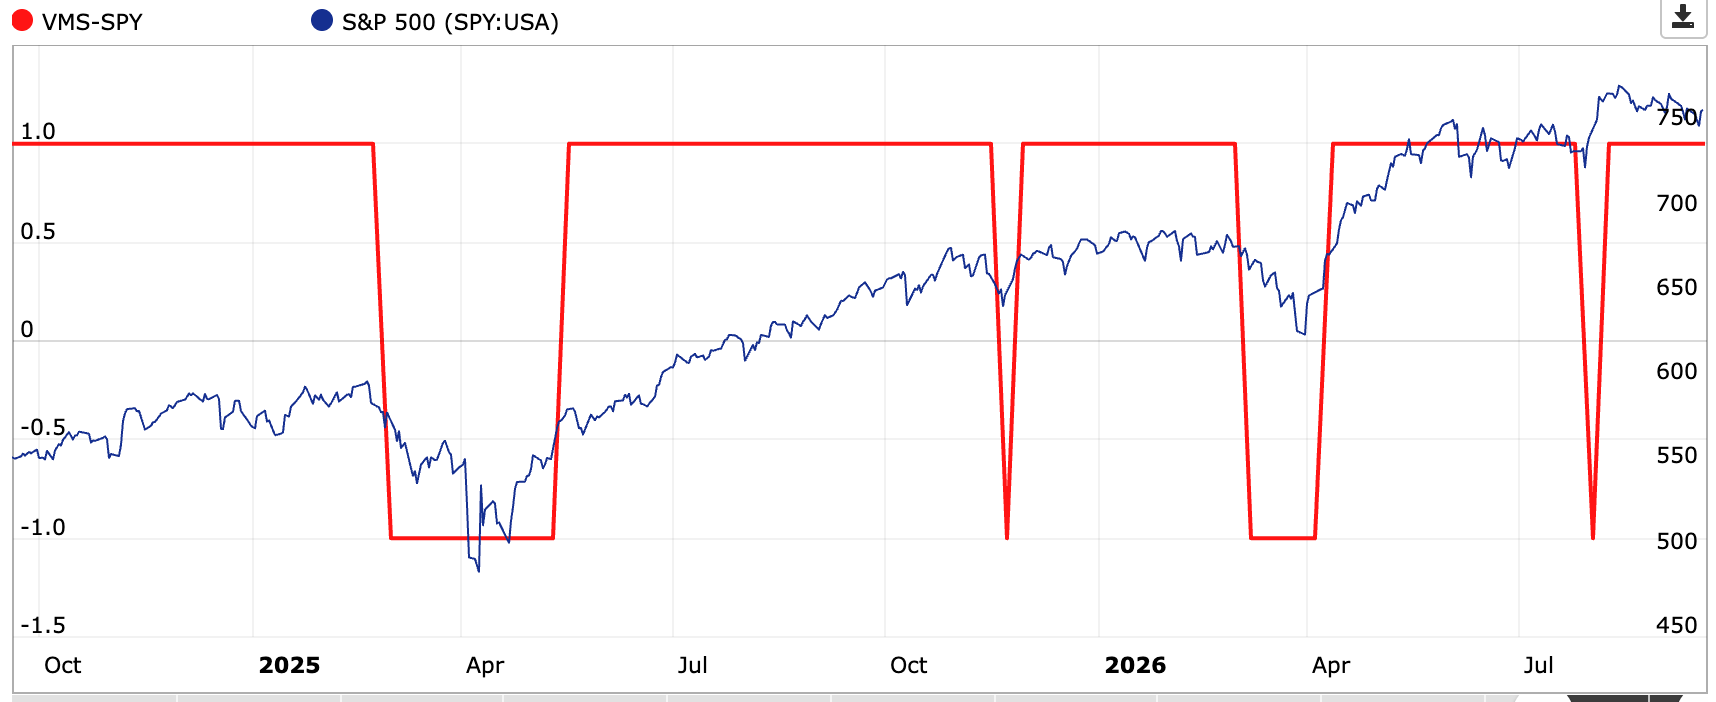
In P123 it is based on out of sample signals since 2006. I developed this system in the 1990s (before P123 even existed). While I am using 12 signals, which makes it more sensitive than six signals in the CRM (and when an EMA overlay improves performance and reduces whipsaws), the real workhorse of the 12 is a custom signal system I call "Vital Momentum Signals" (VMS). It is strictly price-based, but is integrated with all the other components (such as VIX/VIX-3mo, multiple credit spread signals, a composite breadth measure, RSI, etc,) in a Risk Control system.
This is a proprietary system that I run now using Claude Code => Python => P123 Imported Data Series => P123 Aggregate Series => Port/Sim. While that sounds like a lot of steps, trust me when I say that in the 1990s, it was a far, far more complex matter lol...
Here are the basics:
Dispersion measure from Moving Average, not bar-range volatility. "How far price is actually drifting from its recent average" = mean absolute deviation of close from an SMA, rather than ATR. So: basis = SMA(close, n), disp = mean(|close − basis|, n). This is the key differentiator — ATR inflates on wicky, directionless bars; MAD-from-mean only inflates when price is genuinely displacing.
Adaptive threshold.band = mult × disp. Self-tightens in quiet tape, widens in volatile tape.
Ratcheting trail (SuperTrend-style, but on the dispersion band). In an uptrend the signal line is max(prior line, close − band) — it advances with the move but never retreats. Flip only when close crosses the line, which by construction means price has retraced the full band from its best trailing anchor.
The anchor offset. On a flip, the new line is not placed at close ∓ band in the usual SuperTrend way. It's anchored at a deliberate buffer, e.g. close − anchor × band (anchor < 1). The subsequent few days' price activity doesn't cause the signal to change retrospectively — a fresh signal starts with breathing room instead of being instantly at-risk. This asymmetry (trail distance ≠ flip-immunity distance right after a flip) is the whole ballgame.
I have also implemented an asymmetric aspect because sell and buy signals are never identical.
"If you want exceptional results, you have to build exceptional systems!" To me, that means innovative. Using the same 'ol thing as everybody else won't produce exceptional.
Why is controlling risk /drawdowns so important to me? Because on a weekly basis, the stock market spends 80% of its time either declining or recovering from a decline (google it!). If you can mitigate or eliminate the majority of that 80%, you can significantly increase compound returns by as much as double or triple and your investments become a stress-free aspect of your life.
With the market once again showing the same fast-paced run-up that it experienced in the late 1990s (internet bubble) and the mid-2000s ("risk-free" real estate), we see stock prices reaching all-time highs, debt levels reaching all-time highs, interest rates headed to the moon, and we know that there is going to be another crash in the future, probably for the same reason as the current market exuberance and excesses: AI.
Preparing for that crash now will serve you well in the future.
The only way some sort of market timing can work is if you get out of the market when the market is high and you get back in when it's low. If, as your illustration suggests, you get out of the market when the price has declined and you get back into it after the price has recovered, you've lost money (according to the chart you posted, that happened half the time).
A few thoughts on market timing I'd like to share (I'm quoting from an article I wrote in 2019).
William Sharpe calculated that a market timer would have to be correct 74% of the time to beat a buy-and-hold investor. That’s a pretty tall order, especially when most pundits are right less than half the time.
Paul Merriman, founder of Merriman Wealth Management, published his first book in 1985, two years after he’d launched the company. It was called Market Timing with No-Load Mutual Funds: Low-Risk High-Return Investing with No Commissions. He has changed his tune completely. In 2013, he wrote, in an article entitled "Why Market Timing Doesn't Work," “Nearly half a century of working with investors has taught me this: Many people who try buy and hold succeed, while most of those who try timing (particularly those who do it themselves) fail.”
Index Fund Advisors has published an extraordinarily forceful warning against market timing. You’ll read there that CXO Advisory Group tracked market-timing gurus over the 2000–2012 period, and not a single one beat Sharpe’s 74% threshold. Another study tracked 15,000 predictions made by 237 market-timing newsletters from 1980 to 1992. By the end of the period, 94.5% of the newsletters had gone out of business. John Bogle said that over a 55-year period he had never met anyone who knew how to “get out of stocks at the high and jump back in at the low,” and had never even met anyone who knew someone else who could do that.
Here is my experience. With market timing systems you sell everything(usually with a lot of slippage)when everyone is trying to get out and buy back after the early strong gains have been had. Your chart shows that as Yuval mentioned. It has been my great weakness as an investor - you get nervous at the wrong time and bullish when it is too late. I think I am over that . I do believe though that a variable hedging method can 'smooth' returns - but there is always a cost.
Yuval — Sharpe's 74% came from a timer who was all the way in or all the way out for a full year at a time, on a forecast of whether that year would beat bills. The hurdle is so high because that timer bets the entire equity premium every year for the chance of avoiding the occasional bad one.
Change the experiment and the arithmetic changes with it. If you move a portion of exposure, express it through a cheap short rather than by selling holdings, and act only on persistent deterioration, you don't need to be right anywhere near 74% of the time. The question becomes whether the losses avoided in the handful of bear markets across an investing career exceed the whipsaw accumulated everywhere else. Not a free bet, but a narrower, more winnable one.
Reframed, it's paying a premium in most years for protection when it matters.
I'll also reiterate that any hedge has to be judged holistically. If it lets you lean further into equities and less into cash, bonds, and alts, that should be considered.
Finally, there's a whole lot of literature saying that nothing any of us do here is possible. In that light, scoring the market with signals doesn't feel conceptually different to me from scoring stocks with factors.
Market timing" is such a taboo word that it immediately triggers backlash, but yet its practice every day by any other name. No one can win at market timing ...but yet the greatest discretionary investors of all time ... from Buffett to Drunkenmiller to Soros ... all tactically change their equity and cash positions based on market conditions and it was a huge component of their success. Its just a method of handling risk. I feel better hedging risk by tactically changing my equity and cash positions based on market and macro conditions compared to holding a long/short book and paying borrowing costs to potentially get my face ripped off on a short squeeze. I imagine the same authors who scold the practice of market timing are also not particularly supportive on individual retail investors putting money into illiquid microcaps and hedging it with option strategies and shorting stocks. Im not sure there is an "academically sound" way to hedge microcaps in particular due to their unique vulnerability to market liquidity events. Having more personal liquidity until you can get through the other side the most sense to me. That said I wouldnt get 100% in and out of the market based on one signal anymore than I would get long or short a stock based on one factor.
I feel like maybe you are relying on opinions from decades ago, often using such archaic methods as moving-average crossovers, MACD, and stochastic signals. Modern technology and contemporary digital signal processing approaches have changed the game!
One thing that your references seem to have in common is that they rely on discretionary decisions. For example, in this Paul Merriman post, he lists these as some of his reasons why market timing doesn't work: 1) Emotional decision-making, 2) Recency Bias, 3) Focus on noise, not timing signals, 4) Overconfidence.
These are all human behavioral errors that arise from not using a quantitative, rules-based risk-mitigation system! Of course, discretionary investing doesn't work. I would suggest that almost all of us are here because we are aware of that fact
There's a lot of creative, systematic strategy development being done at hedge funds, money managers, and investment banks around the world – as well as on sites like Portfolio123 that enable individual investors to manifest their ideas.
As I noted earlier, "If you want exceptional results, you have to build exceptional systems!" That means using all the very exciting capabilities we have available to us today in an innovative and creative manner, using AI, machine learning, Claude Code, Portfolio123, and other modern resources.
The world has moved on from moving average crossovers and other archaic, failed, and taboo "market timing" methods from the past, and there is no reason whatsoever to have to accept a -30% or -50% drawdown in a portfolio's long-term performance.
I'll plant a sword: get creative and use that excellent brain on your shoulders. I've seen your other work and I'm impressed. I bet you can come up with something exceptional to mitigate drawdowns if you tried. Heck, I'm excited to see what you come up with! Please keep us posted if you accept this friendly challenge.
I have a great deal of respect for Yuval—when his views differ from mine, it's always worth a healthy re-check on my end.
What's interesting, Chawasri, is that your methods are modern and sophisticated. Mine are admittedly old and basic, vetted in published research. Each signal gets a modest, equal weight, and they watch different domains (rates, credit, price, the cycle), so no single one has to be right.
I have a tremendous fear of overfitting and try to soften anything binary hitting the portfolio. I also begin risk reduction through an M2K short and refrain from selling positions for as long as possible.
The main thing that keeps me from overfitting is not asking the risk-reduction piece to avoid stock crashes. SPX puts handle the crash, which gives the rest sufficient time and elbow room to work without trying to get too cute.
plan_trader is right that there's always a cost, so it's important to budget, size, and structure your portfolio appropriately.
I'd like to learn more about the methods fellow timers use.
And what non-timers who are drawing on their portfolio do.
I agree 100%! Yuval is a real asset to P123 from my observation. I hope he'll take me up on my friendly challenge. It's a "try it - you might like it" suggestion.
What's interesting, Chawasri, is that your methods are modern and sophisticated. Mine are admittedly old and basic, vetted in published research.
That's what makes a market, my friend! Millions of individuals and organizations making tens of millions of decisions every day in the market, each from a different perspective. The stock market is one of the most spectacular dynamics of human activity on Earth, in my opinion. I never tire of learning from it.
Investors seeking to reduce portfolio risk when market risk increases have an fulsome variety of tools from which to choose. I wrote earlier in this thread about two of my favorites – the economic fundamentals of credit spreads and market breadth and why they are leading indicators of market risk.
There are also many new, innovative indicators based on price, volume, and digital signal processing that are exceptionally effective. In this regard, I've gotten a lot of inspiration from the generous, detailed articles written by John F. Ellers in Stocks and Commodities magazine. Arthur Hill at TrendInvestorPro.com is a great source of insights regarding breadth signals and other risk identifiers. SentimentTrader.com is a fountainhead for many valuable risk-avoidance ideas. Georg Vrba, who uses Portfolio123 to develop his systems, shows how well risk mitigation strategies can perform at his website, iMarketSignals.com.
Personally, I enjoy developing my own new tools, often as a composite of the ideas from multiple sources. I find the process of innovation to be both fulfilling and profitable.
As you are wise to point out ars7777, curve fitting is always an implementation risk that needs to be top of mind in all aspects of strategy development, from top to bottom, start to finish.
You asked what others do, so here goes. I use recessionalert.com signals for market exposure. RA has been around a long time and you see the past signals. They have a composite signal with 7 signals I follow. It will not whipsaw you and will definitely tell you if we go into a sustained decline. I have my own basic technical indicator which reacts a lot faster which I layer on top. I combine multiple systems and index hedges with my own documented levels of hedging - no discretionary calls. Just adjusting the hedging from time to time. I really just want to avoid a drawdown of over 15% - my comfort zone.
There's a huge difference. To quote from my article again,
To successfully and consistently beat the market, you have to game the system, and in order to game the system, you can’t trade what everyone else is trading. You have to find rare opportunities—“mispriced” assets—and capitalize on them quickly. When you’re dealing with microcaps, such opportunities are legion; when you’re dealing with established indexes, those opportunities are far rarer.
Discretionary investing certainly does work. There have been plenty of discretionary investors who have consistently beat the market during long periods, beyond all odds.
You don't have to engage in market timing or tactical asset allocation in order to avoid huge drawdowns. If you apply a constant hedge, diversify, and pay attention to industry and sector momentum, you can do it; you can probably do it if you only do one or two of those things. I have been investing in microcaps since 2015 and I've never had a drawdown greater than 16% (if you go by end-of-month figures; it was a bit higher during March 2020 but bounced back by the end of the month).
I came up with a very good system about a year ago based mainly on the equity curve of horrible stocks, but when I tried to put it into practice, the whipsaws killed me. Here's the problem in a nutshell. Almost all systematic market timing and tactical allocation strategies depend on consistently using a time period to measure something in the past (or, usually, more than one time period, e.g. ten-day up-down ratio smoothed by seven days combined with 6-month up-down ratio, etc.). But drawdowns and recoveries occasionally take years and occasionally take weeks, and you have a very limited sample of them to work with. The timing is simply too wildly unpredictable to take advantage of.
I would really like to see some out of sample results for these. I'm going to bet that more than 50% of them don't work out of sample. A lot more. You can find all sorts of great indicators if you look hard enough, but just because they identified the last six recessions doesn't mean they'll identify the next six. And even if they work to some degree, how actionable are they? It's easy to get out when the market looks bad, but the big question is when do you go back in? If you time your re-entry wrong, you'll miss the best trading opportunities of your life.
OK, Yuval, I get it. Systematically avoiding risk is not your thing, and you can't be convinced otherwise. There are millions of investors who share your opinion, and that's fine. You do you and I'll do me. That's what makes a market.
Yuval - To which chart are you referring? Both the charts I posted show risk identification occurring slightly after the decline begins and re-entry shortly after the bottom is in, eliminating 90% of the risk and improving performance dramatically. I have no idea what you are talking about when you say, "...lost money... half the time."
 . I do believe though that a variable hedging method can 'smooth' returns - but there is always a cost.