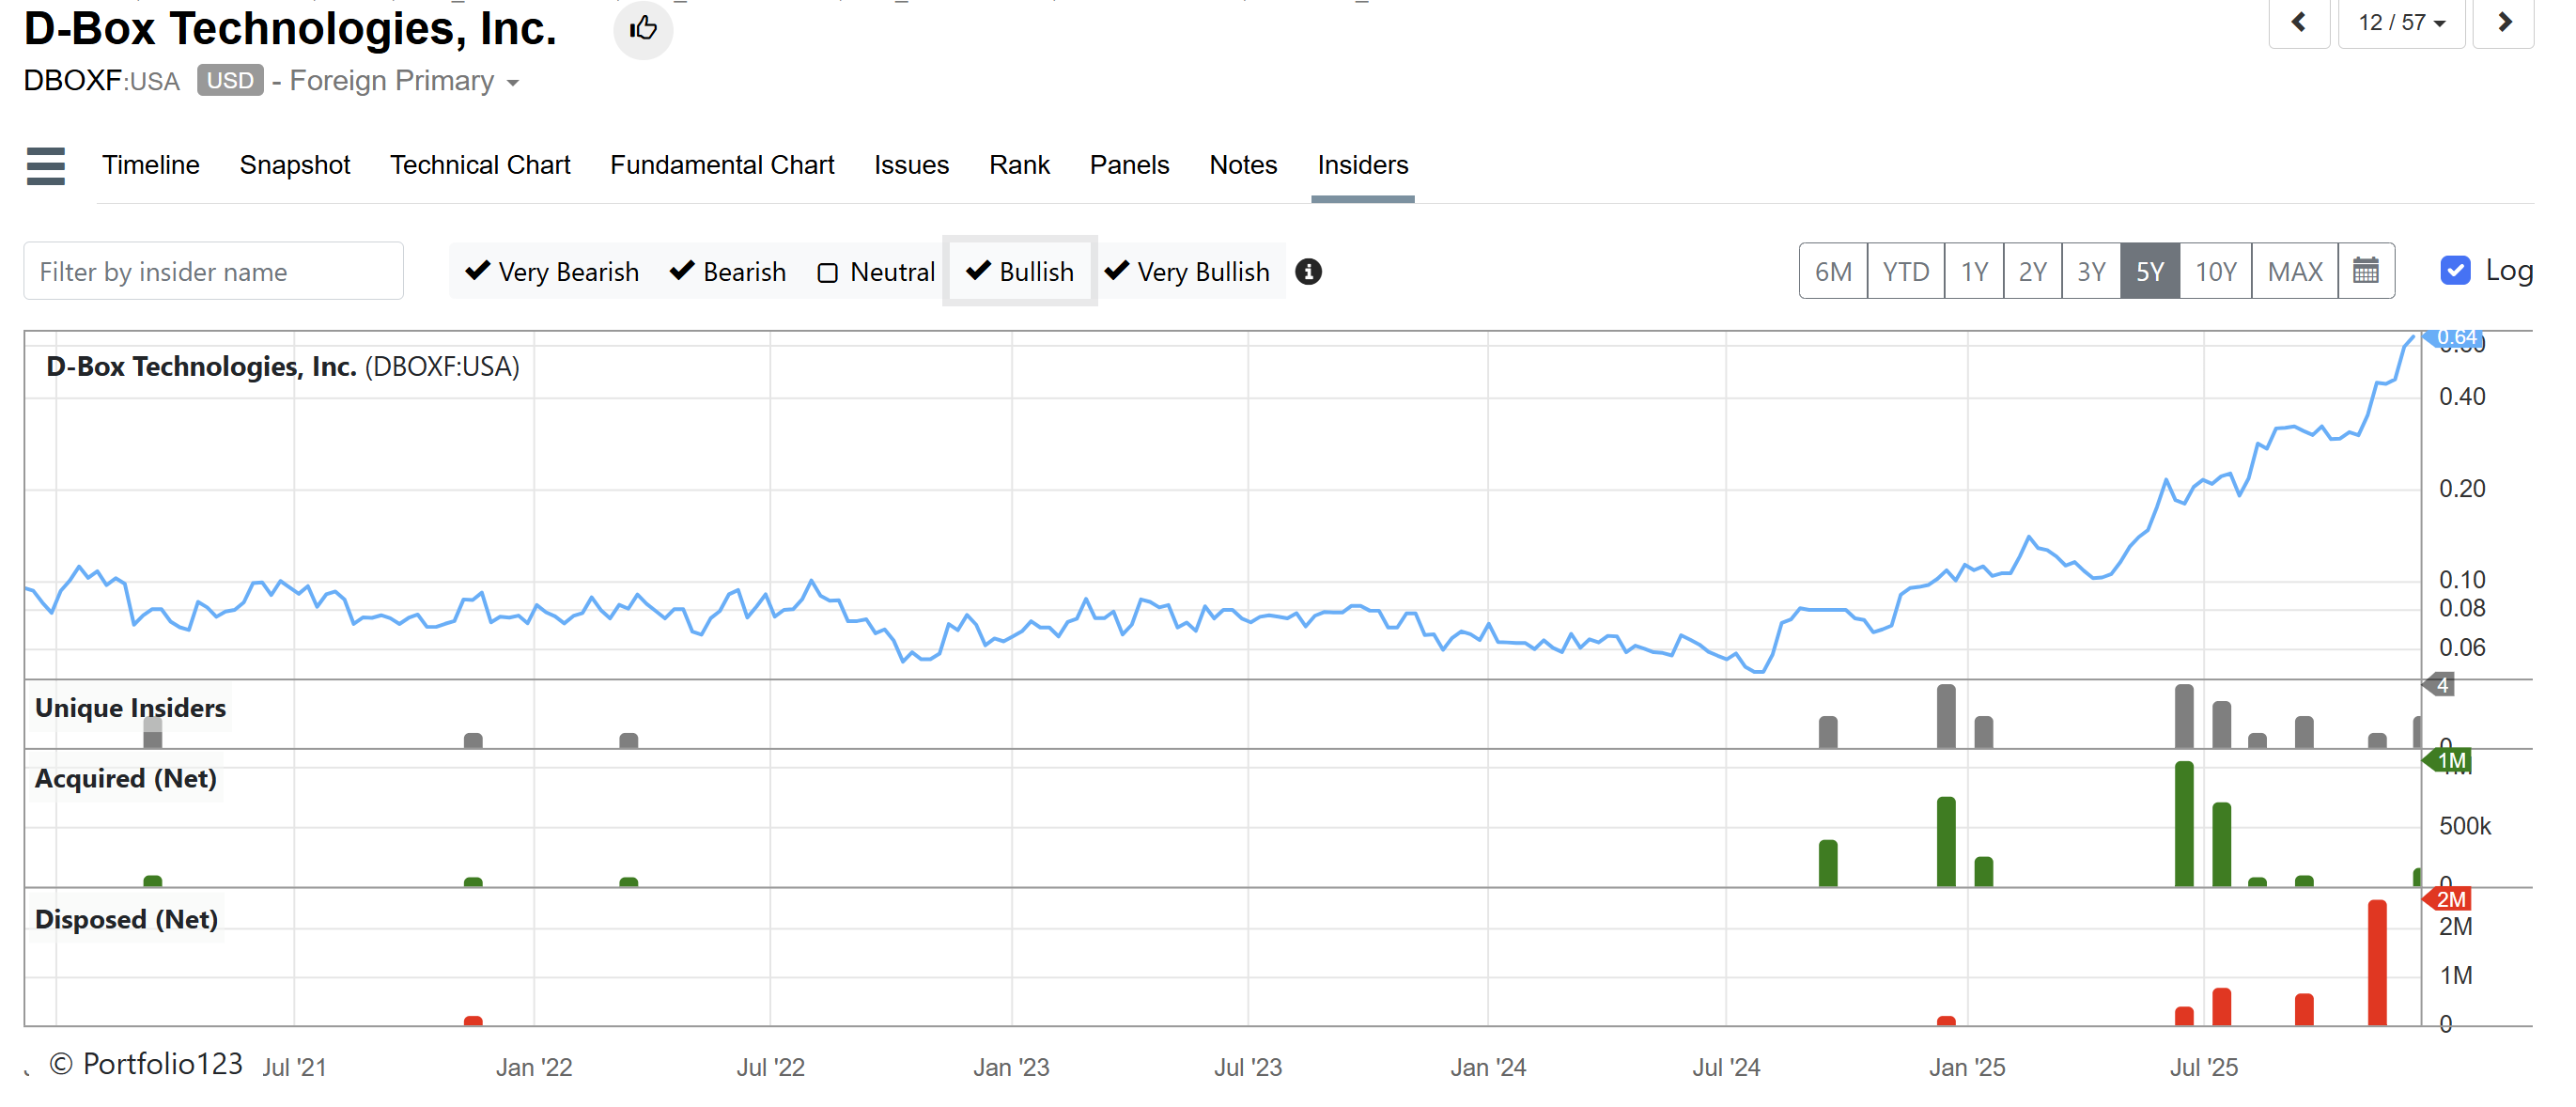
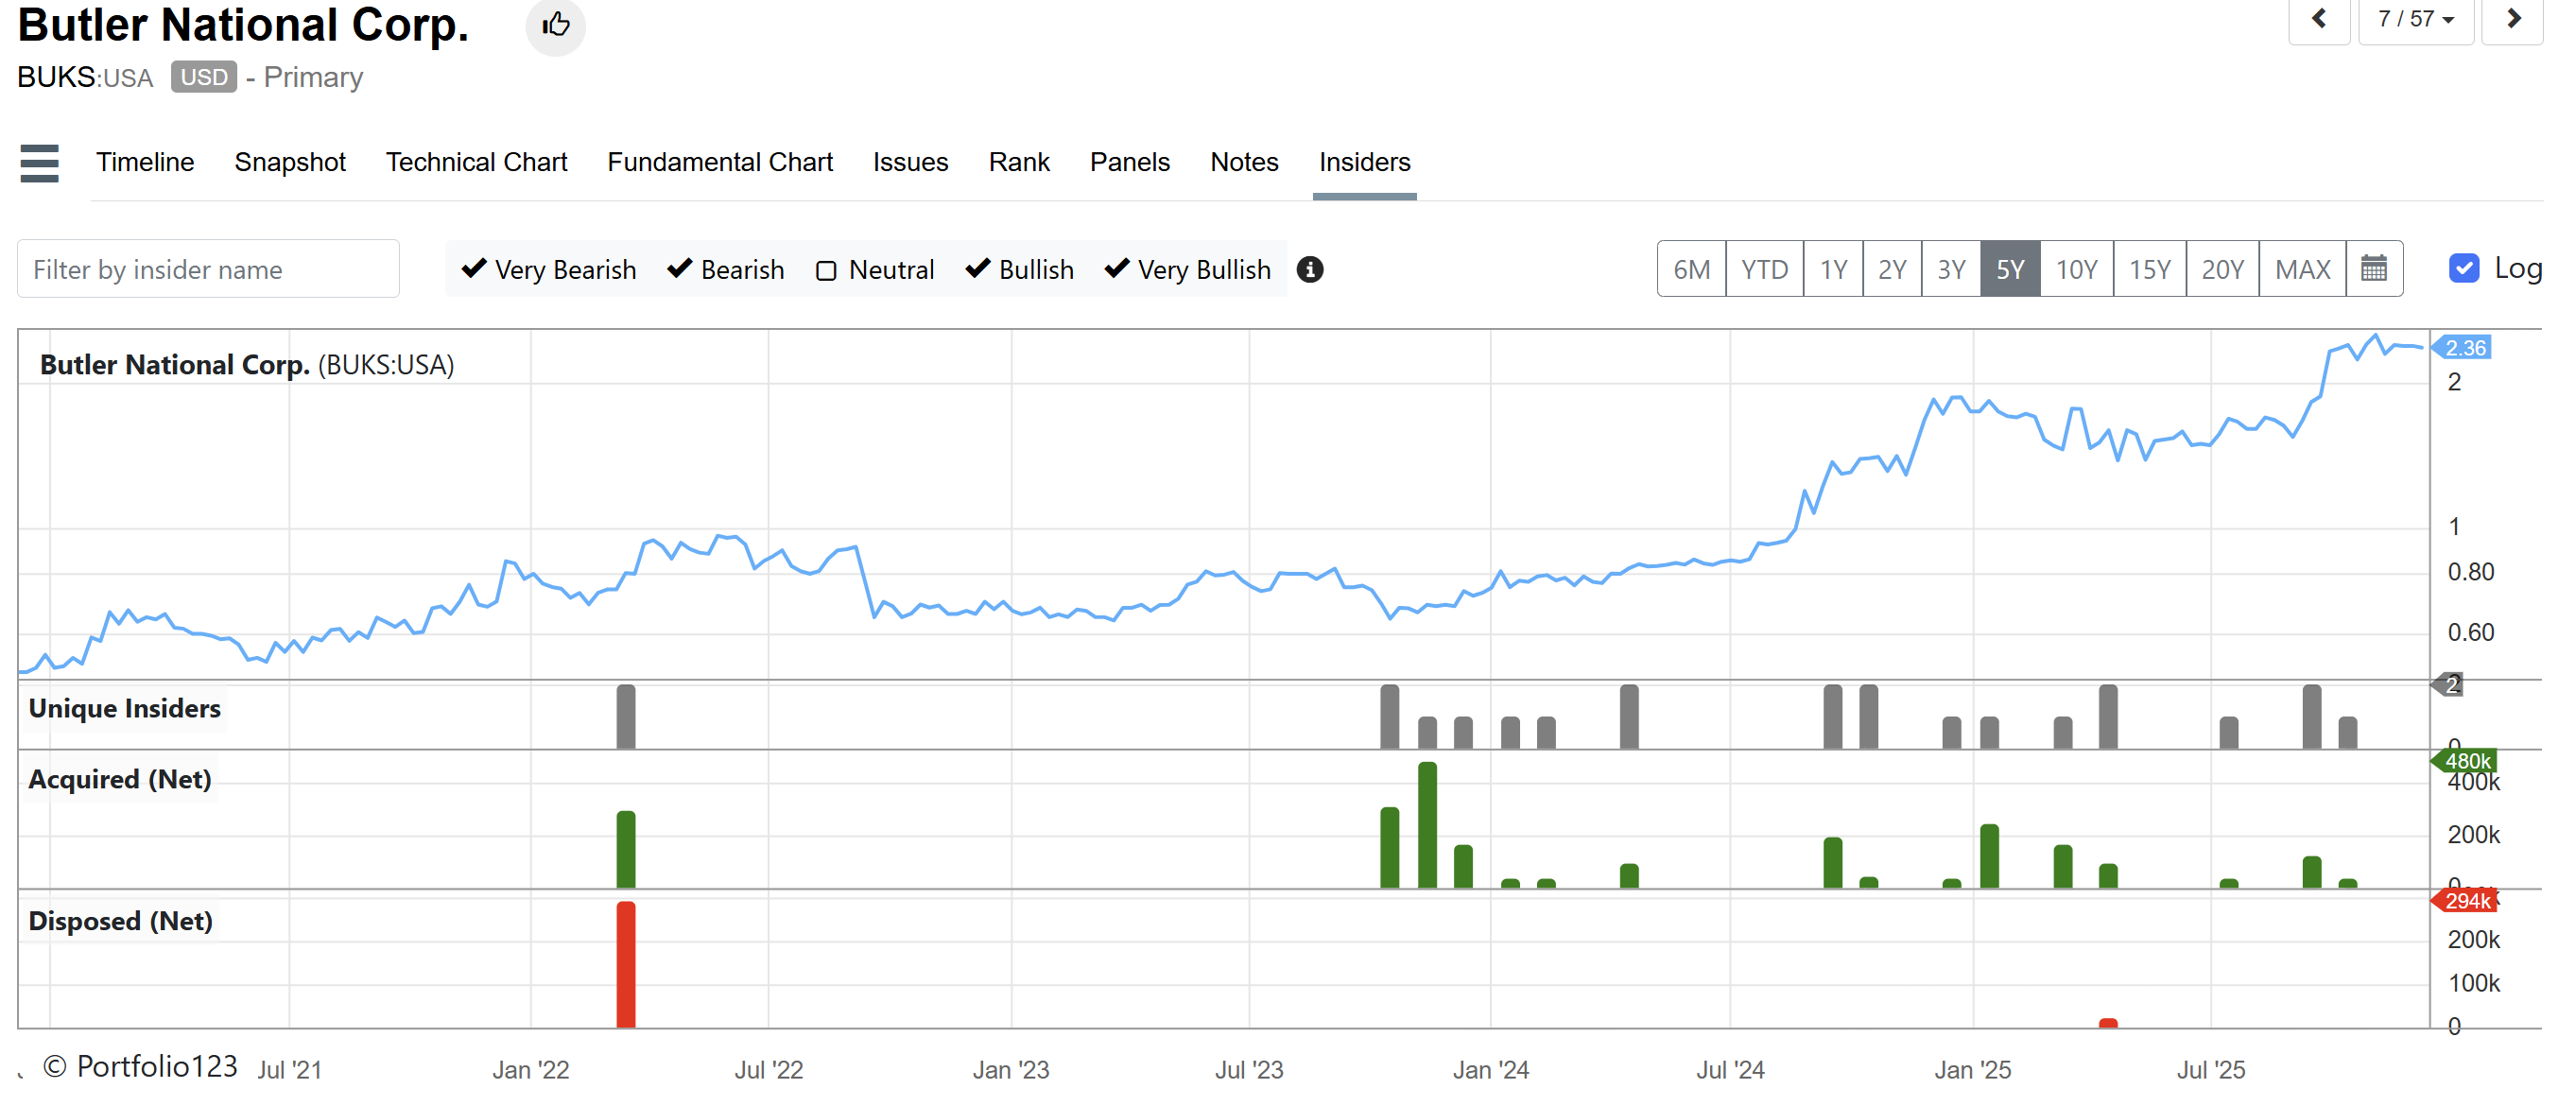
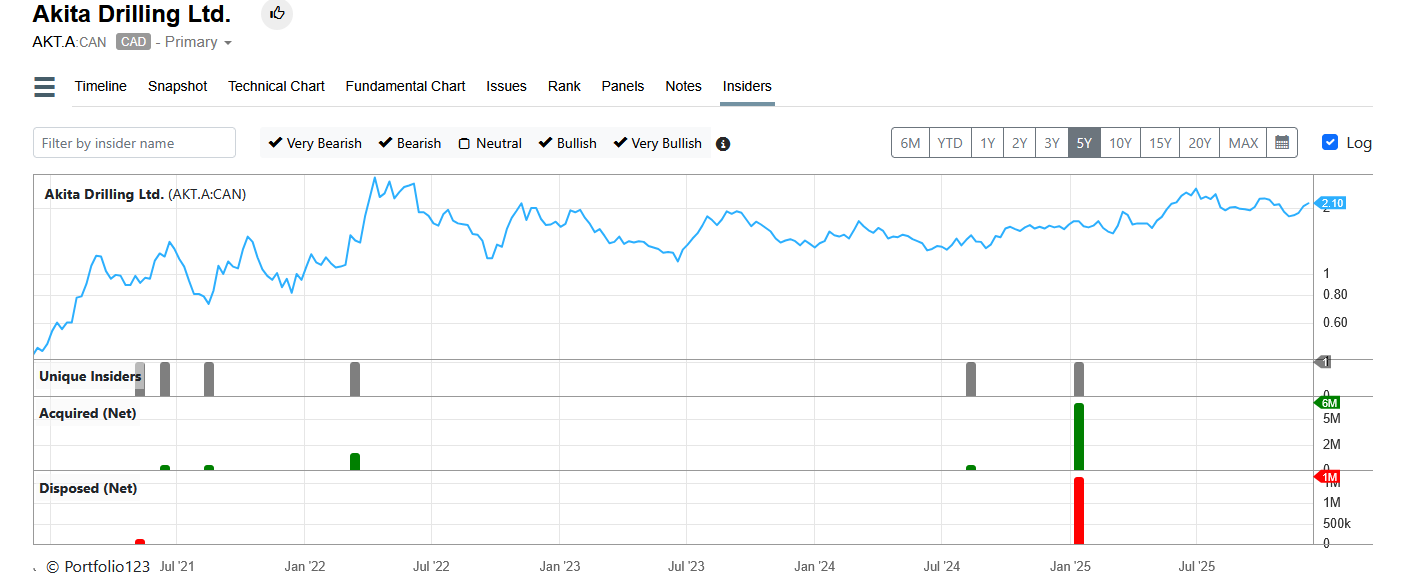
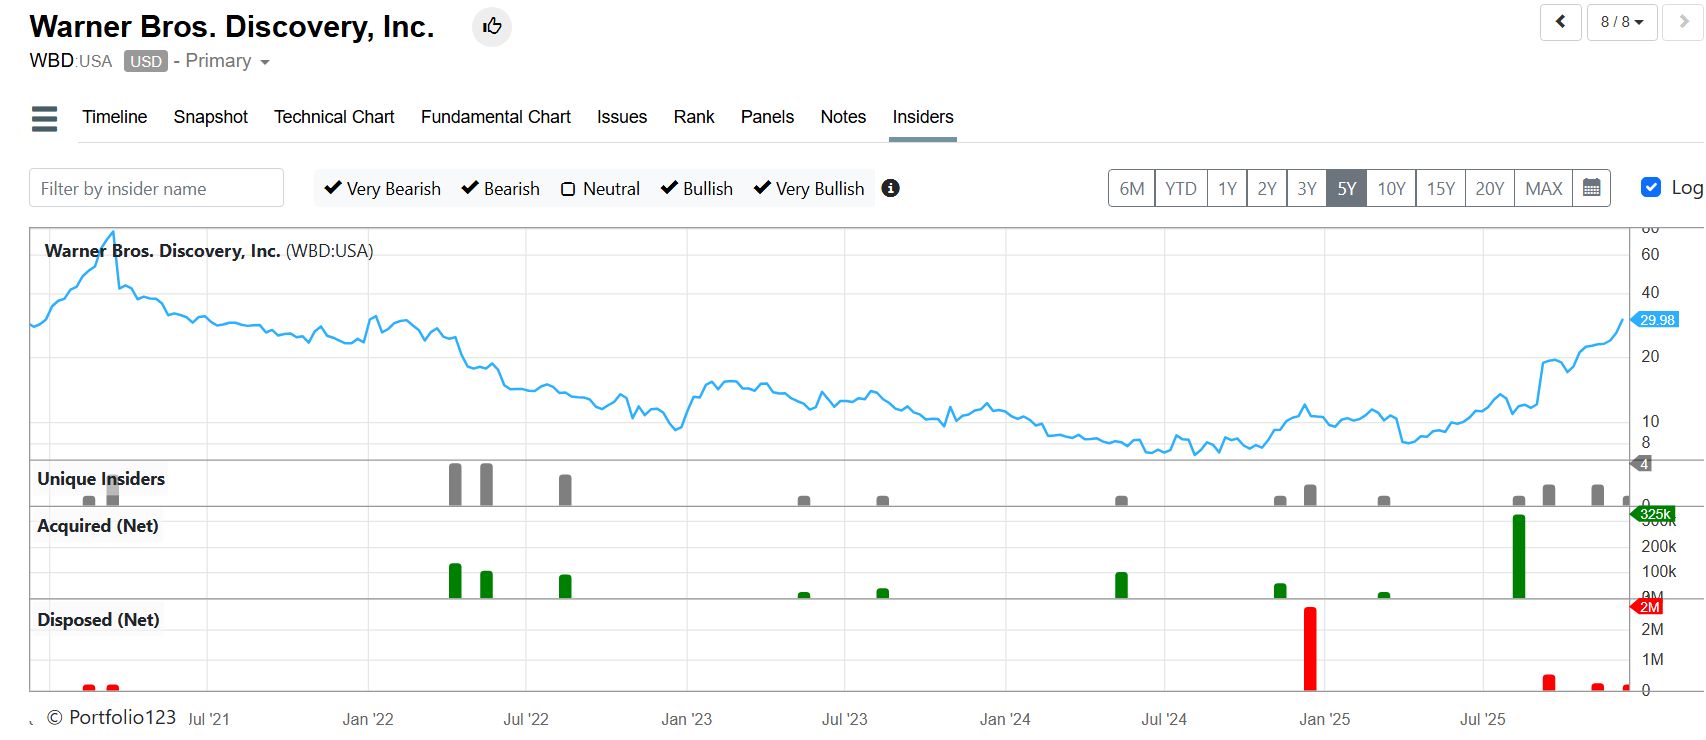
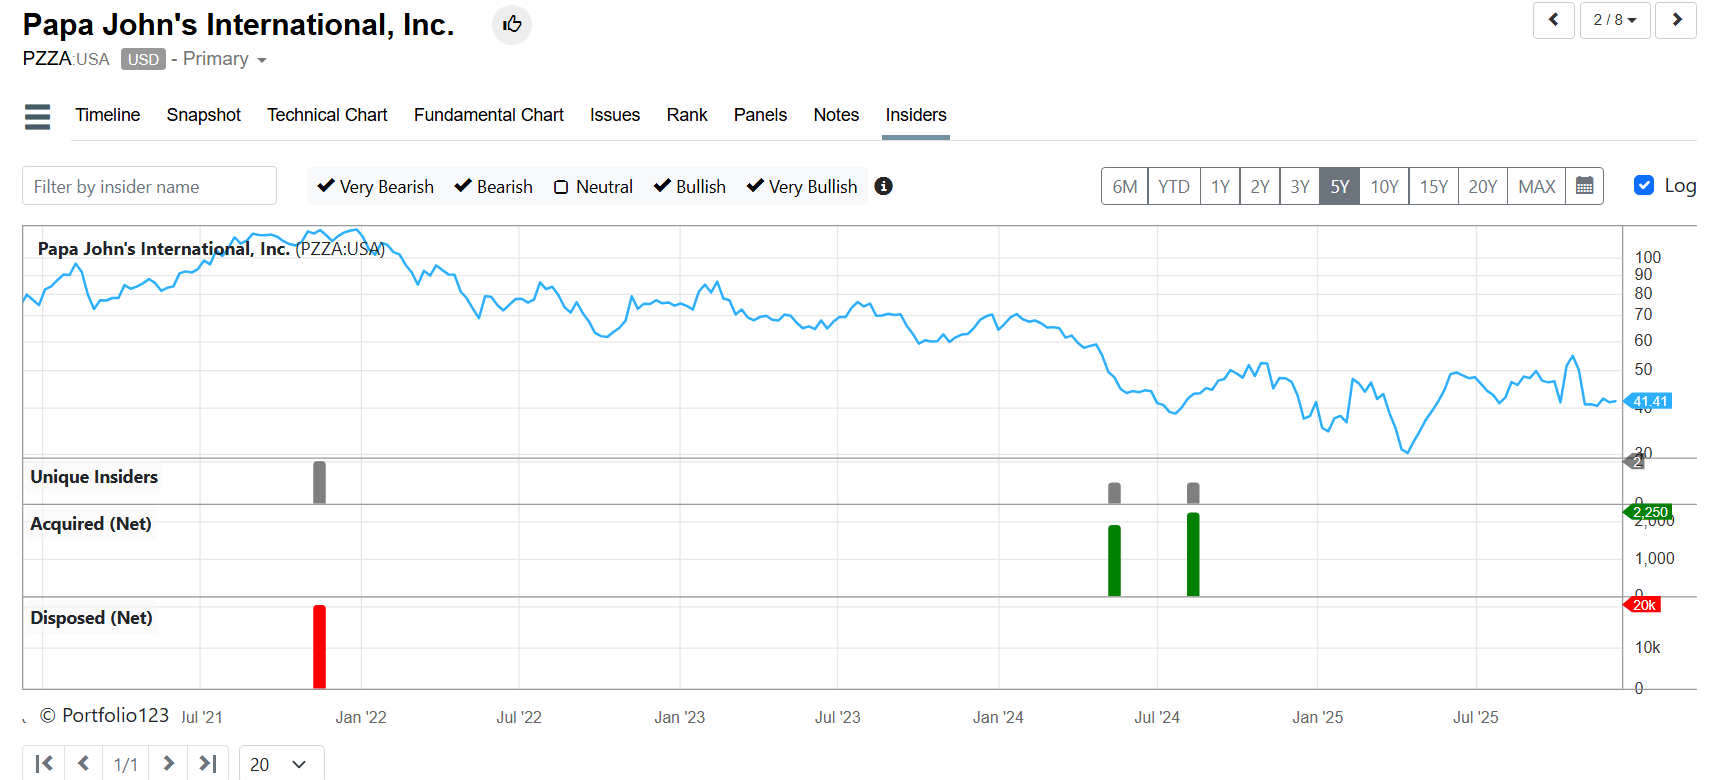
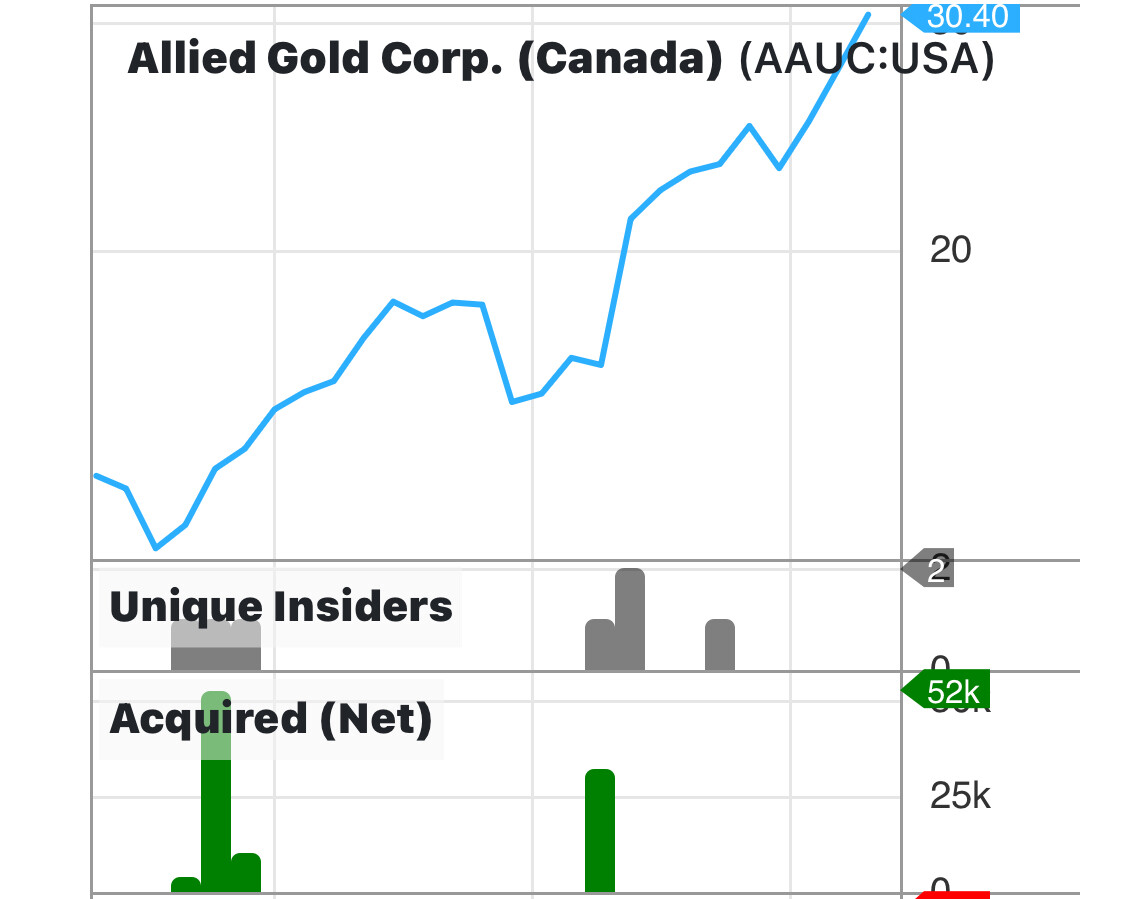
Would love to program these in. Looking manually over the portfolio and earmarking the ones with high recent insider activity. So far it looks like a correlation but eager to build a rank and a rule.
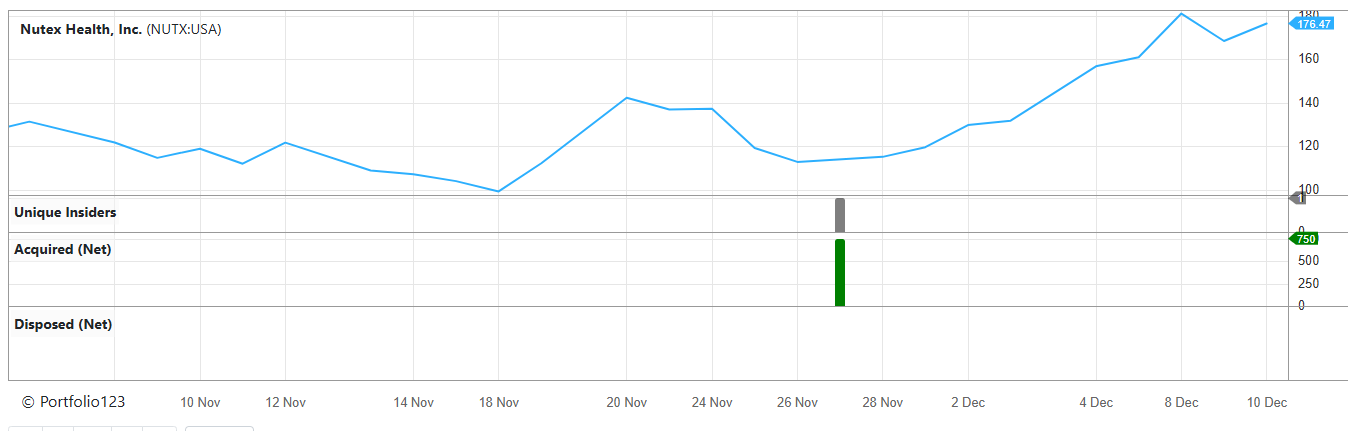
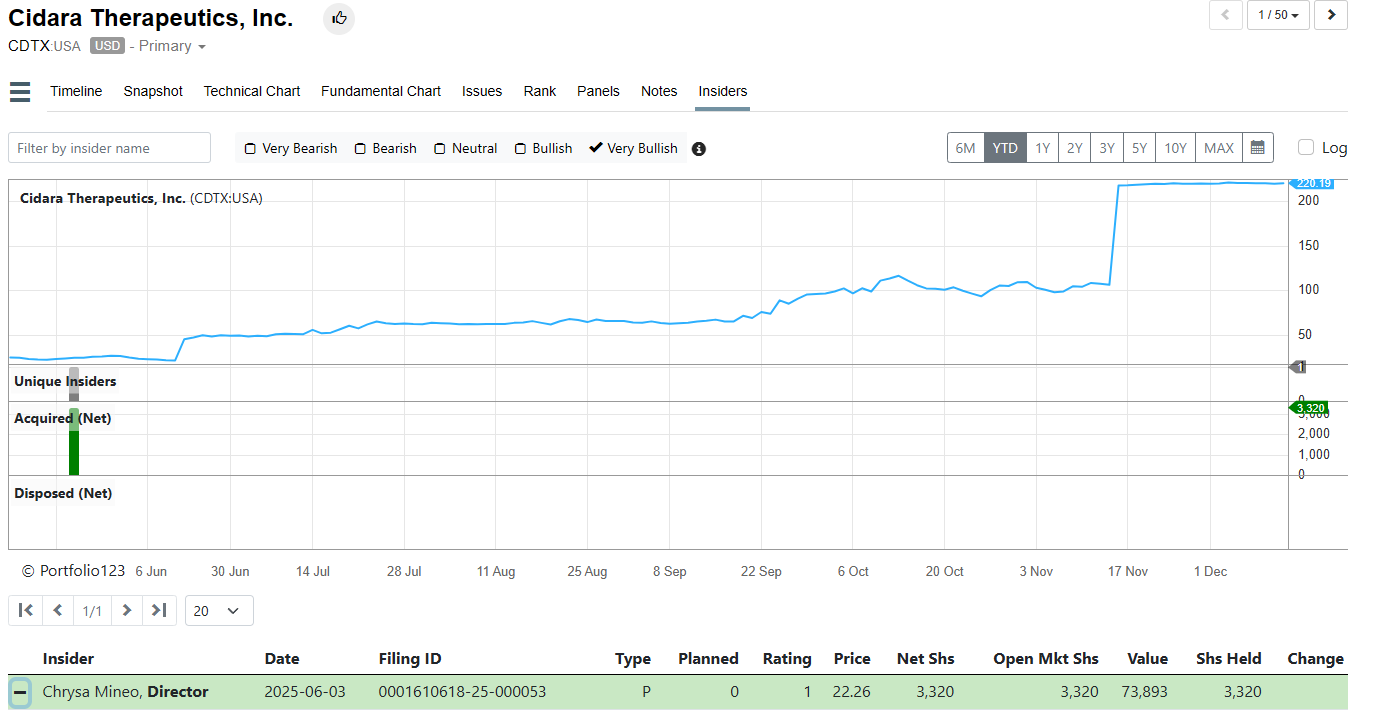
I love this one. June 2025 Chrysa Mineo buys $73K worth of stock. 5 months later MRK announces intent to acquire and she has a 10-bagger on her hands. Move over Nancy Pelosi.
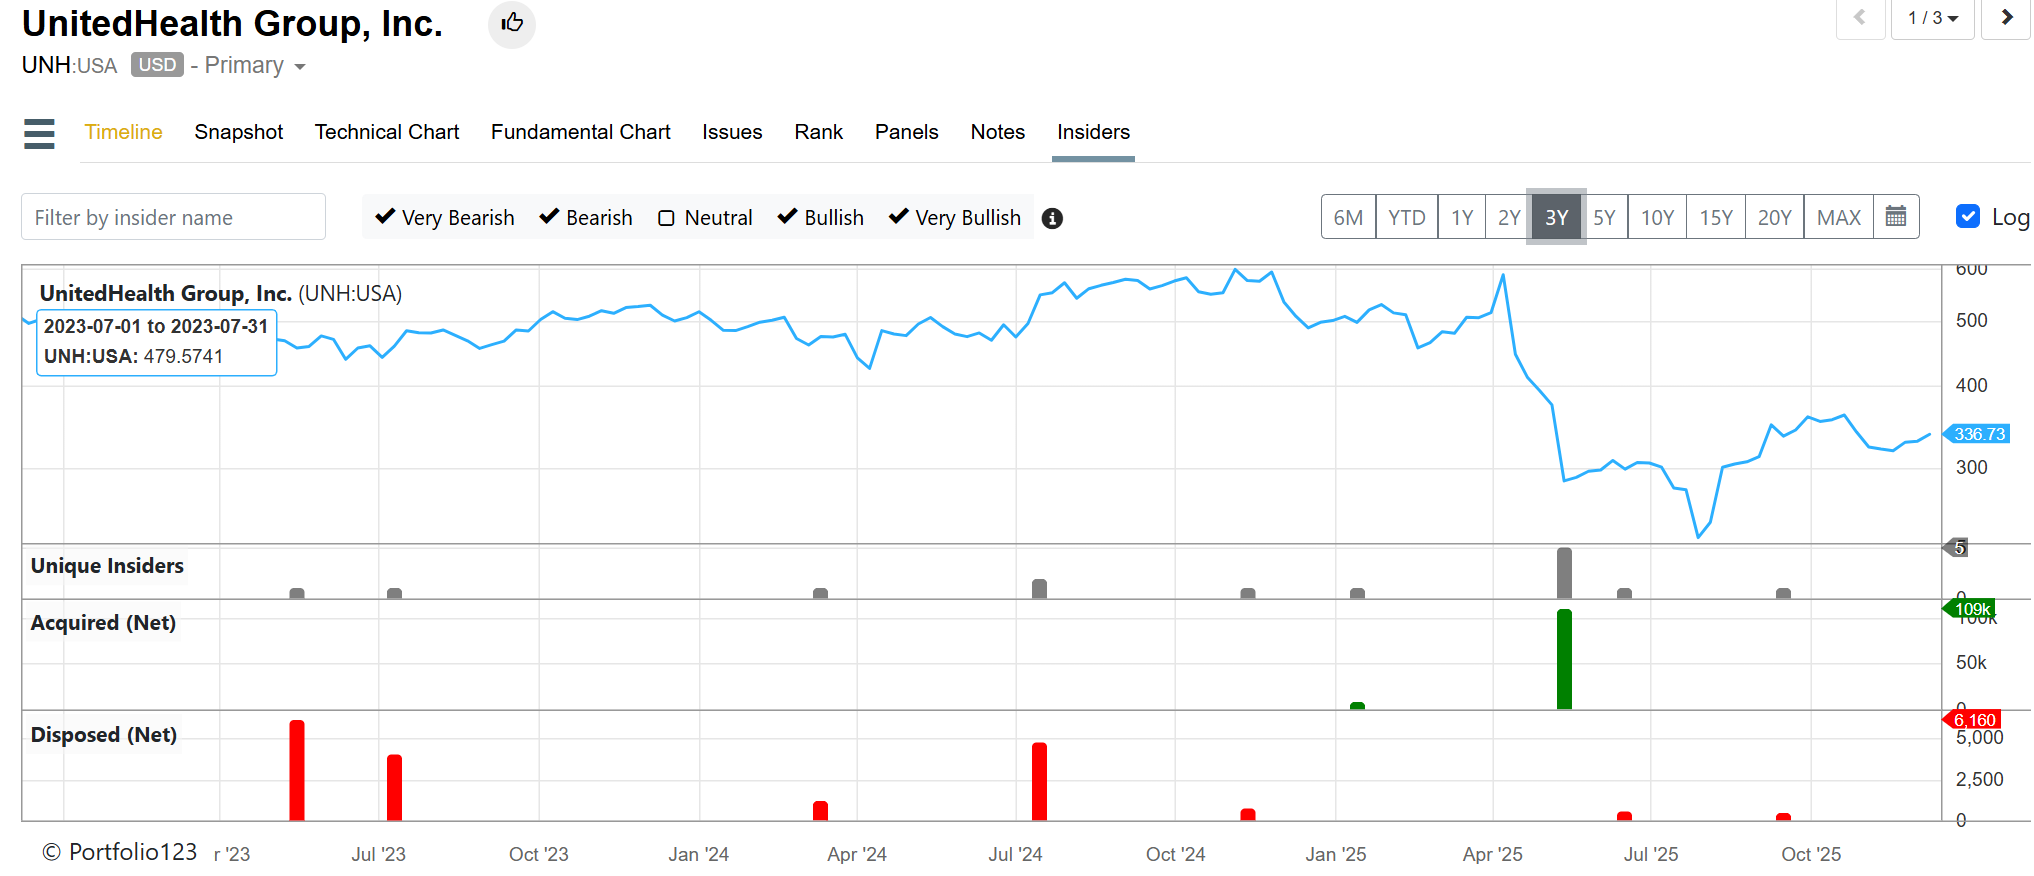
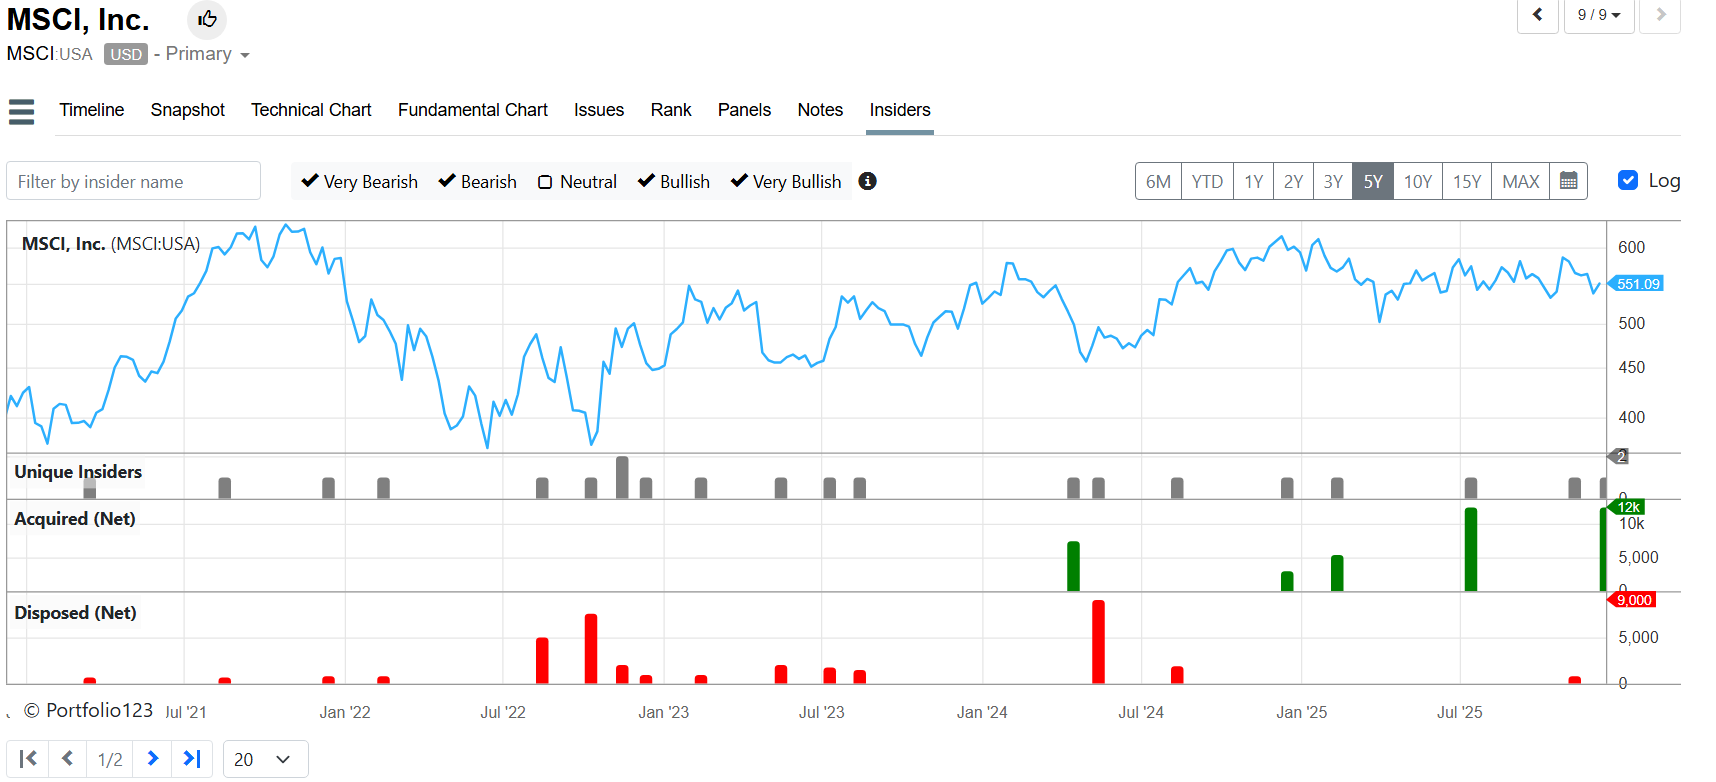
In terms of displaying the bearish and the bullish volumes in different bar chart graphs what if they had the same scale or if they were on the same bar chart side by side? Is it because if they were together or in the same scale the sales would drown many of the buys visually and vice-versa?
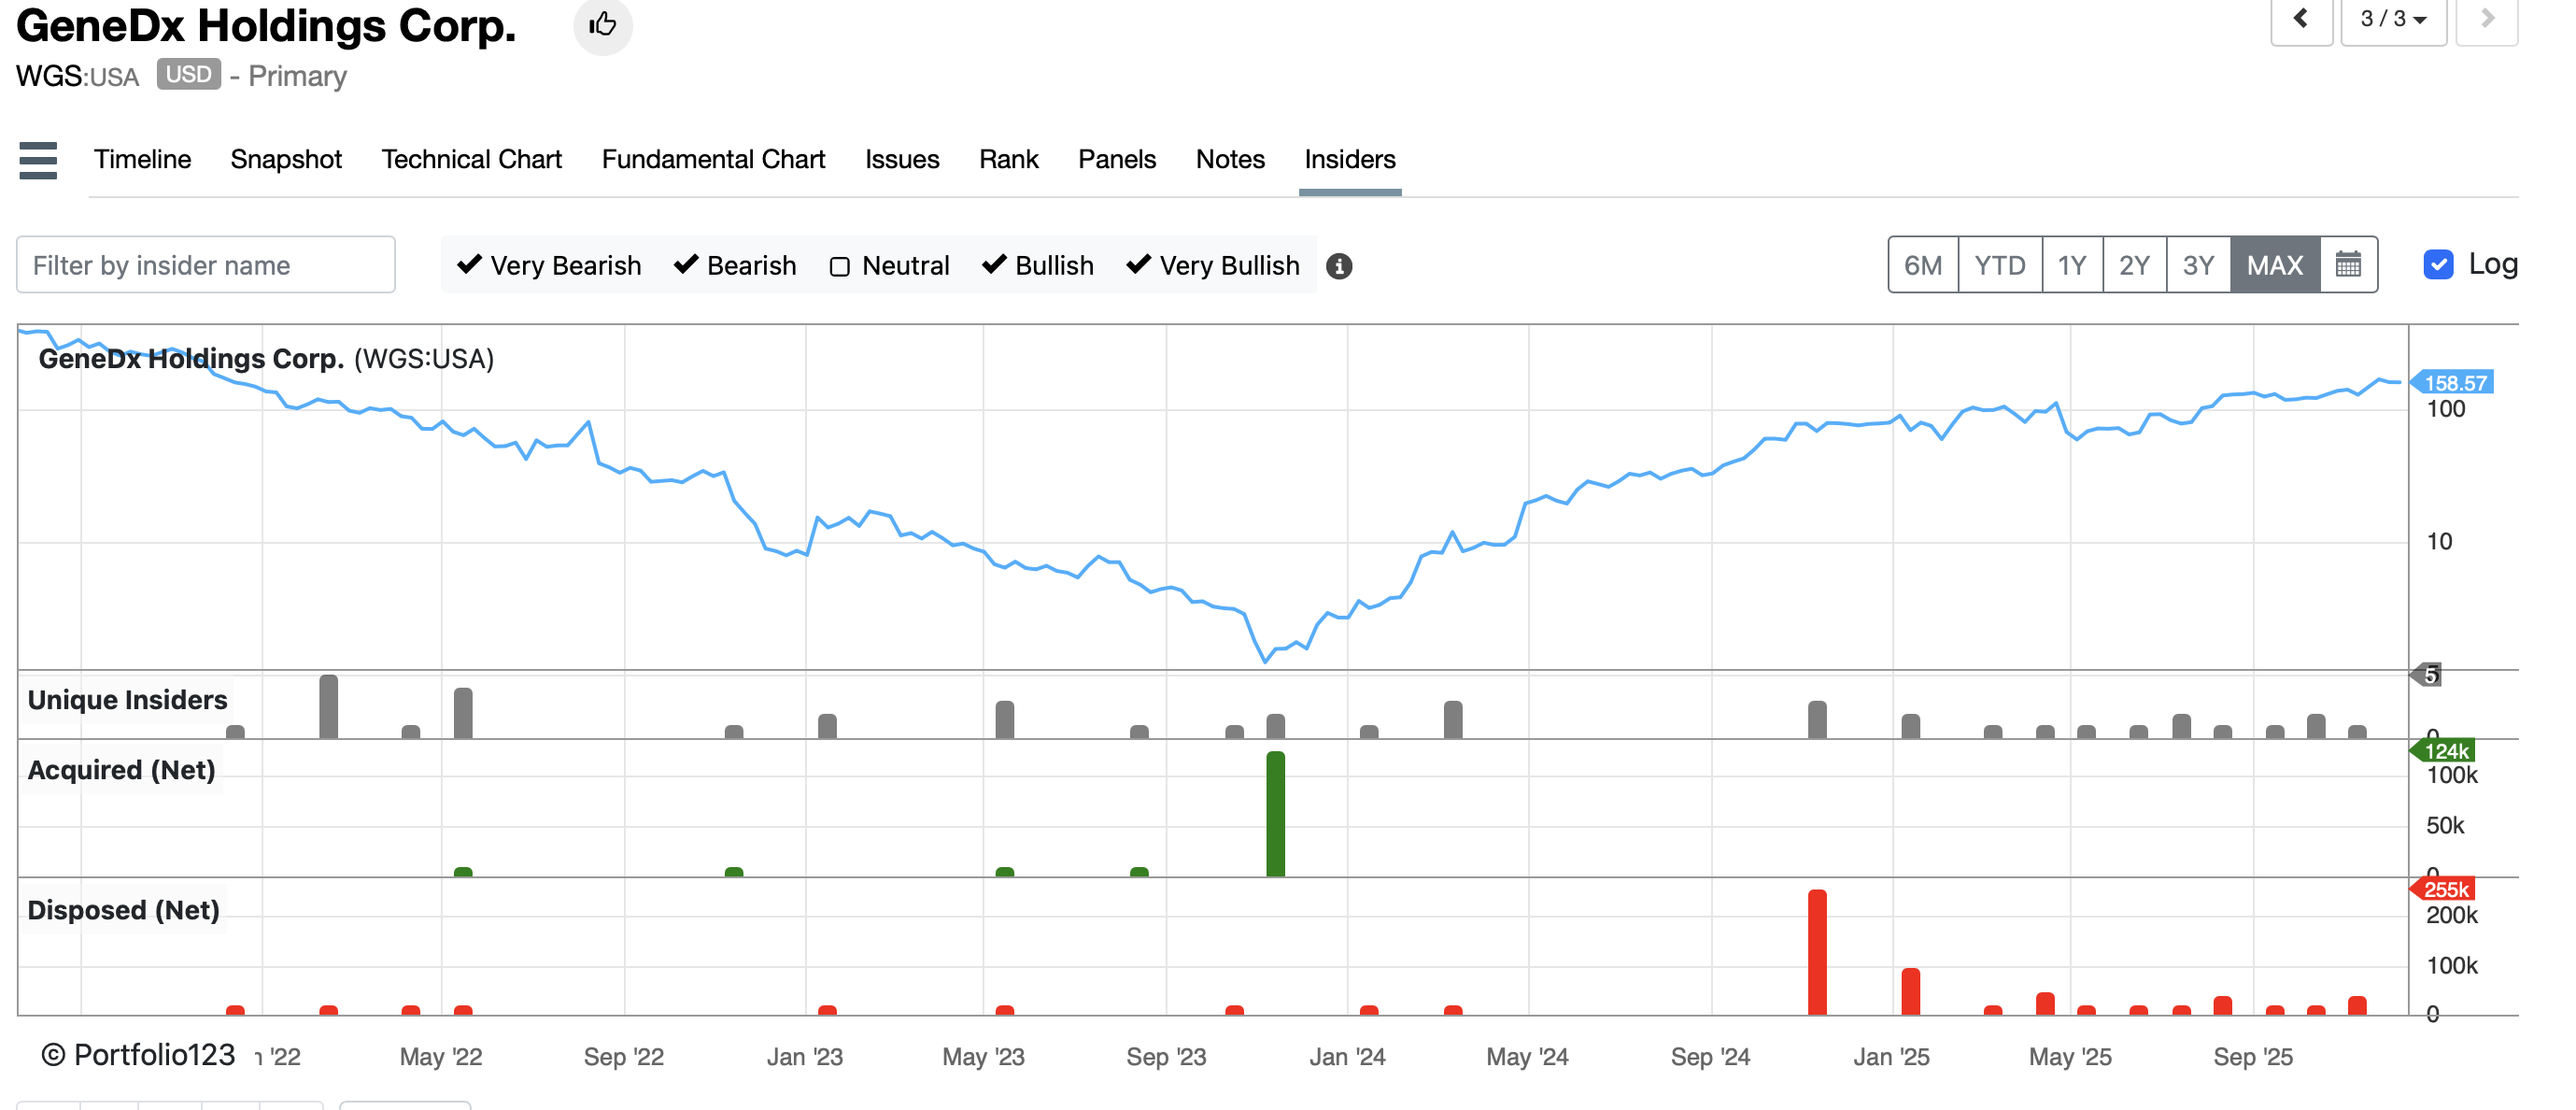
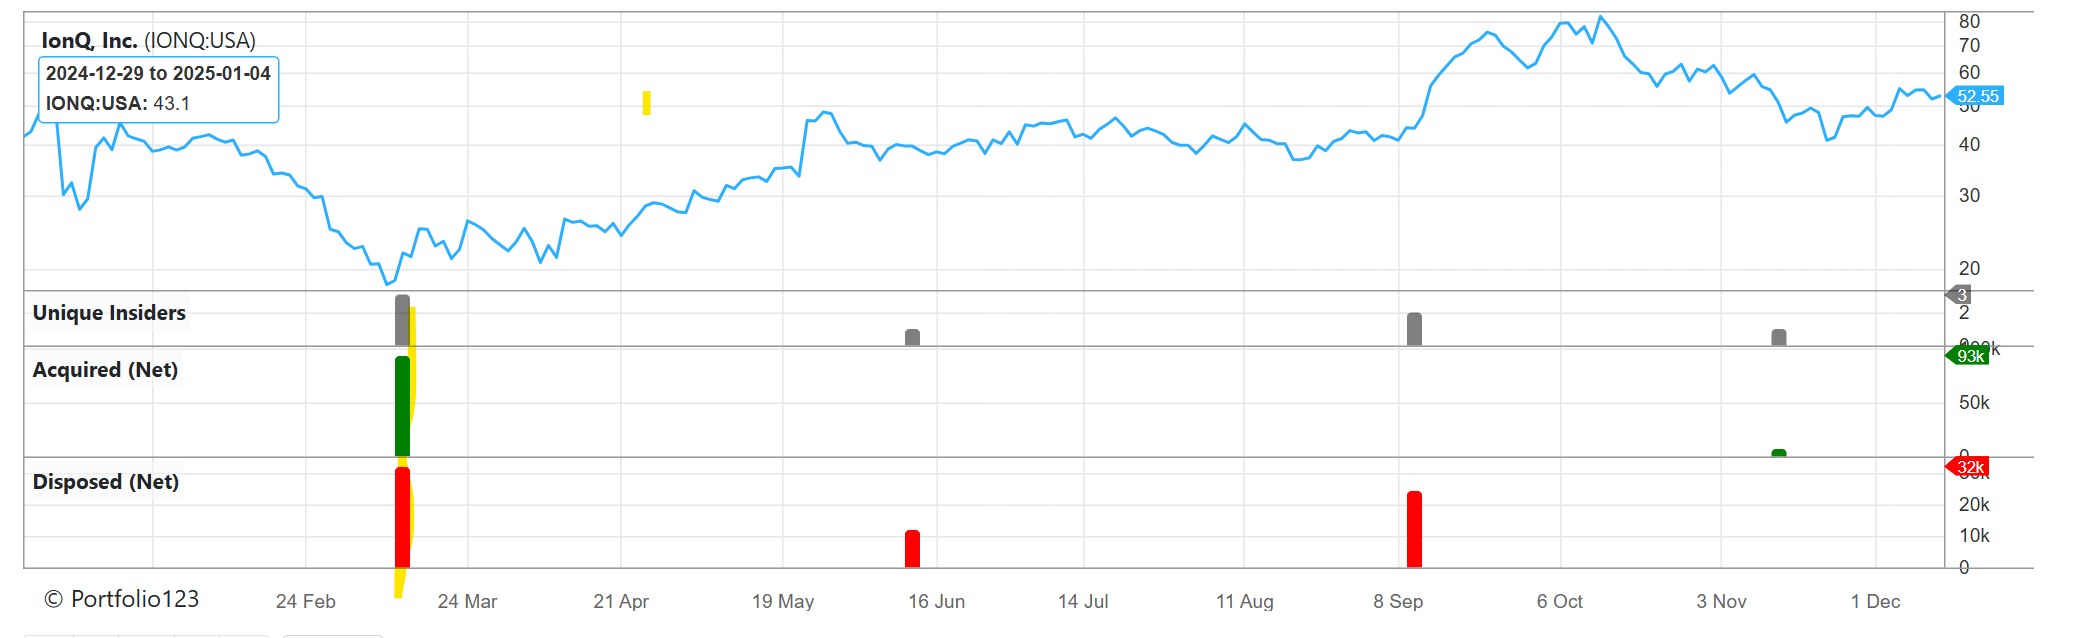
Some users might mistakenly think something like this is equally bearish and bullish despite the buys being 3x the volume:
I think they are apples & oranges. After all insiders are loaded with shares. Buying will never be on the same scale. We initially had them on the same scale and the buys became too small in most cases. We tried log scale too, but was confusing.
The main design principle is to easily spot changes in either the buying or selling, independent of each other. Perhaps additional UI change makes sense, like buttons to examine buying, selling or both.
How much weight do you recommend placing on insider buying? More weight if insiders are buying small caps vs large caps? I have been testing with InsNetShrPurch > 0 but have found my models return higher values without it.
@WalterW ? I am not sure, but this features should work with the old factors yet, cause there will be a lot of users using the old ones...if they apply the insider new factors as are applied in the Insider/graph I guess that they should create a new ones. Anyway we wait @portfolio123 confirmation. I commented that in other thread if I recall well. The new ones are a piece of art! Congrats