Hi all,
it is easy to calculate the SMA / EMA of a stock as well as the RSI using the P123 custom formulas.
Can anybody suggest how I can calculate a moving average for the RSI trend (like the yellow line in the image below?
Hi all,
it is easy to calculate the SMA / EMA of a stock as well as the RSI using the P123 custom formulas.
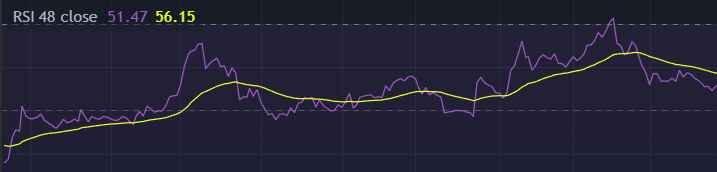
Can anybody suggest how I can calculate a moving average for the RSI trend (like the yellow line in the image below?
For SMA, LoopAvg("RSI(21,CTR)", 10) should work.
I've tried implementing EMA with LoopSum() but it shows poor behavior with some data series, but it may be possible.