@pitmaster - thank you. that's really helpful and i doubt I would have been able to figure it out myself - to combine custom series and multi-chart. This seems more reasonable - no major mispricings out of line. I tried to do this market cap weighted but there were too many outliers in r2k universe. Is there a way to replace outliers or trim them?
Maybe jinxing it, but the dam may have broken today with this CPI report. RUT up 3.5% and QQQ down ~2% as of this moment. Rotation on? I guess we'll see how earning season goes, but feels like there is a lot of overcrowded positioning in the market to unwind.
8 Likes
Fingers crossed. imho it felt like something actually changed in yesterday's market - different behavior. I really don't know what to make of today though - kindof like a month or two happening in all at once.
1 Like
more like a year or two in a day... R2000 vs QQQ was like an infinity sigma move
1 Like
This has to be one of the oddest moves I've witnessed. Stats from today 7-11-2024
SPY -0.86%
RSP +1.21%
QQQ -2.19%
IWM +3.59%
Today was best day of the year for my port, at least on a nominal basis. Yesterday was the best day in almost a month prior to this. And I have exposure to big cap tech as part of my port, and stuff like GOOGL, ADBE, META, NFLX, BKNG were all working against the portfolio today and still was best day of the year. Can't recall a day like it.
1 Like
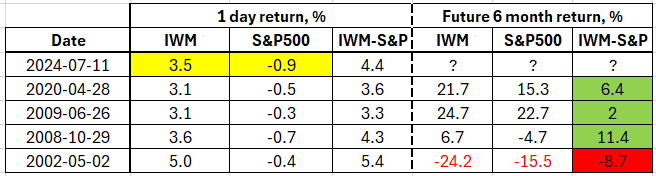
Let's see - it's one day, but quite a reversal. But in fact this only the 5th time IWM>3% and S&P500 has been negative (since 2001).
Historically 6 month return following is potentially bullish ![]()
2 Likes
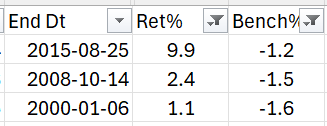
Hi rtelford, if you have a database setup, do you have many instance of SPY down at least 0.8% and RSP up 1.0% or more?
1 Like
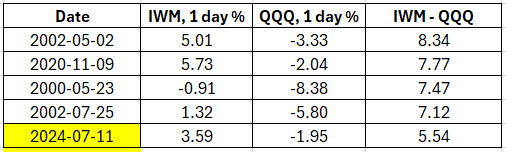
I saw this on twitter. Not sure of accuracy/not verified by me. Apparently the 5.5pp performance gap between IWM and QQQ is largest on record.
"Last time this happened…….."
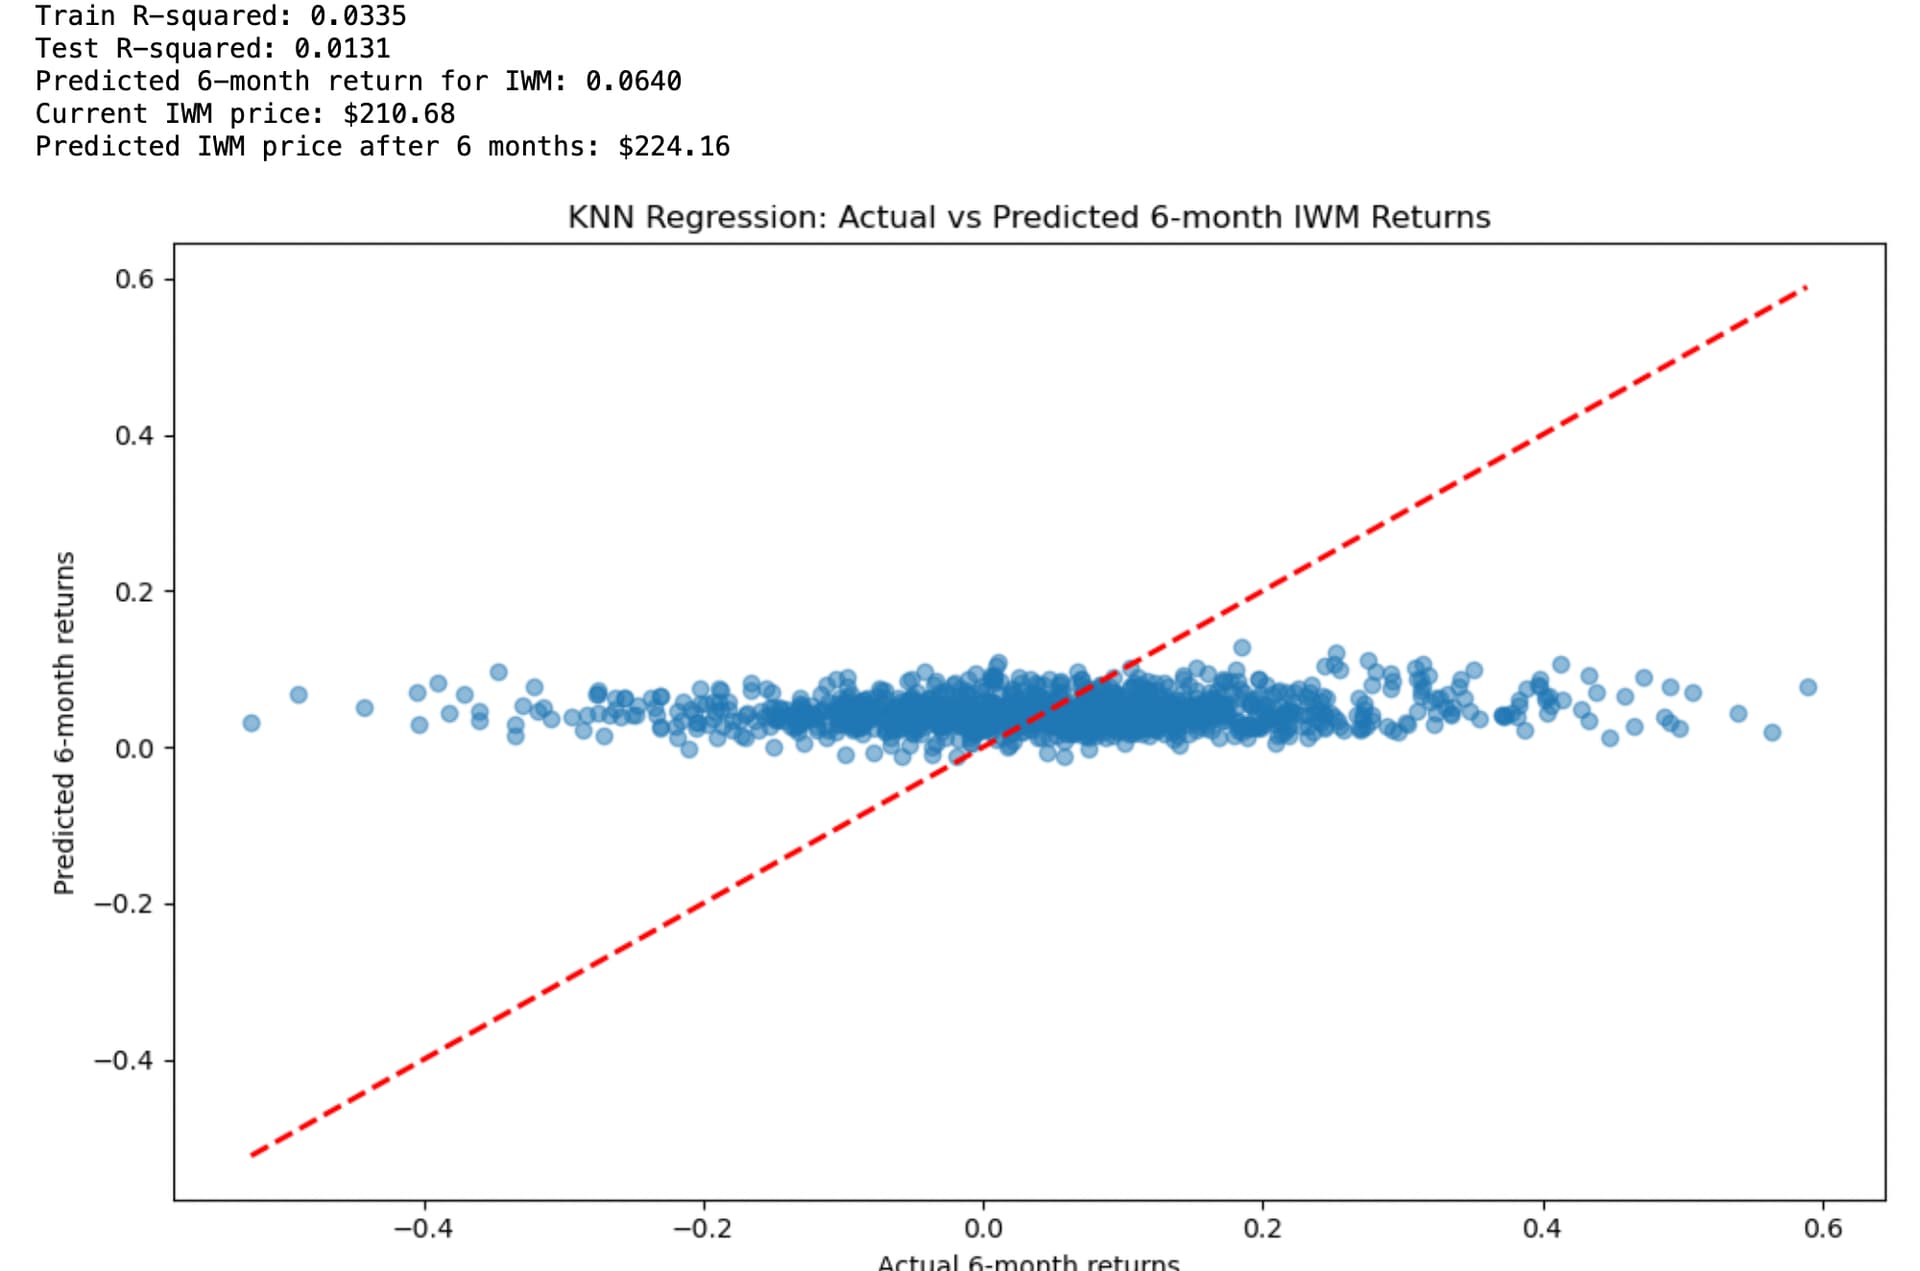
I like to answer that type of question objectively using k-nearest neighbors (n_neighbors = 100 here). And use cross-validation to see how predictive the data might be. I used the adjusted close 5/20/2000 - 7/1/2024 using Yahoo downloads.
Or I looked at 100 of the most similar days out of over 6,000 days in the dataset. Some smaller numbers that I tried for n_neighbors gave me poor R^2 scores. I did not do much of a grid search, however.
It does look positive for IWM using daily returns for SPY, QQQ and IWM and the next 6-month returns for IWM as the target (the average 6-month return for this data period was 4.17%):
3 Likes
According to our data, it is the 5th largest spread between IWM & QQQ. x.com
2 Likes
Very cool. I guess the recent event (2020) didn't leave impression on me despite the vlarge spread, as you show, difference not as rare as it felt.
1 Like
Here you go Spaceman:
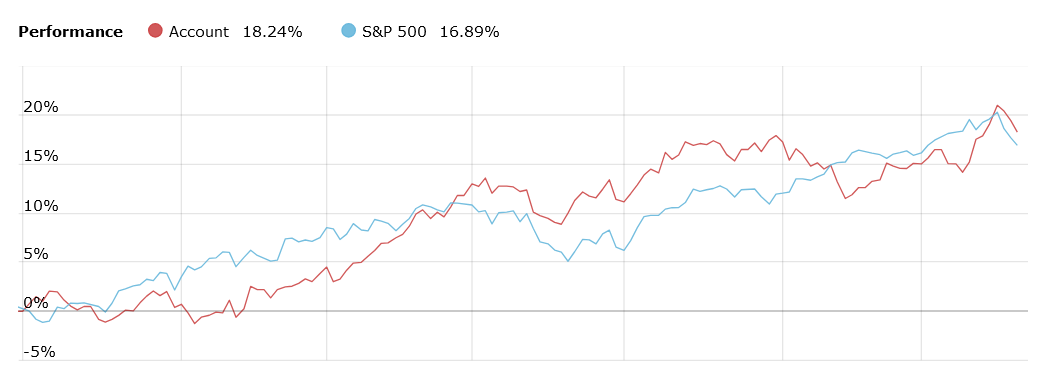
Terrible year for me. Are you guys doing ok?
same here, the tracking error of my book drove me cracy
... until I found out what the problem is:
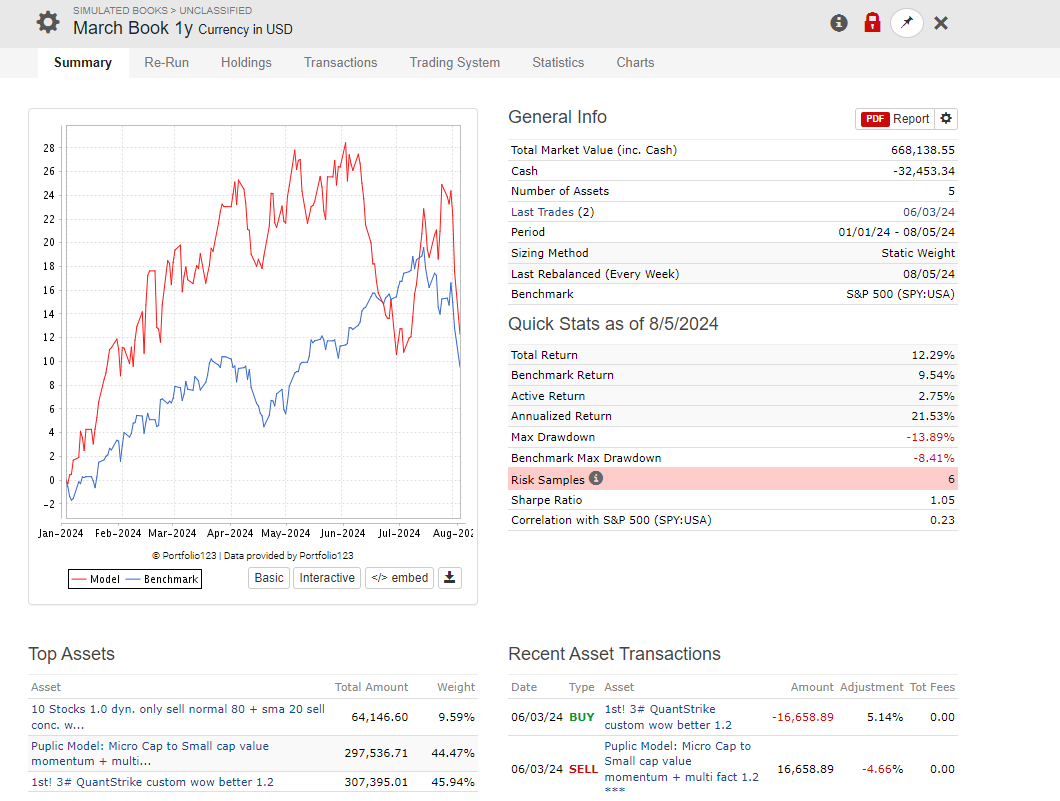
I exclude financials and they drove performance this year...
Longer term financials would hurt the performance of my models, so I did not change the system book...
But watching systems with financials now...
All the systems I use have > 2 year OOS, but still this tracking error really rattled me because I could not find anything comparable going back to 1999 (I think from 98 to 2000 they underperformed and tracked badly) so I really thought I made a systematic error.
When I found the reason I was really happy....
Best Regards
Andreas
1 Like
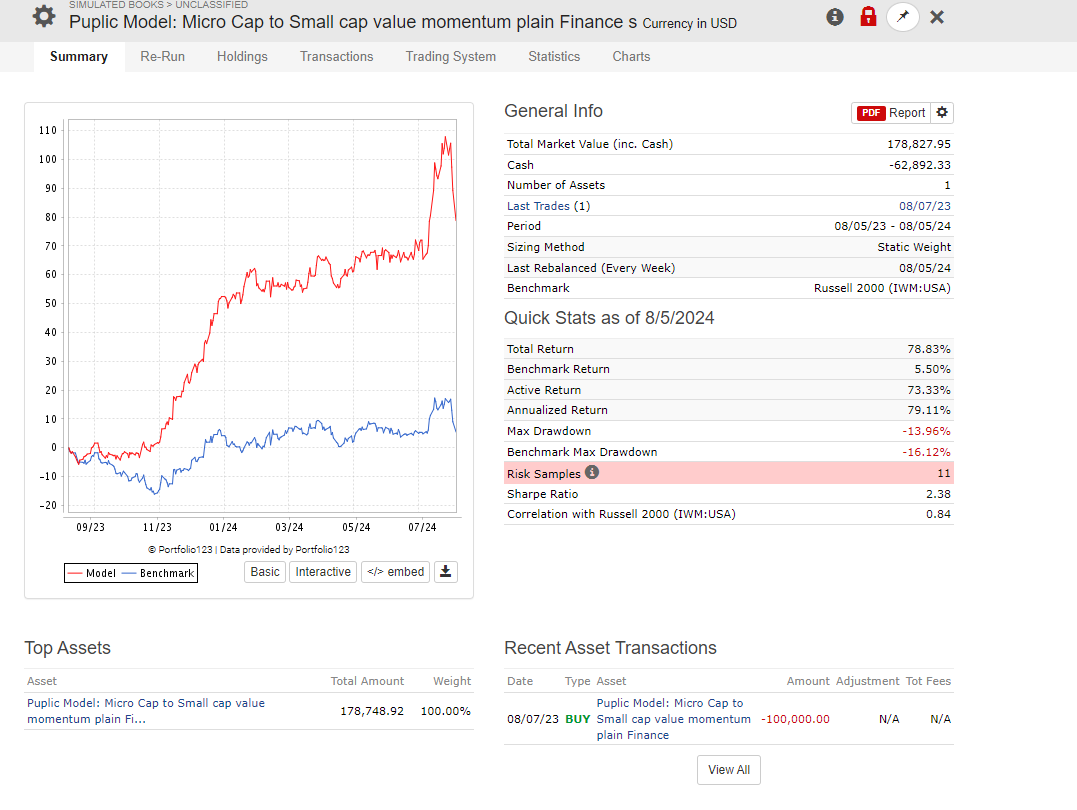
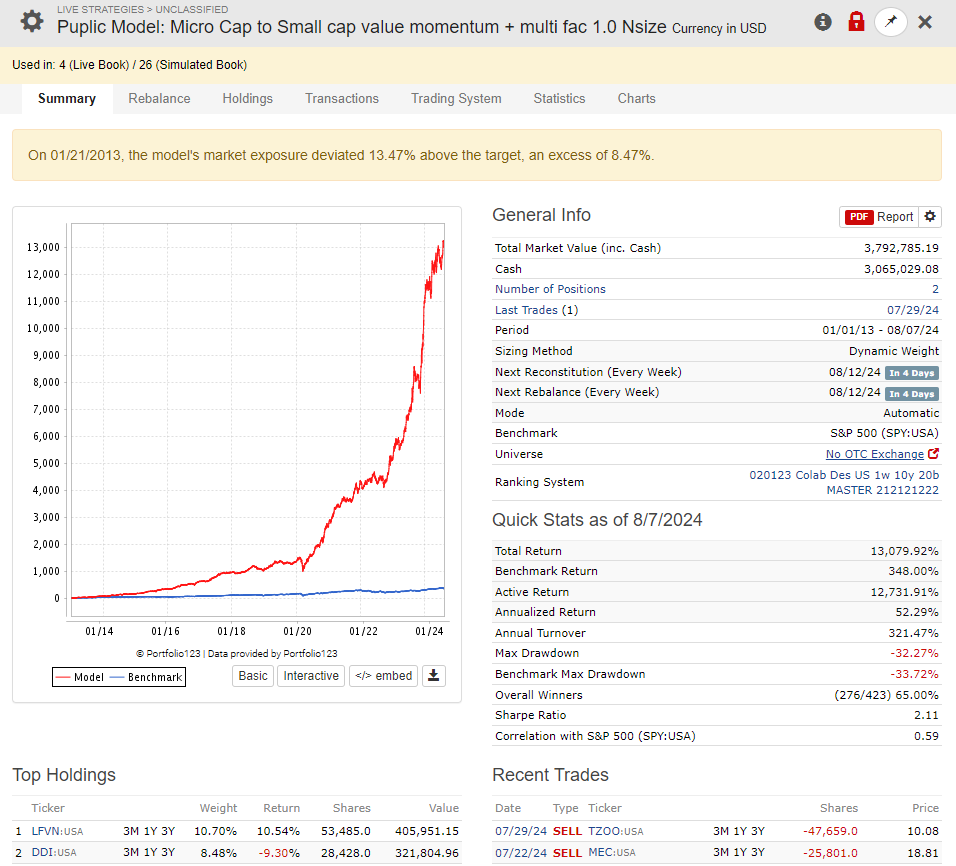
Also a good hint is this system:
It removes every factor out of the ranking system that favours small and micro caps (e.g. size, volume factors got deleted from the multi ranking system)
Buy rule makes sure that it only finds small caps.
So right now, this system is in 100% Cash, meaning, that small caps right now can not go through a very high rank treashold of ranking factors (mostly value, momentum, industry momentum, earnigns and quality)....
Meaning, if you exclude everything that favors small caps, right now there are no stocks to be found!
A strategy that favors small caps (low market cap) gives the stock a higher ranking because it is a small cap, not because it has a good factor loading...
This makes sense, the IWM has the worst earning (cummulative) right now from all major indexes (-17% or so, if I remember right...)
Andreas
4 Likes
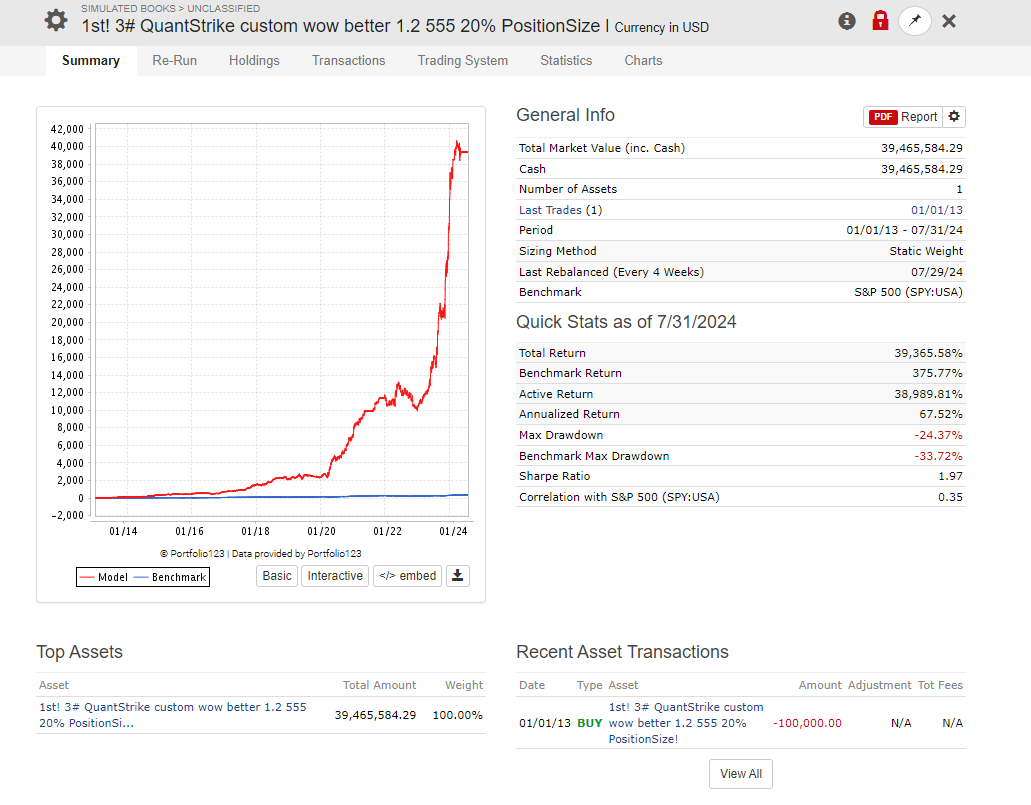
Differnt system, but again with no factors that favor small caps in the ranking system: it does not fin a lot of stocks right now!
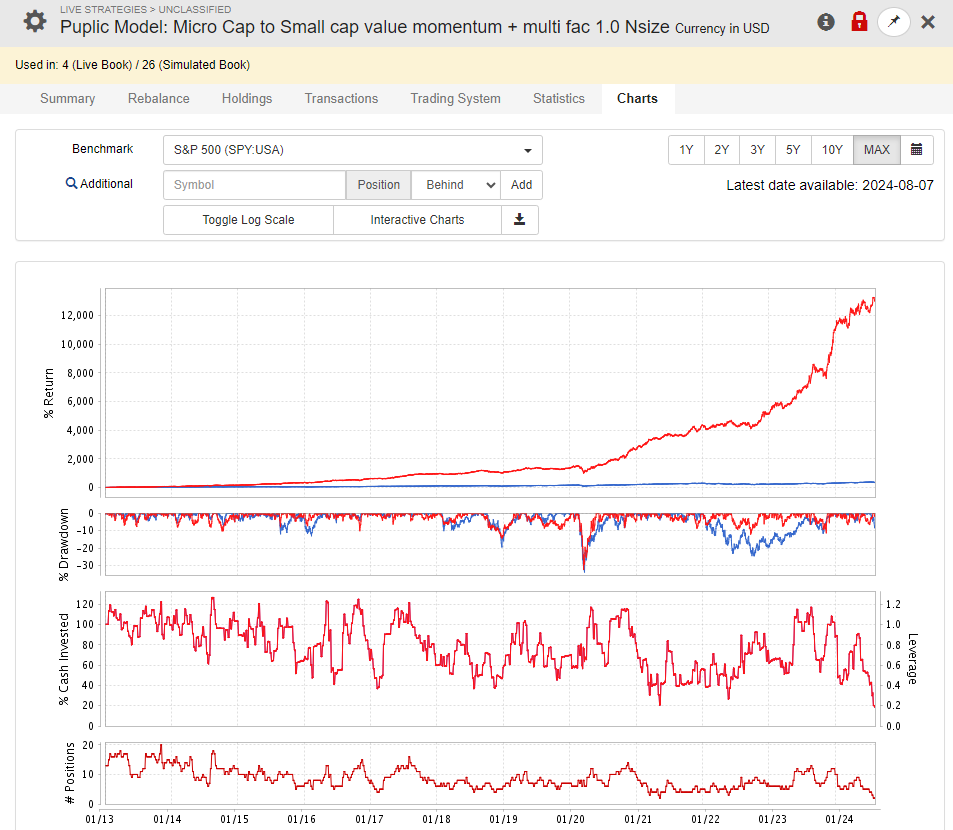
1 Like
Why do many people like to exclude Chinese/foreign stocks, OTC stocks, utility stocks and financial stocks?
Using the same liquidity screen, the inclusion of these stocks in my universe doesn't seem to cause much inconvenience.
well, it including financials does hurt performance with my ranking systems and very consistently basically since 1999 in and out of sample... would love to know how you do you include them and it does not hurt performance...
I just never considered ruling them out.
I only exclude stocks that are too illiquid and stocks that are priced too low and therefore have too many data errors.