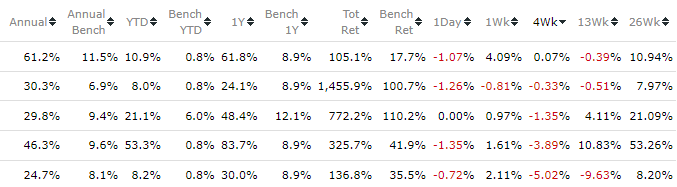
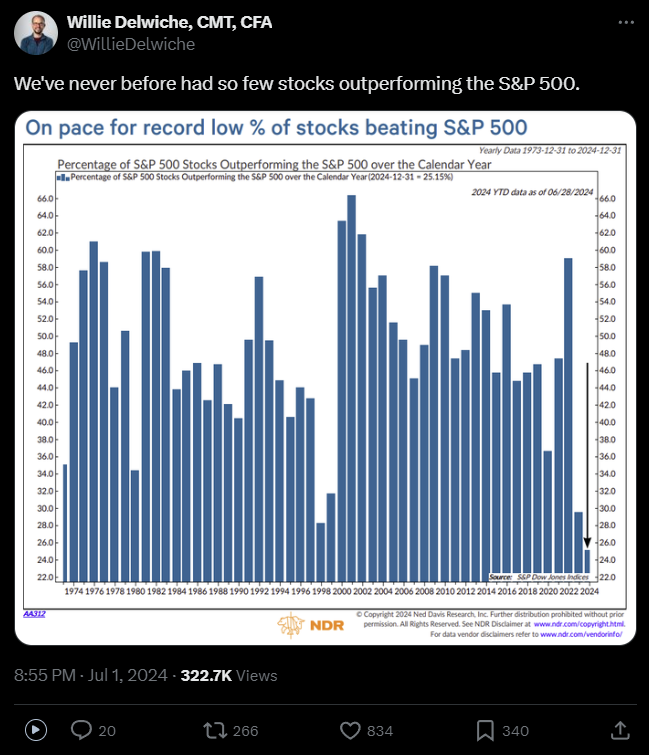
Don't know if others are in the same boat, but just wanted to post that my factors, ranking systems, screens, and portfolio has been underperforming the market badly over approx. past month and a half. I track expectation vs. index based on correlations and its just been really bad - like 5pp or more of underperformance vs. what I'd expect in that time - all while broad indexes regularly made new highs.
Breadth divergence is at extreme levels, but really odd to experience it in real time.
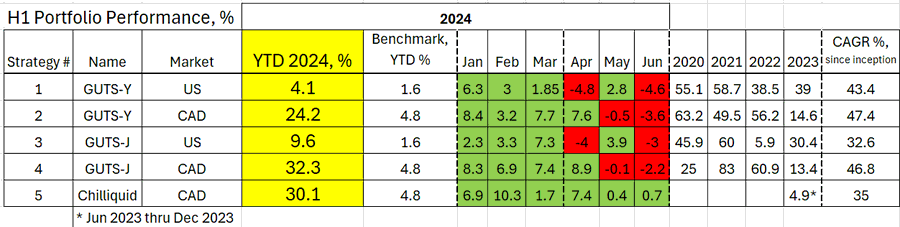
I was down in June also and about flat over the last 13 weeks, but still a decent year to date. All are US and Canadian universes. Mostly micro/small caps.
Thanks Pitmaster. I rarely make make changes once the strategy is live. Partially because I dont have time and partially because "if it isn't broke, dont fix it". I dont change the buy rules or universe rules, but I do override the picks a lot based on my feelings about the market. For example, I am getting a lot of top ranked stocks which are very cyclical and I have not been buying those because the recession I predicted 2 years ago is going to be here any day now
The first strategy in that screenshot is only a year and a half old, so I have not made any changes.
The next 3 all use the same ranking system created in 2008. Those 3 are smallcaps, Canadian micro/small and microcaps strategies. I have not changed the ranking system much since 2008. I did some testing this year to see if I should modify any rules but decided to leave it as is since something that has worked out of sample so long seems more likely to keep working then if I change it to squeeze out another 10% annually based on backtest results.
Last one is 4 years old and I dont think I have changed any of the ranking systems much. It uses 4 ranking systems. The main ranking system is value/momentum and then 3 more in the Buy rules that are filters like Rating("xyz") >= 25 to enforce some minimum levels of quality/financial strength.
All of them had 30-40% draw downs in 2022, so nothing magical here.
It has me thinking about diversification and what it means.
Despite having a high number of holdings across several screen approaches, Even though I use kitchen sink models I'm probably not diverse in factors. My positions across disparate industries will usually share alot of factors.
Many industries will also have little representation in my screens which I'm thinking about, but I look at them and don't understand how to profile the value creation mechanisms sometimes.
I don't know that my models would've ever bought and held something like NVDA though, despite it occassionally showing up on margins of some of my screens.
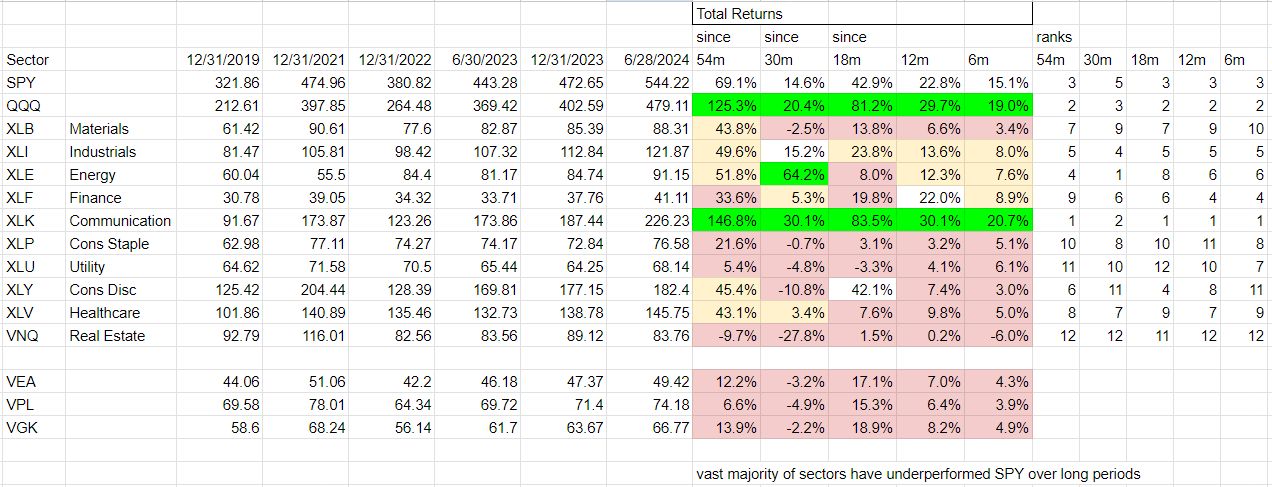
Was looking at sector performance over the weekend. Thought this might be of interest - shows total return by sector over periods of time going back to ye2019. Feels like there should be opportunity in here, but also reveals challenge of diversification recently.
I've been having the same exact thoughts as well given the relative underperformance of my multifactor strategies this year. I'm thinking I could benefit by having some momentum-focused strategies for times like these, so I'm starting to think about what the composition of that kind of ranking system could be. And granted the large cap space is a much more competitive space, but I could definitely benefit from a more large cap focused strategy too. I'm leaning on a couple decent looking large cap designer models for now.
As Victor mentioned, linked IBKR trading for Canada/EU would be incredibly helpful for diversification for those of us running linked accounts.
And as I mentioned in the sponsor thread, I'm willing to increase my pledge for Asian stocks support if it also meant linked IBKR trading would be supported.
It's the same with me. I've been investing for 18 years and managing money professionally for almost 12 years. This is, by far, the worst relative performance I've ever had. There isn't even a close second. This looks similar to the late 90s to me except not nearly as severe. My guess is that the small stuff stages a face melting rally. Could be tomorrow, could be a few years from now. Definitely opportunity for the insanely patient.
I'm just going to eat the underperformance for now. Sometimes I have to ask myself I really want to start altering my models that have worked for many years out of sample to accommodate (what seems to me) a very weird regime. Otherwise what does that to the model going forward when the regime changes again? Frankly, I'm just never going to stick with a model that picks gigantic megacaps at nosebleed valuations (or in some cases even declining fundamentals), even if that's what is currently working. It's just not in my investing temperament.
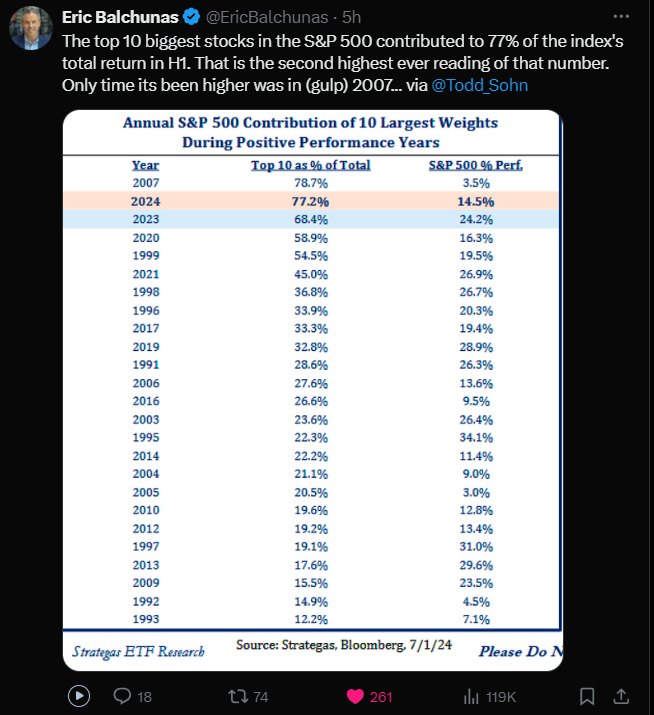
If anything, instead of fighting the impulse to chase performance I'm fighting off the impulse to get really defensive because this doesn't seem sustainable. Either the rest of the market is going to melt up to catch up with the Top 10 megacaps, or something else happens the other way.
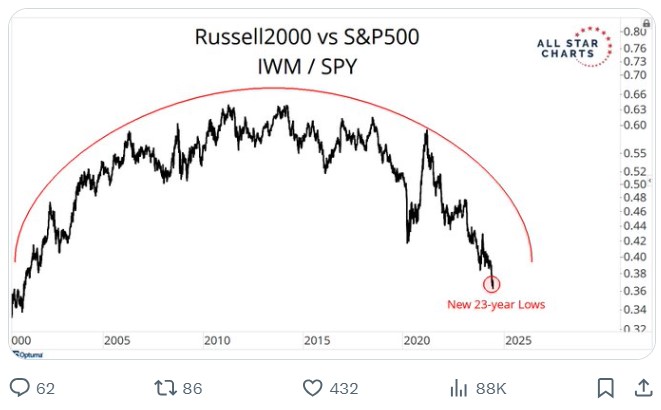
Interesting illustration but not clear what's being measured. IWM/SPY returns over a time period? How long? What unit is the Y axis? I see smaller negative numbers implying a "low". What does that mean? ty.
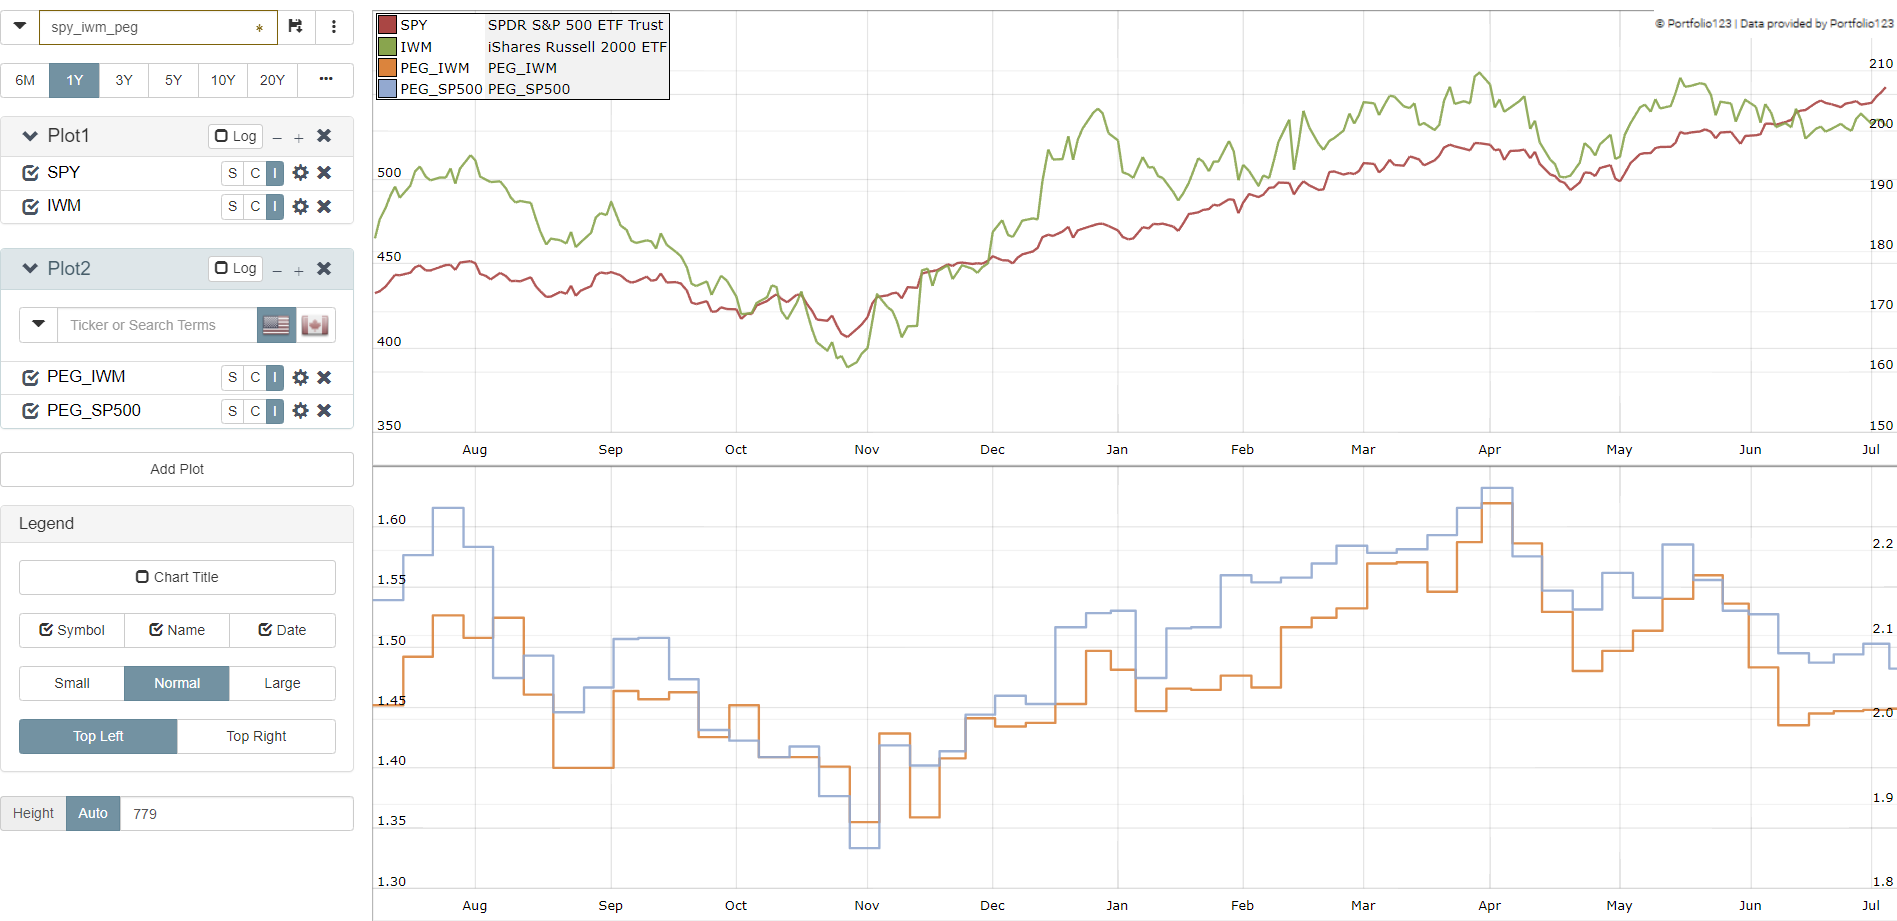
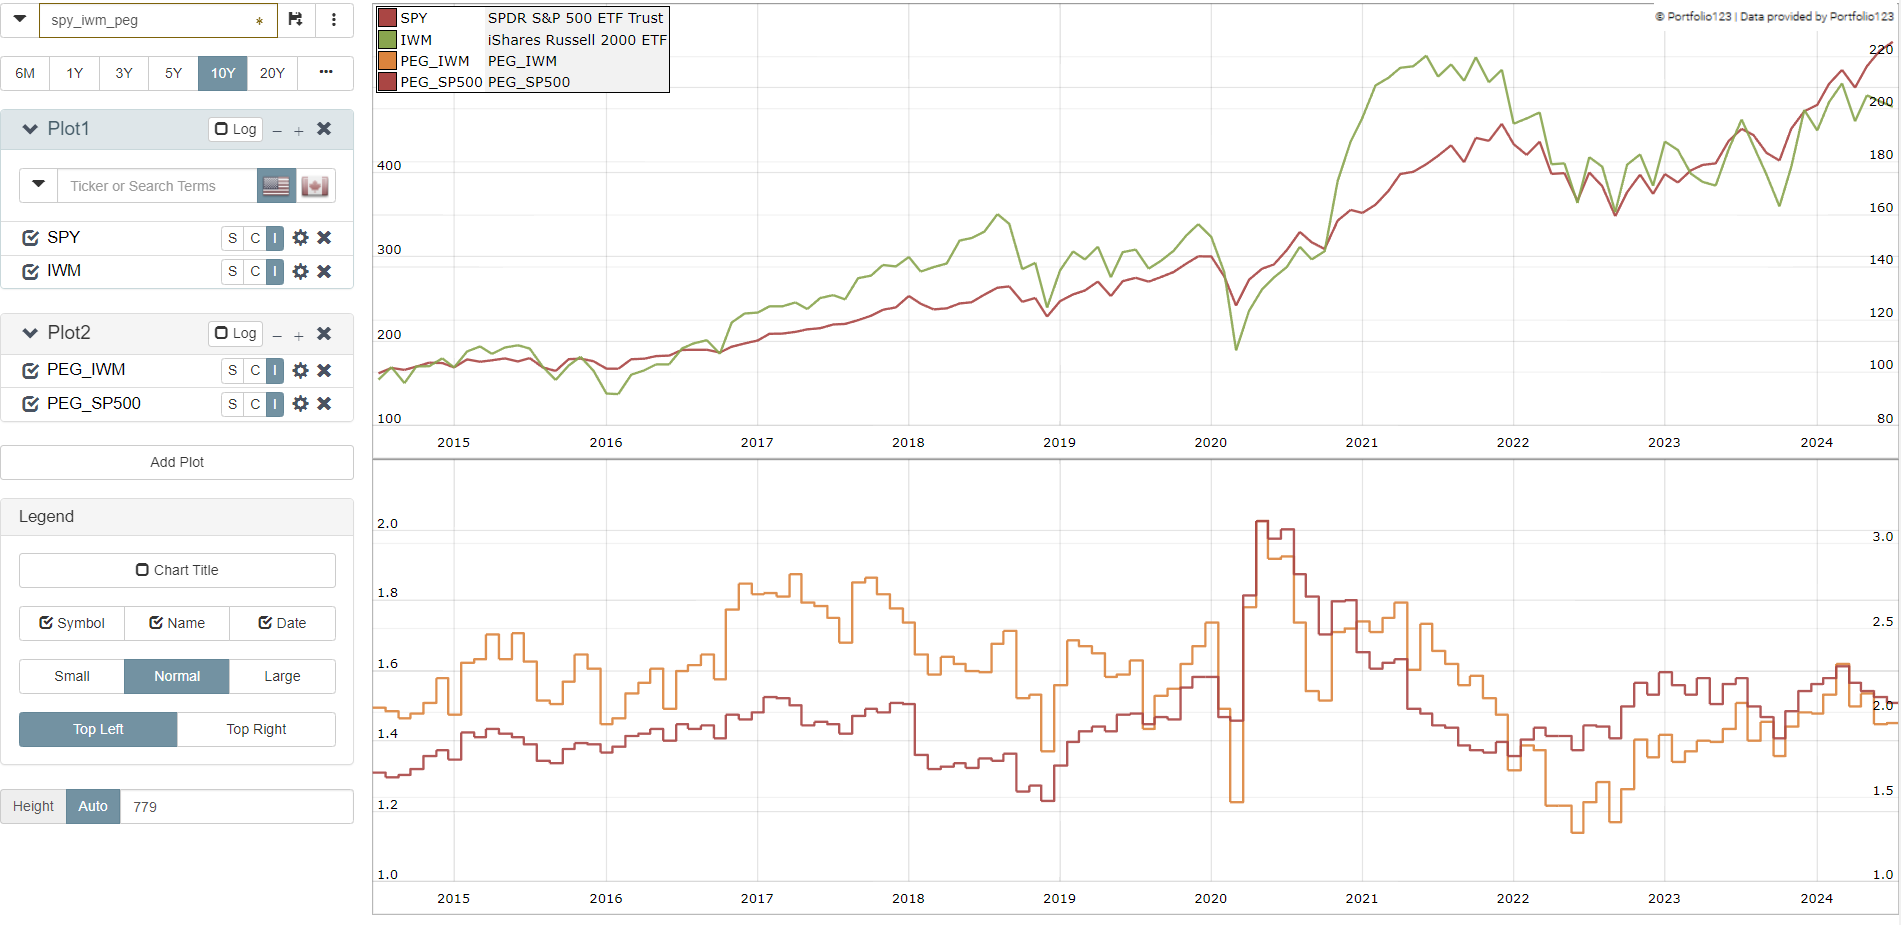
Ah - thank you. Anyone know how to create this in P123 instead with PEG of the two indexes or any other valuation metric? That may be more informative.
Create two custom series:
UnivMedian("1","PEGLT")
with appropriate universes (e.g., SPY, IWM)
and Insert them into Data -> Tools - > Multi chart
Interestingly, you can create a feature for all stocks based on aggrege peg value for each stock size category. Then your ml system would put more weight to small/large stocks depending on aggregate peg value.