As it was explained to me, Banks’s financial fundamentals are different from most equities. Revenue is the total of interest income, no accounts receivable, no inventory . . . Completely different way of feeding the kitty. But as there are a large number financial stocks it might be worthwhile to tailor a screen or AI model specifically for them.
1 Like
When I tried to exclude financial stocks, my in-sample performance dropped
I tried to develop a model for commercial banks but I gave up...
For commercial banks you would need to have access to very granular structure of financial statements. Secondly, p123 database is not templated for financial institutions - check this example below.
Q2 Interest expenses for Citi were 22.5B not 4.5B... It seems like IntExpQ contains only a part of cost of total funding. I checked also CostGQ - bit this is missing for banks. Therefore, for example the famous banking ratio net interest margin would be wrongly calculated.
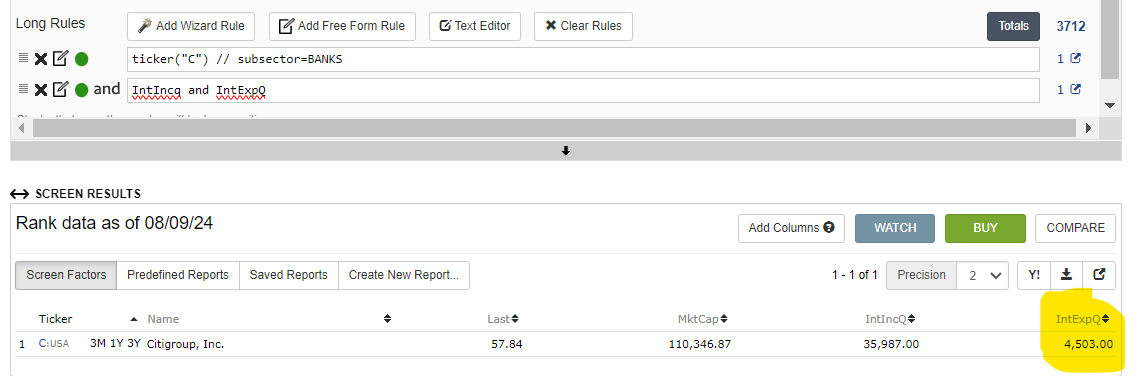
BTW, Citi is not classified in subsector=BANKS ... which is of course a mistake.
I think most of the major factors will be fine, so it's okay.
Edit: Also, I think this may be because IntExp does not include interest expense on deposits. This makes the factors adjusted with IntExp more comparable.
To address your second point, CITI's income from investment services is substantially greater than its income from being a bank, so the classification is correct.
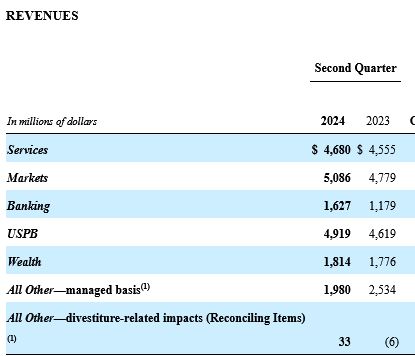
("Services" is treasury and trade services, "Markets" is trading, "Banking" is debt and equity capital markets, "Wealth" is global wealth management, and "USPB" is personal banking.)
To address your first point, ZGWZ is correct. The interest expense we use for all of our data is interest expense on debt.
1 Like
Some features just don't make sense for financial stocks. Like price to sales I would think. My understanding is that this is not even in a 10-K. So at best an NA in my ranking system for this feature—adding noise to my ranking system.
But also, I would not be surprised to find that even when financials use the same features the importance of the feature is different (which I have not taken the time to verify). But it may be trivial to verify this in the future when feature importances, permutation feature importance, coefficients for linear regressions and/or some other method(s) adopted by P123 is (are) included in P123's ML.
So what Bob is saying is obviously true. And I think people like Andreas and probably Yuval who can develop a different sim or port for financials are probably doing a wise thing.
That having been said, I just include financials in my port. And like ZGWZ, my backtests suffer when I remove them. Not sure, but maybe there is enough signal to be found in my ranking systems despite the noise from a lot of NAs for financials.
Or maybe just overfitting on my part, I guess. But I include financials fully understanding that Bob has a great point.
BTW, I believe Greenblatt of "Magic Formula" fame excluded financials with his particular features. I think he was actually an academic and in the business, so some good support for taking the time to sort this out (which I have not done yet).
It’s dated information but O’Shaughnessy in his book “What Works on Wall Street” 4th edition 2012 covers some of the different factors that work in different sectors. In his Sector Analysis chapter covering the financial sector. He points out how financials have varied over time as a percentage of the market and . . .
Value factors, PE ratios, buyback yield, EV/EBITDA, debt/capital, price/free cash flow and many other factors work fine. However, ROE, cash flow to debt, asset turnover and short them momentum had negative base rate. Throughout the chapter he notes that many of the sectors have different weighting for different factors.
Text
1 Like
The problem with financial companies boils down to one point: for many of them, particularly banks, debt is a profit generator. So looking at debt the way we do for other companies doesn't make sense. I never use enterprise value for financial firms; consequently EBITDA isn't terribly useful either. Also useless are cost of goods and gross profit. As Mihir Desai writes, "Banks are difficult to relate to because their balance sheets are mirrors of our own. The loans that you consider your liabilities are a bank's assets. And the deposits that you consider your assets are the bank's liabilities--its notes payable."
That still leaves us with plenty to go on. Free cash flow yield, earnings yield, price to book value, and dividend yield are all useful measures. Moreover, many financial companies do not use debt to generate income (for example, firms like IBKR and ICE)--those can probably be treated just like other companies.
Greenblatt did exclude financial companies in his Little Book that Beats the Market, and that's because enterprise value plays such an important role in that book.
I seem to remember that many years ago Aswath Damodaran wrote an excellent paper on how to value financial companies. It may be worth digging up.
2 Likes
As a simple experiment I copied an AI Factors and modified the Easy To Trade version to exclude both finance and utilities. Used the same Time Series Validation and with all the same parameters. The data without finance and utilities had ~2250 equities compare to the ~3000 before. Compared the Returns for 3 ML Models. The average results were only 0.7% CAGR better without finance and utilities. However, the consistency of the returns seemed better. Only 4 of the 51 excess returns 1.75 year periods had less than the universe excess return. With the finance and utilities 8 of the 51 excess returns 1.75 year periods had less than the universe excess return.
1 Like
What's the difference between the Sharp ratios?
Edit: My AI models still perform better when they are trained in a US microcap universe with Finance and Utility than the ones trained in a similar universe without them
Can you send screenshots of your results pages
I mainly use a mix of designer models, and it has been a bloodbath since begining of year, especially for one historical uber performing microcap model.
1 Like
How did you do last year? It seems that many US microcap models have surged at the end of last year.
Indeed, last year has been very good.
However timing of available money flowing in has been unfortunate.
It is just worrying to see the strategy underperforming so badly for 6 months...
Hopefully it might the price to pay. But who knows...
1 Like
Have you tried building your own Ranking systems
I built some but did not seem better performing than some designer models which had long out of sample performance (before crashing this year...).