My sims seem to be performing now like before the last big change, similar or better than Compustat. Only a few models performing a bit worse, so whatever Aaron and team fixed did the trick.
Also, I confirm that EPSExclXor is now performing like before.
Thank you very much for your reply regarding the difference between FactSet fundamentals and FactSet coverage, as well as your short interest-related update.
I believe differences between FactSet and CompuStat coverage are creating unexpected FRank function results. I don’t think this is a problem - we wouldn’t expect coverage between data providers to be exactly the same - but it looks like some re-calibrating is necessary.
Checking All Fundamentals, Legacy CompuStat coverage includes 6528 companies this morning.
Interestingly, new engine CompuStat coverage appears to include 6529 companies. It’s only a difference of one company but how is that difference possible?
FactSet coverage is 8252 companies. If this is intended, FactSet is probably including a lot more “pink sheet” companies than CompuStat. If so, and as an example, a ranking rule that selects half of all companies with highest market cap would identify fewer but larger companies in CompuStat than in FactSet.
Does this make sense? Is there any general information available on FactSet’s coverage vs. CompuStat’s coverage?
It seems clear this difference in coverage could have profound consequence for screens, simulations, etc.
Yes, some pink sheets, but a huge number of ADRs are now available in the US All Fundamentals database that weren’t there before. With Compustat we had no data for such giant companies as Tencent Holdings, Novatek, Samsung, Prosus, WH Group, Reliance, Softbank, Hermes, Iberdrola, and Kering, not to mention hundreds of smaller ones. I’ve already started investing in some of these new ADRs–there are a lot of promising candidates.
The median market cap of Compustat All Fundamentals stocks is $289 million; the median market cap of FactSet All Fundamentals stocks is $208 million.
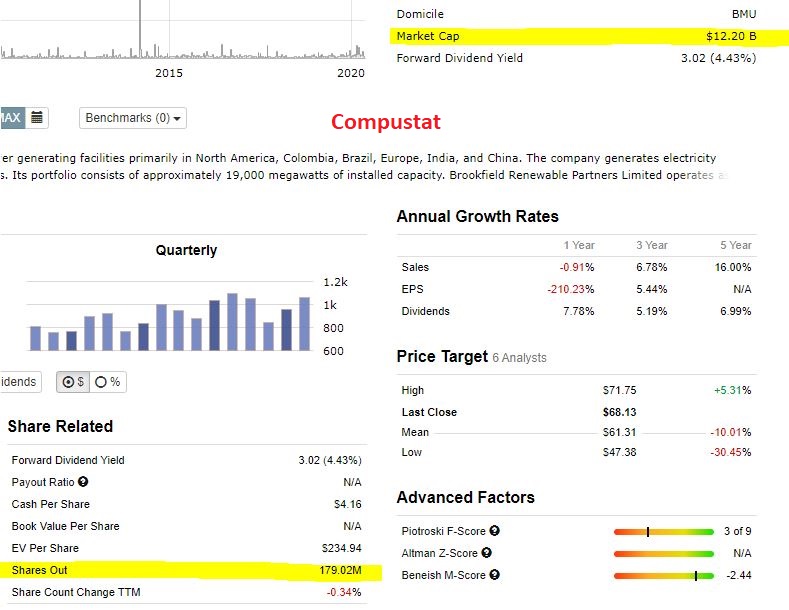
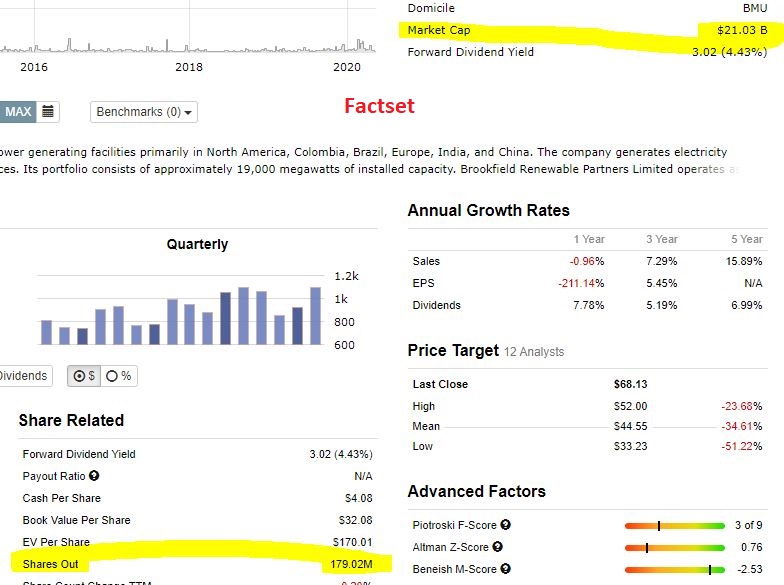
There seems to be an issue with Market Cap on the Factset server. I was looking at several CAN stocks and I stopped after the first US stock did the same thing. All the compustat numbers are correct. The factset prices shown and the shares out numbers are the same as compustat so I’m not sure how you are calculating Market Cap differently between the two data sets??
This has not yet been fixed, but it’s on our agenda.
Just to be clear: some companies report semiannually rather than quarterly. On the Legacy server and for Compustat data on the current server we give quarters with odd numbers N/A and quarters with even numbers the semiannual number. For FactSet data, on the other hand, (0,qtr) is the latest statement, (1,qtr) is the statement before that, and so on. This behavior is problematic because (4,qtr) would be two years ago rather than one.
We need to come up with a solution for all semiannuals, and haven’t done so yet. We’re working on it. In the meantime we’ll be changing the behavior of the FactSet server to be more like the Compustat servers.
The difference lies in the number of shares. For most companies, the Compustat and FactSet numbers for Shares(0,Qtr) match. But for some, they don’t at all. These companies are good examples.
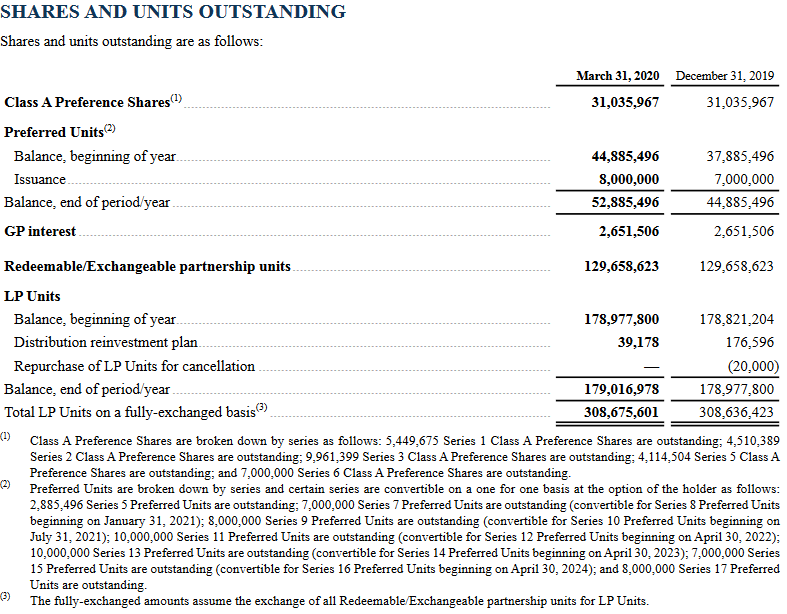
Let’s take BEP.UN:CN, for instance. Compustat says it has 179.02 million shares outstanding and FactSet says it has 308.68 million. I’m attaching the section of their latest quarterly report to show you where both numbers come from (the last two bold lines).
Is there a way to create a function: PeriodDatePQ? This would allow us to work around most of these data issues when combined with the existing function PeriodDateQ.
This way, for example, DaysDiff(PeriodDatePQ, PeriodDateQ) > 93 would expose all stocks with non-standard reporting intervals.
EDIT: Another, possibly simpler option is to create a function QtrsInPeriod. So for example, QtrsInPeriod > 1 would expose all stocks with non-standard intervals. Those wishing to compare quarterly financials of ADRs to US stocks can use something like EBITDAQ/QtrsInPeriod/EV.
I’m afraid that’s not a good solution. A lot of companies that report quarterly report irregularly in terms of the amount of time between announcements. We’re working on a better solution and I’ll update you as soon as we’ve got it.
Sorry, I wasn’t thinking straight. You were correct, that might work. We’ll certainly consider it, along with another option, which is to create a PIT universe of stocks that report semiannually.
In the meantime, here’s a rough workaround: #QPeriods-FHist(“#QPeriods”,52)) <= 2
Most of those companies will be companies that report semiannually. It’s not entirely reliable, though, as a few quarterly companies with issue changes or late reporting (e.g. UN, HALL) get in there by mistake.
The value shown on the Snapshot page for “Shares Outstanding” shows the same Compustat value when Factset is selected. That is one of the reasons my attention was drawn to this. I’m not sure if this value pointer is wrong anywhere else but I think it’s worth a look.
I’m holding back questioning the use of adding in the value of redeemable units but if that’s the only LP unit value that factset sends then so be it.
Yes, I know that the snapshot doesn’t match the market cap. In fact, it rarely does, even for Compustat on the legacy server. Take GOOGL, for instance. SharesOut is 300.05 million, price is $1409.46, you’d expect market cap to be $422 billion. But market cap is actually $962 billion. The reason is that the snapshot gives SharesCur(0). We rarely use that number to compute market cap. You really want to use the number of shares reported on financial statements, not the number of shares available on the market. And GOOGL is far from an isolated example. Look at DELL, MTCH, CRWD, CHWY, DISH, TW, DISCA, NET, etc etc.
As for “the only LP unit value,” you’re free to use other ones. FactSet gives SharesQ as 309 for Brookfield Renewable but gives SharesFDQ as 179. You could use a custom formula like $mktcap = Price*SharesFDQ if you think it’s better than our formula. You’ll see quite different numbers for SharesQ and SharesFDQ both for Compustat and FactSet for a number of stocks, and you can decide which one suits your criteria best.
We were talking about companies that report semiannually recently in this thread. I’ve figured out a way to screen for them on the Compustat server (and this will work on the FactSet server in the near future too):
sales(0,qtr)<>na and sales(1,qtr)=na and sales(2,qtr)<>na and sales(3,qtr)=na and sales(4,qtr)<>na and sales(5,qtr)=na and country(“usa”)=0
This brings up 146 companies in the All Fundamentals universe.
If you’re using quarterly numbers for companies that report semiannually, you might want to make a few minor adjustments. Quarterly numbers from the income statement and cash flow statement will be twice as high as those for other companies (TTM, annual, and balance-sheet-item numbers will be fine). Almost all fundamental items will give you NA for odd-numbered quarters and formulas that end in PQ.
Thanks for the formula. One stock, SMSMY, Sims Ltd - ADR, was excluded using this formula even though it has semi-annual reporting. A slightly more accurate rule is:
sales(0,qtr,keepna)<>na and sales(1,qtr)=na and sales(2,qtr)<>na and sales(3,qtr)=na and sales(4,qtr)<>na and sales(5,qtr)=na AND (!country(“usa”) OR Universe($ADR))
This brings up 147 stocks in the fundamental universe. I spot checked many of the stocks and it looks accurate.
Q. Is this how semiannuals will be treated in FactSet going forward?
EDIT: I checked my notes and there are some stocks that slip through the cracks. For example, a newly listed company may not yet have five quarters of sales reported. I think that we need a more direct way to find these semi-annual reporting companies.
I would urge caution about relying on the share count from the financial statements. It can be stale when there has been a large share issuance or buyback after the closing date of the most recent financial statements. I have been burned on this in the past. Caveat emptor. You don’t want to be trading based on stale information when the rest of the world knows up to date information.
SharesCur(0) has the advantage in that it is up to date as of the latest trading day. OTOH, as you brought up, SharesCur(0) is not accurate when there are multiple share classes and such as in the examples you gave above.
Solution: We need a up to date share count that includes all share classes.