Is hedging no longer displayed? Or am I missing something?
Agree Walter distribution of returns over a given time period is very important. I track these for all the models I subscribe to and calculate them myself. It would be nice to have these just like the simulations and backtests. They are so important to picking the type of trading style you will implement.
Cheers,
Mark V.
Nice. Though it seems that the benchmark for some designer models should e reflected to something that is more appropriate to their holdings
This is a good idea.
Why hide information that is available? Anyone interested should be able to see backtests. What to actually do with this info is up to - and always has been - the judgement of the Individual.
Marco,
Edit. My original post was too specific to my own methods. What I should be saying is that it is easy to overfit, mis-specify and/or have problems with multicollinearity. Very easy.
Ultimately that is why the designer models are having troubles.
There are good ways to deal with that and we see people who are effectively dealing with these problems in the forum. With multiple different methods.
When those problems are dealt with, P123 is a great tool!!! Thank you for making it available.
Jim
1 Like
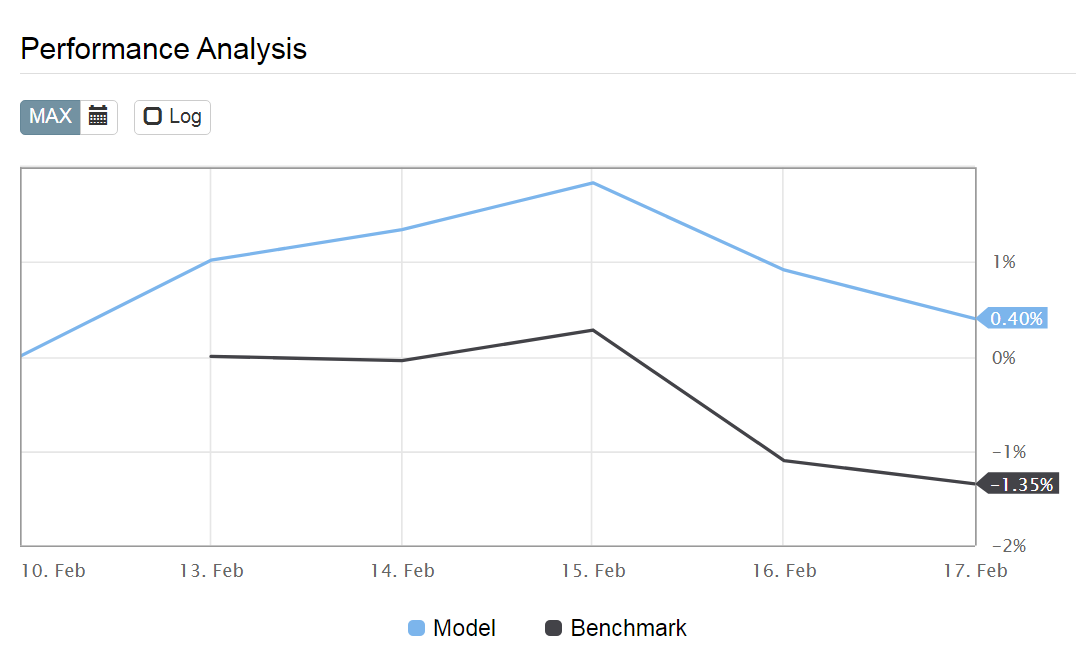
Marco, while P123 is providing a new presentation for designer models you may consider rectifying a small error on the performance graph.
The benchmark start date is always one trading day later than the model start date, as one can see below:
1 Like
Werner - Backtest is not “information” but “data”.
Also, there is a difference between being allowed to see data and portraying it as performance. While you may understand the difference, most people don’t. That was clearly evident when the DM platform was originally launched. Simulation <> Performance.
1 Like
Steve,
good point.
Still, I believe the data (as information) should be visible by someone interested, How to interpret it and how to use it, is a different ballgame.
I think there is a quick fix for low participation: One click subscribe without the need of beeing a subscriber (not even
the 25$ Version a month). Two step checkouts are terrible at conversion (first member, then subscribing to a model).
Or we might find a way to say: hey, I subscribe to this model and the cost for the 25$ is sponsored by the model designer (e.g. if the cost would be 100$, the model designer gets only 75$ gross and then the other deductions by P123.) Or p123 and the model designer split the 25$ bucks. Whatever, we need to get creative here.
Again, everything that needs two steps in a check out process in e-commerce has 10 times less the chance to get a conversion.
Amazon invests 100 of millions in their checkout process, they still try to improve it every day, a whole team is working fulltime on conversion analytics.
But again, the assumption that one step is better than two steps is a no brainer…
Easily done with individual landing pages for each model (automatically generated by p123 and easily marketable by designers).
(yes I hear you, but that must not be bad for p123, the moment the sub subscribes based on a one
step process, the landing page of the model gives hints to a other membership options to p123, videos on how to design own models etc.).
Best Regards
Andreas
Andreas,
I do not have degree in marketing but the checkout process is an interesting topic for machine learning.
And it is not just Amazon.com. Netflix will test which image gets the most clicks!!!
A little research will find a huge body of literature on A/B testing (which may have the most literature).
But I like Thompson sampling. An online learning algorithm that mostly uses the most effective webpage but occasionally samples the other choices in an optimal way.
Proven to be the most effective way of finding the best web page and using it with the least sampling of other (inferior} strategies without prior knowledge of subscriber characteristics.
Maybe slightly off topic but I think it is not (an extension of your excellent good suggestion).
Or we can just let the online companies figure it out for us and never use it ourselves. They will end up purchasing smaller companies anyway—in part because they do stuff like this and we don’t.
More generally here is the code for Thompson sampling (you will want to adjust the success after each run manually when using this code (gets a click is a success). Strategy would be a web page layout in this code:
import numpy as np
strategy1_successes = 3
strategy1_failures = 2
strategy2_successes = 3
strategy2_failures = 2
import numpy as np
a1=strategy1_successes +1
b1=strategy1_failures + 1
a2=strategy2_successes + 1
b2=strategy2_failures + 1
trade_strategy1 = np.random.beta(a1, b1)
trade_strategy2 = np.random.beta(a2, b2)
if trade_strategy1 > trade_strategy2:
print(‘fund_trade_strategy1’)
else:
print(‘fund_trade_strategy2’)
It ran just now. Simple, no?
Jim
Thanks for feedback.
We’ll fix the performance chart
The streamlined signup is a great idea
Re. Designer channels… most designers already have their own channels where they publish. Do you mean having a designer blog hosted by p123 ?
Marco any comment?
- Good or bad idea?
- Not a priority?
Thanks,
Mark V.
Sure , these are great and they are already computed, so very easy to add. But they are since the inception of the simulation. Are they still meaningful?
We’ll do many tweaks in the next release of model presentation, including showing backtest data on request, and adding these stats clearly labeled that they include backtest data. We’ll just combine realized and Realized and present the stats in two columns, one for winners , once for losers.
Sorry, this is off topic. But my resolution for this year is to learn python. For someone who has not programmed in 20 years, where do you suggest I start? Any coursera or other resources recommended. Thank you!
Hi RT,
My ranking system is based, to a large extent, on a Python program. So I use information from a Python program every day.
But I am a big fan of Occam’s Razor. So I am not really doing anything very complex at the end of the day. No neural-nets looking for complex interactions of 100 different factors in a black box in other words. I will not get into the details of my strategy but it is quite the opposite of that.
With that in mind I would like to mention a free open-source program called JASP. I was introduced to it through a Statistics course my daughter took at the university. I pretty much took her courses in statistics along with her. She had educational access to SPSS but the teacher found this free rip-off of SPSS to be better for much of the course. And it is better in many ways. It attempts to duplicate much of SPSS and add Bayesian alternatives to SPSS frequentist statistics options.
JASP download site: jasp-stats.org
BTW, you can no longer read any medical literature (e.g. studies about COVID-19 treatments) without having them discuss posteriors and credible intervals (Bayesian statistics).
Example of use of Bayesian statistics in medical literature: Effect of Higher-Dose Ivermectin for 6 Days vs Placebo on Time to Sustained Recovery in Outpatients With COVID-19
JASP has recently added machine learning options that are quite capapble… With cross-validation and prediction. This with a drop-down menus. If you have the data you could be doing a random forest by this evening. And keeping with my Occam’s Razor idea you could be running a Ridge Regression also.
Not to mention learning a little bit about Bayesian statistics.
But I do like and use Python. SteveA is an excellent programmer but was not initially trained in Python. With his training and natural abilities he is now well versed in Python.
SteveA has mentioned the usefulness of this site in the forum for good reason: w3schools
This site seems simple, because it is. One simple idea at a time but pretty much all of the ideas you will need by the time you are done.
The next step, I think, would be the O’Reilly series of books. This is one I have read and can recommend: Introduction to Machine Learning with Python: A Guide for Data Scientists
I am not sure what to say about Coursera. You can still audit some courses there but most have a fee now. Not an outrageous fee if you are motivated and know that a course is good. 30 to 40 dollars per month. So you can get a whole course (or series of courses) done in a month for 30-40 dollars.
I audited a course about 3 weeks ago and found it boring and have not been back.
But for sure I can recommend paying the money for this course if you ever want to spend any time with neural-nets: Deep Learning Specialization
TL;DR. Do download JASP no matter what you do. Visit w3schools today or this weekend when you have time. O’Reilly can get you going with most of what you could need even at an advanced level.
I hope that helps some.
Jim
1 Like
Marco, no, how do I do this? Thank you.
Sorry to press, but a 1 Step checkout would be great, best with a split of the 25$ membership, thank you!!!
Best Regards
Andreas
Jim, Thank you!!!
Yes, Amazon and Co use AI (and tons of data based on the behav. of the user on the checkout), but the sample size of users would be to low in case of p123. But a one step checkout process is really a no brainer. I do not have a marketing degree either but worked on some checkout processes in projects, one little change of the checkout process (for example adding a popular paying method or a seamless checkout process) can make huge differences in conversion, not much work, but huge effect, we had sites where we increased the conversion up to 30% over night just by try and error and by "going in the shoes of the customer " and measuring the clicks (amount of clicks) of the checkout process…
Best Regards
Andreas
Andreas,
Thank you. I agree with all of that.
And I do not mean to imply that Thompson Sampling would actually be useful for P123 when I say this. But IT IS AMAZING, ABSOLUTELY AMAZING HOW QUICKLY THOMPSON SAMPLING WILL LATCH ON TO THE BEST SOLUTION!!!
Unbelievable really.
BUT YOUR POINTS ARE ABSOUTELY CORRECT AND SHOULD BE CONSIDERED BY P123!!!
In this regard I have a friend whom I would like to share a strategy with. I would like her to sign up with P123 to learn some of what we are doing but I think she will not. Net result: she will not be signing up and I will not bother to provide a designer model for her to subscribe to.
So I definitely get your point without any appeal to machine learning.
For those with any interest in Thompson Sampling (again maybe not for P123 as Andreas suggest), one can test this with a large amount of data and various ranges of differences in the “payouts here.”
Note this is actually a classic “Multi-armed bandit problem” and accounts for the use of “slot machines” in this code. I did not attempt to run this code today and it may not be perfect. You will have to figure out the indents:
import numpy as np
number_of_turns = 1000
number_of_slot_machines = 6
number_of_positive_rewards = np.zeros(number_of_slot_machines)
number_of_negative_rewards = np.zeros(number_of_slot_machines)
np.random.seed(33)
conversion_rates = np.random.uniform(0.01, 0.15,number_of_slot_machines)
or i in range(6):
print(‘conversion rate for slot machine {0}: {1:.2%}’.format(i, conversion_rates[i]))
np.random.seed(55)
outcomes = np.zeros((number_of_turns, number_of_slot_machines))
for turn_index in range(number_of_turns):
for slot_machine_index in range(number_of_slot_machines):
if np.random.rand() <= conversion_rates[slot_machine_index]:
outcomes[turn_index][slot_machine_index] = 1
print(outcomes[0:15,0:6])
for i in range(6):
print(‘mean for column {0}: {1:.2%}’.format(i, np.mean(outcomes[:, i])))
for turn_index in range(number_of_turns):
index_of_machine_to_play = -1
max_beta = -1
for slot_machine_index in range(number_of_slot_machines):
a = number_of_positive_rewards[slot_machine_index] + 1
b = number_of_negative_rewards[slot_machine_index] + 1
random_beta = np.random.beta(a, b)
if random_beta > max_beta:
max_beta = random_beta
index_of_machine_to_play = slot_machine_index
if outcomes[turn_index][index_of_machine_to_play] == 1:
number_of_positive_rewards[index_of_machine_to_play] += 1
else:
number_of_negative_rewards[index_of_machine_to_play] += 1
number_of_times_played = number_of_positive_rewards +number_of_negative_rewards
for slot_machine_index in range(number_of_slot_machines):
print(‘Slot machine {0} was played {1} times’.format(slot_machine_index, number_of_times_played[slot_machine_index]))
print(‘\Overall conclusion: The best slot machine to play is machine{}!’.format(np.argmax(number_of_times_played)))
Jim
Will that include return distribution?
What return distribution?