In addition to reporting the average return per trade also include return distribution. A low average could indicate large (small) losses against large (small) gains. Having a measure of return distribution would be informative.
So something that doesn’t even exist right now in Research
We do have Biggest Winner/Loser in % terms. That would be easy to add.
Yes, the return distribution is not currently available and would require some development time. I like the idea. Maybe others could chime in.
I rarely look at the biggest winner/loser stat.
Walter,
Like a histogram? That would be easy. I would be surprised if Yuval has not already done that on his own with excel.
On a more complex level we all know that the stock market has “fat-tails.” I mentioned JASP above. There I model the effect size prior as a t-distribution with 3 degrees of freedom (which not so coincidentally, has a fat tail). You can obtain the standard deviation from your own data.
A serious question that could be address by P123 initial with a historgram, I think.
Jim
Return distribution is important and being able to get the stats with different start and end dates. 2018 - 2020 was not good for value but value models excelled last year while growth was bad last year.
Yes, a histogram would be perfect. Maybe it’s the old engineer in me, but whenever someone mentions average, I starting wonder about the distribution.
In order to make representation of results more realistic I would include “Biggest loser” but NOT biggest winner.
That will skew the results a little bit to the negative side and thus dampen “euphoria” and unrealistic expectations.
Just one parameter in judging a trading system though.
Hi Marco,
Can this PDF-report be added as an output for the client.strategy api as well? I think that would be very useful.
Kind regards,
Victor
I started playing with JASP today based on your recommendation. So far I really like it. It has a much cleaner interface than SPSS and a lot more community support.
Thanks for the rec.
Tony
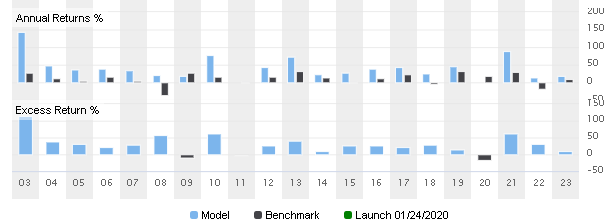
Marco - how about adding LAUNCH selection for annual performance and make LAUNCH the default for both annual and interactive? This would be fairly easy to implement and still showcase performance while letting browsers surf through backtests.

Walter,
TL:DR: Thank you for your post. I would not have played around and found bootstrapping in JASP without your post. I thought I might share that.
I do not think P123 will ever provide this but sometimes the information is not that hard to get by downloading P123 data and using outside platforms. Another VERY useful piece of distribution information is the bootstrapped confidence interval (99% confidence interval for the mean as in image). The confidence interval for the mean daily return is bootstrapped in the image.
This gets around questions of normality when finding the confidence interval and finding significant stock factors (or sims, screens, ports etc). Ideally after finding a sim that seems like a good one the lower bootstrapped confidence interval for excess returns (relative to the universe) would be positive.
This can be obtained in JASP. Here is the bootstrapped confidence intervals for excess returns of a few single-stock-factors I am looking at. I have not included the factors as you will want to look at your own.
IMHO, the bootstrapped confidence interval is the single most useful way to look at the distribution but others are included in the image here. BTW, it will also give you a histogram if you want:

Jim
Just my personal opinion here…but I think visibility and ease of use for the broad public are some of the issues. Honestly, it has been years since I even looked at the marketplace. This is what I think it would take to make the model marketplace more appealing…
Have a site completely independent of Portfolio123 for the marketplace. It gets lost in the sea of tools and features here. Also, those of us who pay a fair sum for Research level subs may not be the target market. And a new P123 subscriber at a lower tier is likely to be overwhelmed with the site. I think a new clean and super streamlined version for just the marketplace would make sense.
Ease of use. It would be good if you could automate basket trading or model trading with the click of a button. Just getting an email of signals is not enough. Perhaps an agreement could be made with Robinhood or others for free trading (if so desired but not obligated). An interface where you can choose multiple strategies, weighting for each strategy and with one click it will create the portfolio (with fractional shares for low cost).
One other idea is that direct indexing is starting to gain momentum. This could also be part of the site where you pick a common index and then have various filters to have a factor tilt, lower volatility or whatever. But it would require fractional share trading and free commissions to make it viable for the average person - which is who would be using this I think.
I wonder if there's demand for a tool to post-process a strategy's transaction file? Processing could include all kinds of metrics. P123 wouldn't even need too be involved.
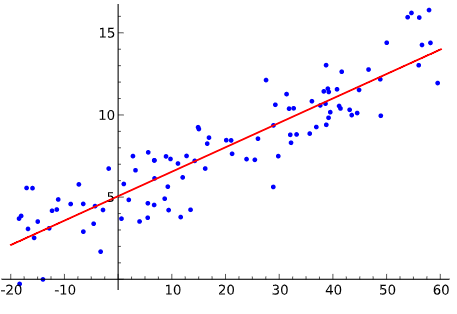
Just a suggestion, but how about putting in a graphical representation of a regression line that measures alpha over the period that is chosen.
The idea here is that the regression line will essentially show whether the strategy loses alpha over time, which can indicate that it is over-optimized for periods at the start of the test period, or that when it comes out of sample it loses its ability to produce alpha on average
I am not sure whether to look at annual or monthly alpha, but the most important thing is to show that alpha is increasing. It can certainly be beneficial to have monthly alpha to increase the number of data points:
Marco - I have been trying to launch a Generative AI designer model but that is pretty much impossible with the current DM setup. The prime issue is that certain stocks such as NVDA and ANET have had too much gain relative to total profits in backtest. I can try to skirt this issue by suppressing such stocks in order to launch a model, but this would not do justice to the market opportunity in front of us. Additionally, showcasing a 10-year backtest for this sort of model is quite meaningless because the niche didn’t really exist, or at least the sentiment didn’t exist 10 years ago.
Steve not quite sure what changes you are proposing.
Override for the max 20% contribution by any one stock to start with. Then set the default graph display to “since launch” thus de-emphasizing the 10-year backtests.
Marco or Yuval - why are some simulations being suppressed? As an example, this DM has 2 subscribers but only the post-launch graph is displayed.
Simulations are displayed 9 months after launch. Before that you have to rely on what the designer says about the simulation and the out-of-sample record.
Is there any way to see all the models’ annualized out-performance since launch side by side?