I read his book and have used many of his ideas (plus some others) in a port that I have successfully invested in for over a year. The key for me was to combine his ideas with fundamentals-based growth criteria. I use a modified Russell 3000- based universe (higher minimum liquidity and market cap). My ranking system looks for smaller cap companies that are growing. What is interesting about it is that it has a sub 75 R-Squared as compared to any ETF, be it SP500, R2000 or R3000. So I am not sure what to benchmark it against. That might be part of the problem in evaluating his strategies - what is a suitable benchmark? I don’t know but I like my port…
Tobias,
I was trying to study your Sims listed in your posts above, but ran into a problem of the specific detail of your custom formulas. Some of them I think I can figure out based on their description, but I may miss some detail. I started with your Sim “All Stocks Growth” and copied the various ranking systems (the main one and those listed in the rules), but was stopped by not having the specific details for these custom formulas:
$externalfinancing
$DepEx2CapEx
$TATA
$TAAA
$ChgNOA
$ShareholderYield
It would be helpful if you could either make them public of list the formulas in a post so we don’t have to try to guess the details. Since there are 6 custom formulas used in the first Sim, and you have made all 19 Sims public, I assume there are many more in the other 18 Sims. Any help you are willing to provide will be greatly appreciated.
Hi Denny,
sorry for that, I have shared all of the requested custom formulas now.
I knew I would miss sharing something. (I tried hard not to screens, universes, ranking systems, …)
I will double check again, but if you come across any more, just tell me and I will make them public immediately.
That might actually be a great new feature to have a option (cascade public), so that if you make a sim public, it automatically makes all required universes, custom formulas, series, rankings etc. public as well.
Hi Denny,
I just noticed, that I have not replicated O’Shaughnessy’s definition of shareholderyield identically.
His is definition is “Shareholder yield unites a stock’s dividend yield with its buyback yield to show what percentage of total cash the company is paying out to shareholders, either in the form of a cash dividend or as expended cash to repurchase its shares in the open market. Thus, if a company is paying a 5 percent dividend yield and has a buyback yield of 10 percent, its shareholder yield would be 15 percent.”
“A stock’s buyback yield is determined by contrasting shares outstanding today with those outstanding one year earlier”
My formula is
(DivPaid(0,ann)+( EqPurch(0,ann)-EqIssued(0,ann)))/mktcap
the O’Shaughnessy formula should have been:
Yield+(sharesoutstandingQ+sharesoutstandingPYQ)/mktcap
but I could not find sharesoutstanding on P123, I could only find float and that did not have Q or PYQ etc.
But my formula is kind of close.
Hi Denny, I shared the missing formulas, thanks for telling me
Thanks Tobias,
I copied the custom formula and re-ran all the Sims and they all ran fine. Now all I have to do is figure out how to adjust the rules so that there is some more alpha! (without data mining) ![]() I’ll post any improvements.
I’ll post any improvements.
Getting more alpha in the backtest is no problem, but out of sample is the trick ![]()
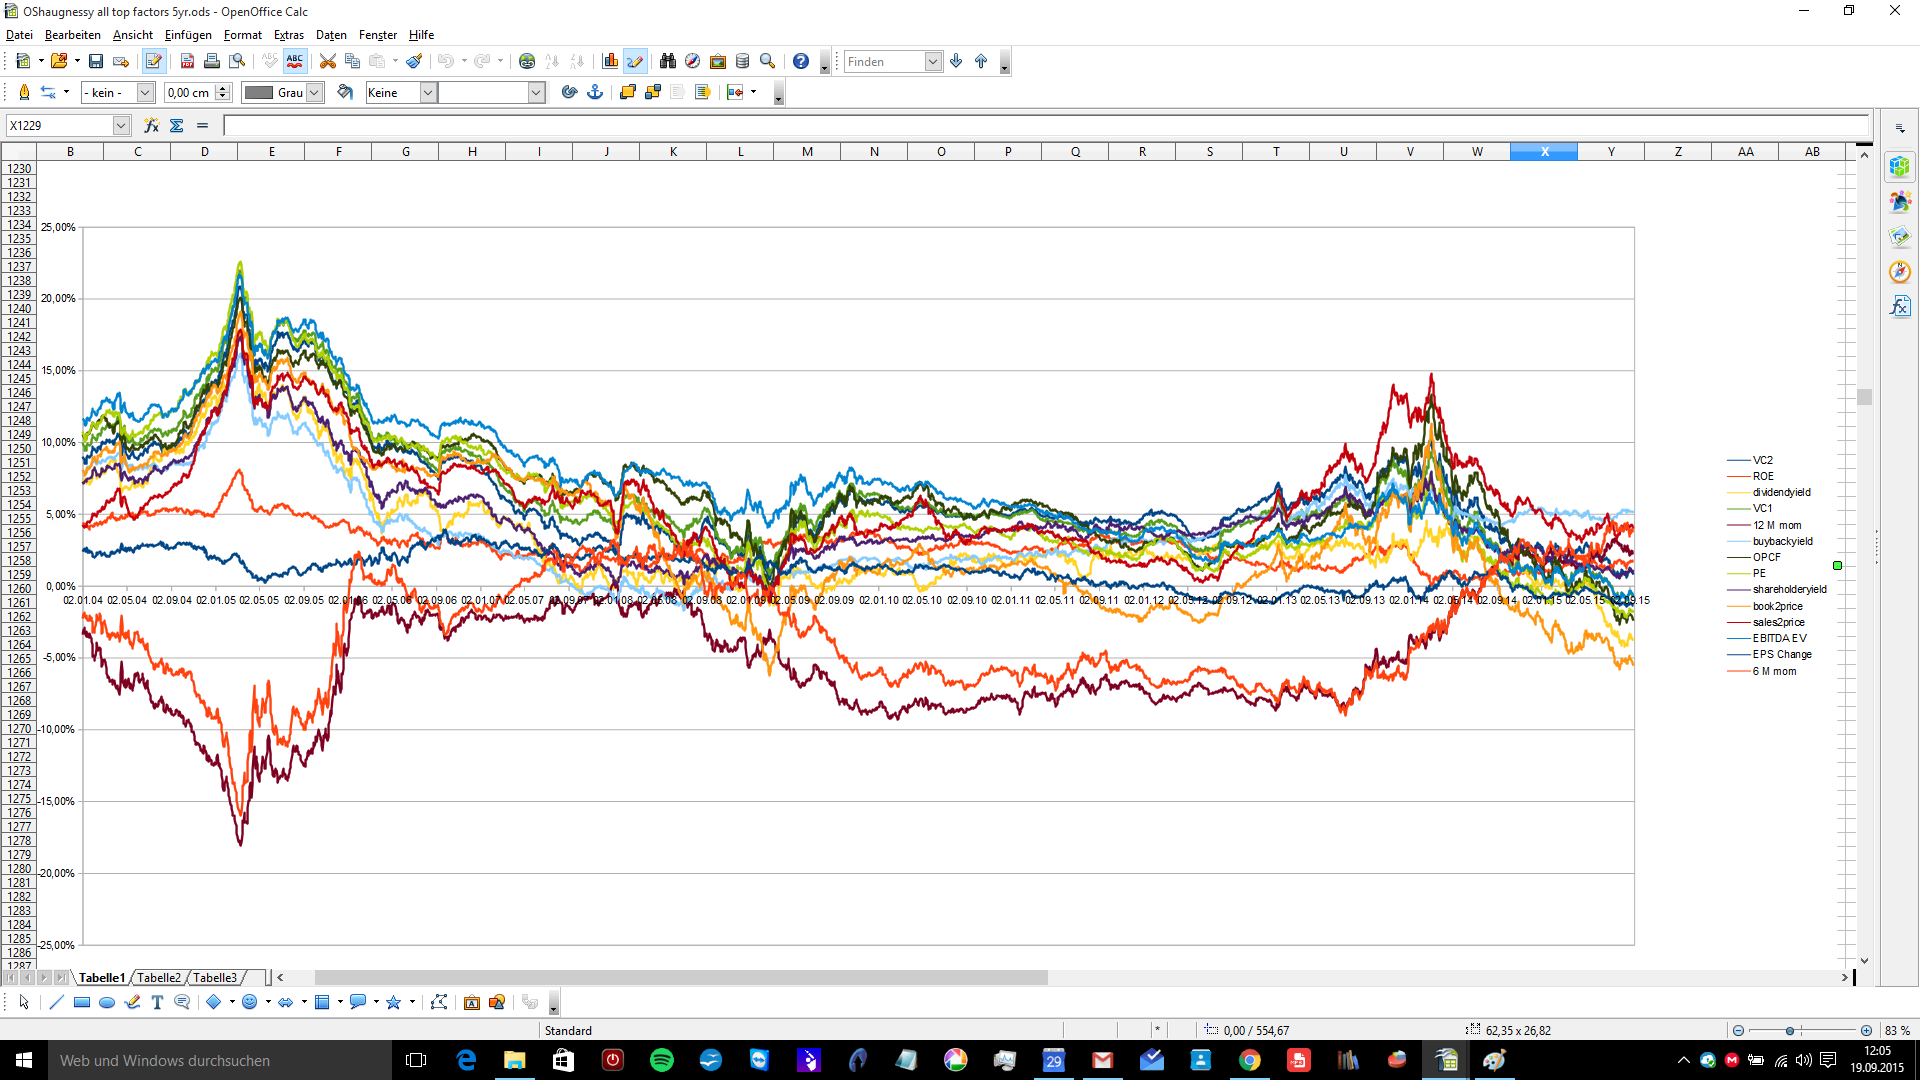
After doing all those replications, I found out, that momentum and value had a hard time in the last 5 years.
Especially the the “Five-year average annual compound excess (deficient) return” charts I posted, should demonstrate, that all sort of value and momentum metrics were struggling in the last 5 years compared to their long term average.
All of the charts can be downloaded here.
PE,
Operating Cash Flow to price,
dividendyield
buybackyield
shareholderyield
book to price
EBITDA EV
6 month momentum and 12 month momentum were especially bad
Also is trending value portfolio with 25 or 50 stocks
If anyone is interested, here are all the charts.
https://drive.google.com/open?id=0ByVZr84-T8N4M055aHpwT1QyX1k
Tobias,
the second blue picture does not look to me as if Price Sales is not working anymore, looks fine to me.
Also, I think that Value, Momentum and Size (Small Caps outperforming big caps) are stable, but all of them will
have times when they do not work.
Nothing works for example on the long side, when market conditions are bad.
Further more from what I have read, combining value, momentum and size is a good idea, since
the phases when none of those three factors work are less then one factor alone.
And I do not believe that QE and low interest rates do not count for the fact that things do not work right now.
I remember myself, that P123 is (if you use the ranking)
a “relative performance squese out mashine”, since it picks the relative momentum, the relative
value at a given time. This is always a good idea, money flows in the best relative idea at a given time, but - as I said - besides the market downturns. To time them, the overall estimates of the sp500 is a good instrument (by the way
recent estimates: -4,8% for the next quater!!!)
Due to the recent market conditions I found a new way of “total return” stuff, e.g. shorting the spy
and beeing long my 5 stocks systems. I use margin for this, e.g. on a 315k portfolio I am long
stocks 280k and short the spy 250k. In backtests this works well much better with TLT, but
I am not sure about the fed and the market conditions, so I short the spy.
If you leverage, you can take the backtests times 2, so an annual return of 30% gets
to 60%.
Just my 2 Cent Tobias, I will stay a learner, so do not listen to me ![]()
Regards
Andreas
Hallo Andreas,
genau richtig.
Yes, Sales to Price was good the last 5 years. It was crushed during the financial crisis and had a great bounce back.
I also hope that value, momentum and size still work.
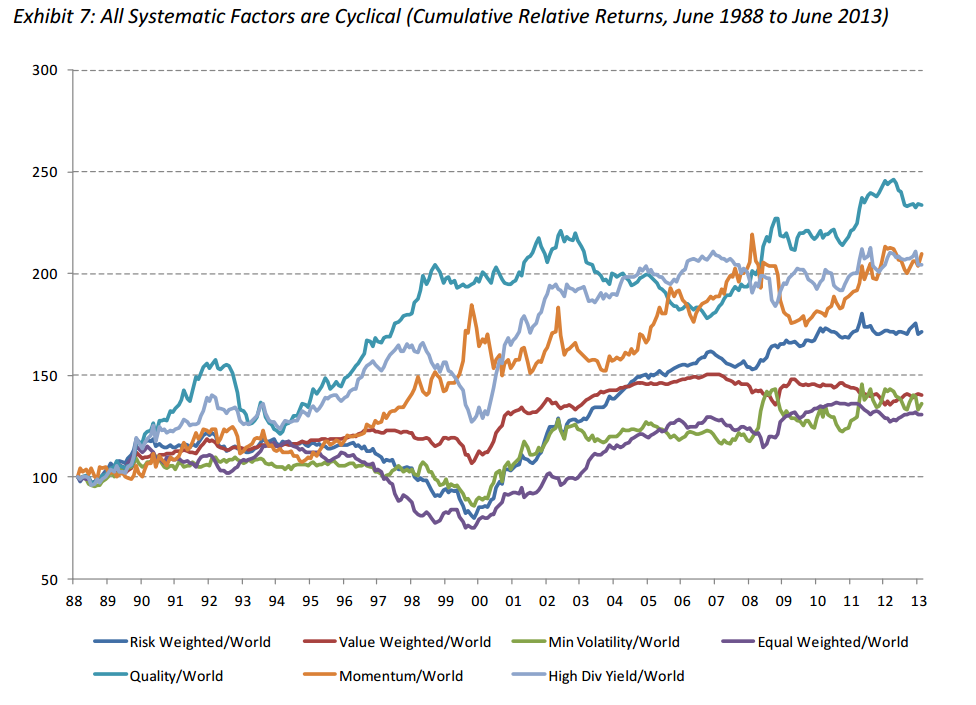
Locking at the long term charts form O’Shaughnessy, there were always periods where they underperformed for a few years, but then came back to their long term overperformance.
Some people argue, that since factor ETFs and tools and databases becoming more and more mainstream, that these market inefficiencies will or have already disappeared.
I hope and think that this is not the case. You just have to keep sticking with your system, until it comes back.
I have attached the “Five-year average annual compound excess (deficient) return” of all of the O’Shaughnessy momentum and value factors from 1999 till today Top Decile vs. his All stock universe (mktcap>200)
It is interesting to see, how the value factors run differently to the two momentum factors (6 month and 12 month price change, those are the orange and dark purple lines at the bottom)
I’m not sure what you did differently but my backtest of trending value during the same time period performed great: https://www.portfolio123.com/app/screen/summary/164761?st=0&mt=1
Yes, I have an OShaug strategy screen too that looks similar to yours. Bumpy to early 2013 then takes off.
davidbv and caley89,
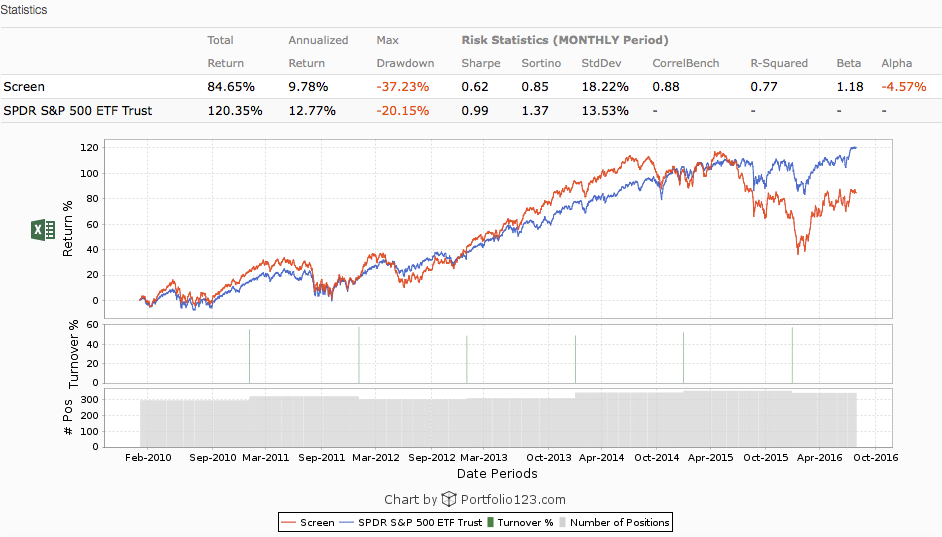
I have created a trending value screen based upon O’Shaughnessy and I don’t get a performance that takes off after 2013.
You can find the screen here: https://www.portfolio123.com/app/screen/summary/142655?st=0&mt=1
Results:
Screen SPDR500 ETF
Ann 9.78% 12.77%
MDD -37.23% -20.15%
I am curious to see why my screen is different from yours?
Hi Caley89, it looks like your model is protected - is that by design?
I could not see your ranking system or rules.
Well, it is funny you asked. I have since moved away from it. I moved the money in that model to another I developed which I feel more comfortable with.
The image below is a top level view of my OShaug ranking system. It has some buy rules and sell rules to control for a minimum level of liquidity.
I did a lot of analysis on this model and decided that it revolved around some idiosyncratic interactions between volume, price momentum and valuation. It does best with a Russell 2000 like universe. Even though I have some fundamentals based factors (like Q-Q improving Gross Profit, OpInc, FCF and shareholder Equity), it still seemed to be very dependent on finding low volume (but not necessarily small cap) stocks that were advancing in price. I decided that low volume stocks are not for me. Too unpredictable to buy/sell to the AvgDailyVol that I want.
And yes, my custom P/E is odd as is the comparison to industry earnings growth. I kind of was able to rationalize both, after much cross sectional work, but ultimately thought I was just data mining/curve fitting. IMHO, this model is not robust for me and not really investable. (Irrespective of OShaug’s work.) We all have our comfort zone.
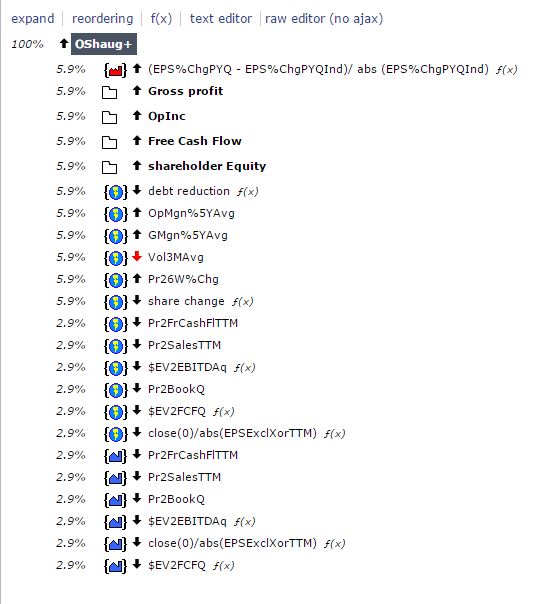
David, I have now made my ranking system public so you should be able to see it. The screen shot of your ranking system seems to have many more factors than the six mentioned in Ch. 15 of WWOW 4th edition which are:
- Price-to-book 2. Price-to-earnings 3. Price-to-sales 4. EBITDA/EV 5. Price-to-cash flow 6. Buyback yield
yes, I had expanded mine some from his original work and that is why our results are probably quite different.
He talked about combining price momentum with low trading volume. His comment is after Table 20.44 (in “Additional Metrics to Consider with Price Momentum”). I have the eBook so don’t know the actual print book page number.
I had a formula for buyback yield. I decided not to use it because depending on stock repurchases as interest rates go up (a lot of the purchases since 2009 are through debt) seems to be a dicey proposition now. I read a Bloomberg (?) article yesterday that said it was already happening.
Anyway, my 2 cents. Good luck with it.
I’m showing a 13.8% CAGR for my Trending Value Screen during the time period of the OP. (Jan 1 2010 - Sept 15 2015). It’s all stock from the book except I’m ranking by the average of 3, 6, and 12 month return instead of just 6 month return.
I noticed OP didn’t include Consumer Staples strategy from WWoWS in his original spreadsheet. That one has performed very well out of sample. (20.75% CAGR or 23.59% CAGR w/ 6 week rebalancing instead of annually. both have lower max drawdowns too)
caley89, I have changed my screen and with the following criteria I get a CAGR of 17.04% vs 12.49 for SPDR ETF:
Universe = US Fund (Mkt Cap >$200m inf adjusted)
Ranking System = 6mth price appreciation
Rules = Rating(“Value comp”)>90 where Value comp is the 6 factors from Ch 27
Rebalance = yearly
Screen = https://www.portfolio123.com/app/screen/summary/167995?st=0&mt=1
If you can share your screen, I can see if why we differ other than the 3,6 12mth ranking.
I don’t see any difference. The difference must be in the value comp ranking system. Will you post a link to that?