O'Shaughnessy sucked since 2010, "What works on Wallstreet" Bestseller

Hi,

first of all, I love O’Shaughnessy “What works on Wallstreet”. For me it was the best book about stock selection. He has billions under management, I have far less.

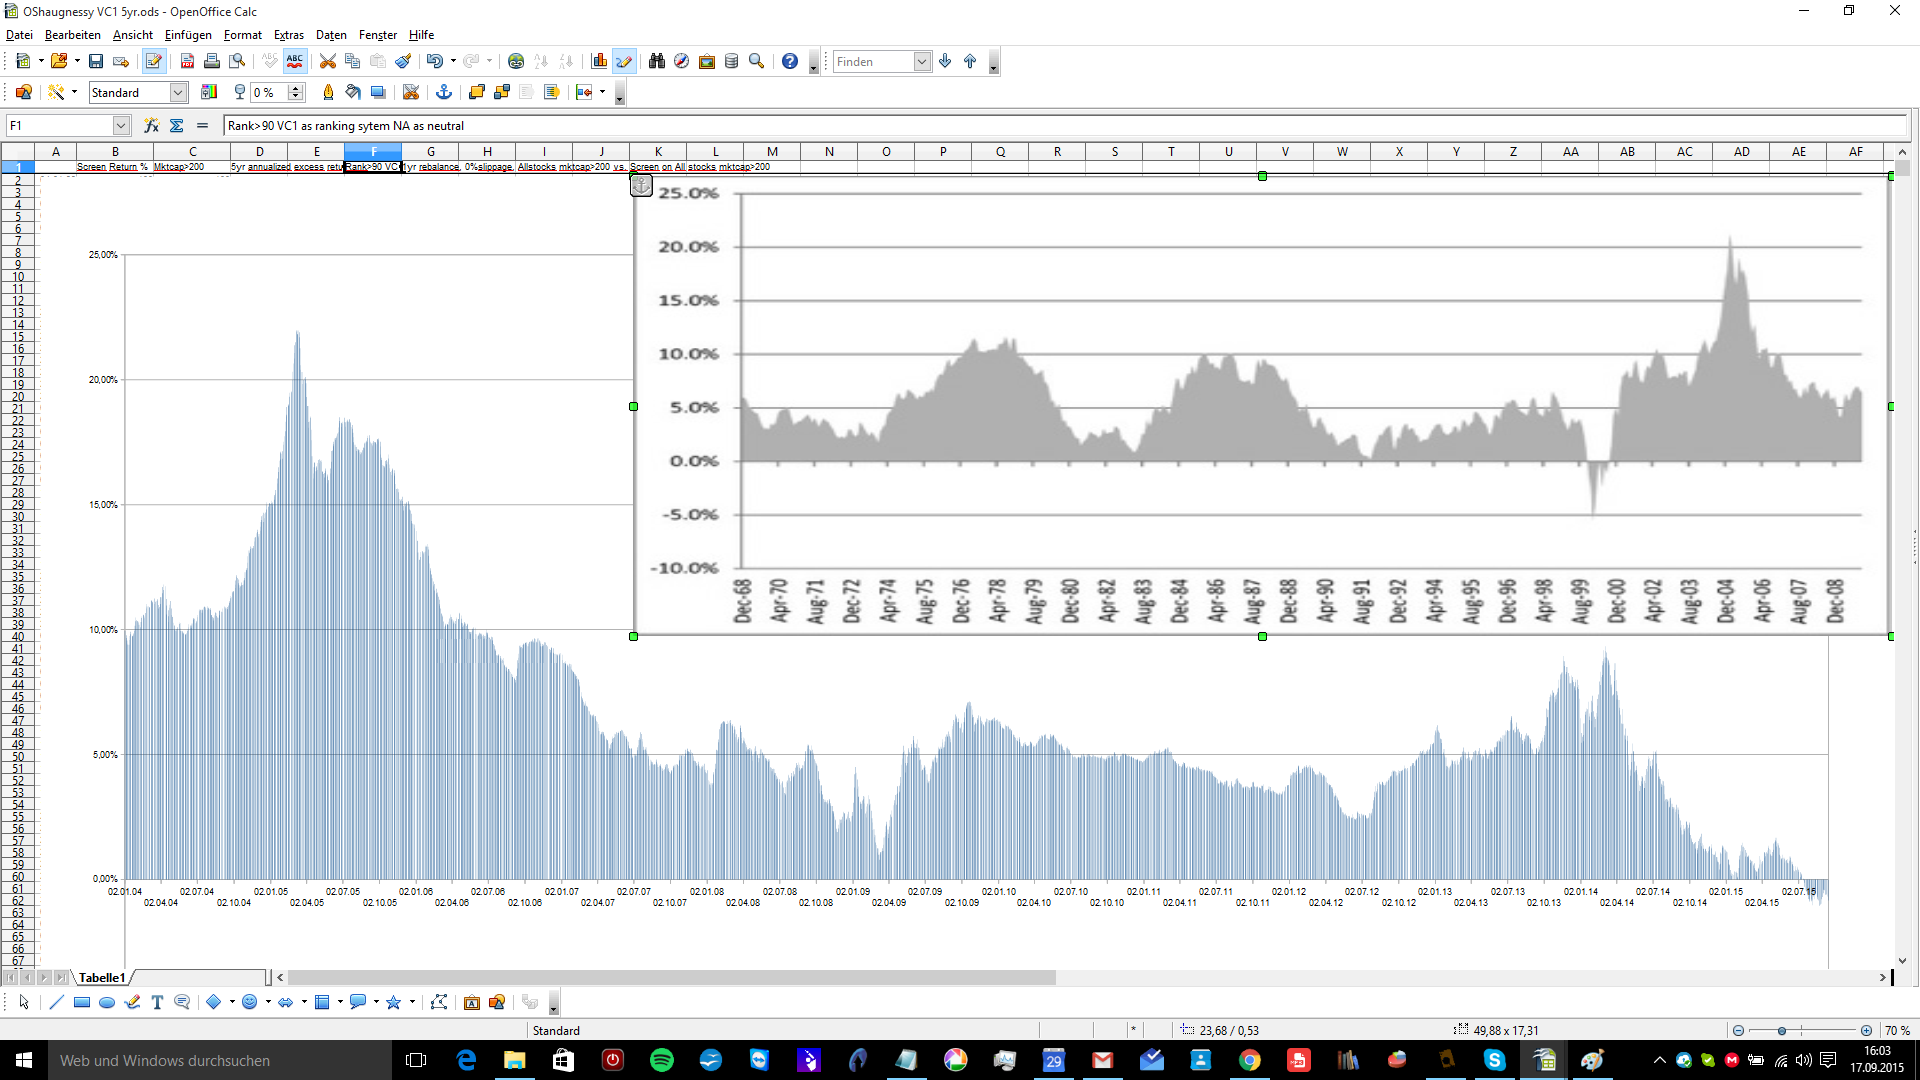
In his fourth edition Chapter 28 Ranking Strategies on page 597 he lists all of his best performing strategies with performance data from 31.Aug.1965 to 31.Dec.2009

So what I did:
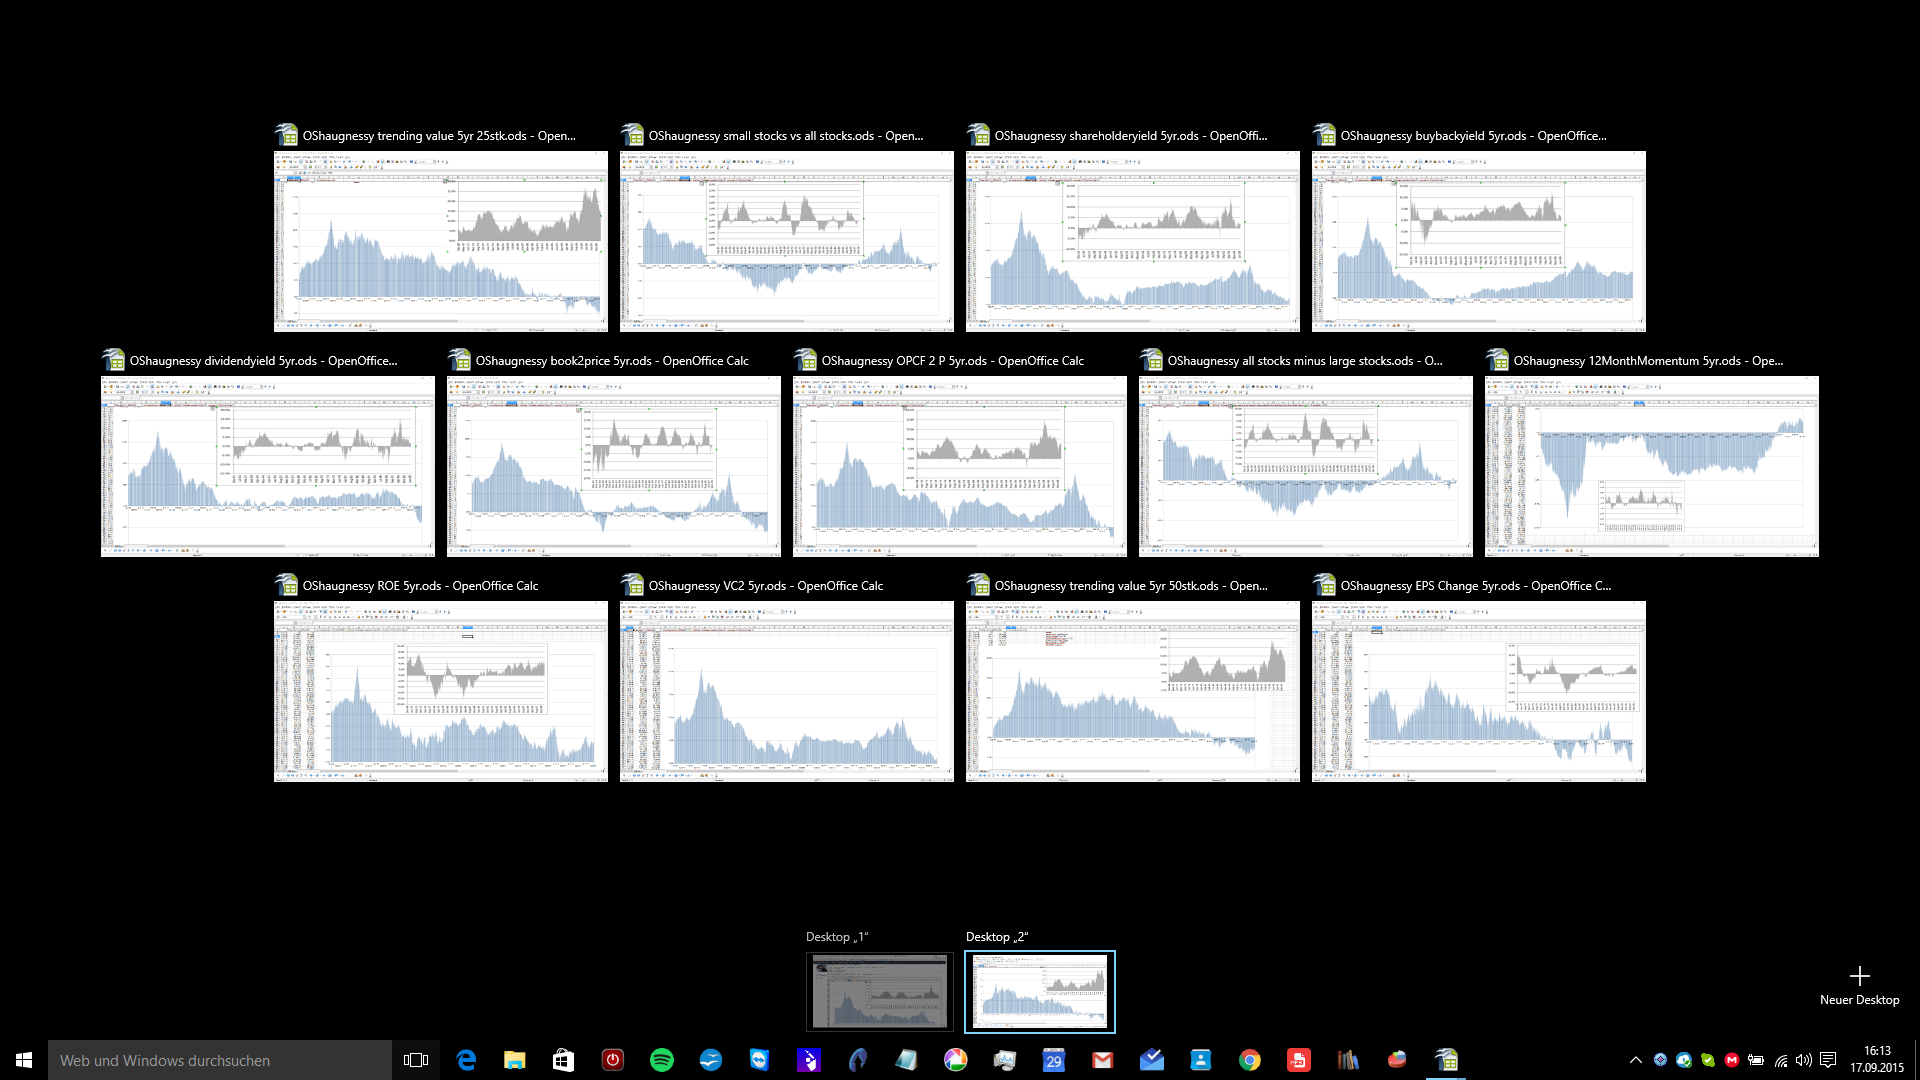
I backtested his top 19 Strategies out of sample from 1.Jan.2010 until today. At least as close as possible. His strategies might have slightly different calculation order and slightly different formulas and different Compustat data, etc… But I am very close, as you can check for yourself. I have made everything public.

The result is shocking. It would have been better to buy and hold Russell 1000, Russell 2000 or Russell 3000 ETFs instead, especially after taxes.

Name and Alpha vs. Benchmark (Russell 2000 w/Div for Small Stock and microcap universe and Russel 3000 w/Div for All Stocks universe)
Small Stocks, PSR<1, 3mom and 6 mom>0, Top50 by 12 mom -0.2%
Trending Value 50stocks -4.5%
Trending Value 25stocks -4.6%
Small Stocks, Value Composite2 (VC2), Decile 1 -0.0%
Small Stocks, Value Composite (VC3), Decile 1 -4.0%
All Stocks, VC2 Top 3 Deciles, 3mom and 6 mom >Median, Top 25 by 6mom -7.6%
All Stocks, VC2 Top Decile, Top 50 by 6mom -4.6%
All Stocks, 3mom and 6mom >Median, Top 25 by SY 0.5%
All Stocks, BP and 6mom >Median, Top 25 by SY -0.2%
Small Stocks, PB Top 3 Deciles, 3mom and 6mom >Median, Top 25 by SY -2.4%
All Stocks, VC2 Top 3 Deciles, 3mom and 6 mom >Median, Top 50 by 6mom -6.7%
Small Stocks, VC2 Top 3 Deciles, 3mom and 6mom >Median, Top 50 by 6mom -2.9%
Small Stocks, VC2 Top 3 Deciles, 3mom and 6mom >Median, Top 25 by 6mom -4.6%
All Stocks Growth -8.0%
Microcap, PSR>1, Top25 by 12 mom -6.4%
microcap, BP Top 3 deciles, 3 mom and 6 mom >0, Top 25 by 12 mom 4.2%
Microcap, BP Top 3 deciles, 3 mom and 6 mom >0, Top 50 by 12 mom 4.6%
Microcap, PSR<1, 3mom and 6 mom>0, Top10 by 12 mom -12.1%
microcap, BP Top 3 deciles, 3 mom and 6 mom > Median, Top 25 by 12 mom 6.8%

I have attached an excel spread sheet with links to each of the sims above and to a few screens with similar bad results.
If you do not want to download the spread sheet, then just search for my public sims username tobiasberr
https://www.portfolio123.com/app/opener/SIM/search

I still want to believe in value and momentum factors. But they did not have a too good run in the last 5 years.

Do you think they will have a come back, a great reversion to mean? Like O’Shaughnessy keeps claiming. You have to stick with your system for 15 years…
Or have his strategies become crowded since he published his bestseller.

Any ideas, opinions or critique are welcome!!!


WWOW sucked.xls (25.5 KB)

?

Take a look on MSCI Barra Factor Investing Books (3 of them available for public).
They provide 6 separate strategies-anomalies based on differen factors: valuation, momentum, quality, size, dividend yield, volatility.
Each factor works peridoically but it has low correation to each other, if you combine it you ll get smoother results.

No one single strategy works forever. You can’t earn a lot of money based on P123 models (if you are not a lucky man) with relevant risk level.
Most models consists only 5-10 stocks, simulated performance is optimized picture, out-of sample performance is one realization of stochastic process (good out-of sample is a lucky realized process).

Guru books or stock advisors dont’t help as well. They publish theoretical papers that can’t be replicated in real trading with the same or at least similar results. For example there is Zacks Rank service. They declare 24% ann return for Rank1 during two decades, but if you go futher you ll see that it doesn’t include transaction costs. It reduces performance at least by 10% because of high turnover of sentiment revisions strategy.

So I think really achievable return with small money at current moment is about 15% ann, with 10-15% st dev, assuming proper diversification (at least 50 holdings in overall book). The bigger capital means less performance.

Hi Tobias,

I read a lot of books including the above, and after testing their ideas on p123 most strategies performed poorly.

Then I went skiing in the Alps, had a few good ideas and implemented those into my R2Gs. Since you are a skier as well, perhaps you can equally benefit by venturing out into snow and fresh air for a couple of days…

:slight_smile:

Hi Tobias,

Great work, fascinating indeed.
For me the most important thing is to choose a proven strategy over time and BELIEVE in it.
Behavioral finance tell us that we are kind of idiots managing our own money so the good news is that we can retire earlier, probably beating the market IF we stick with a proven strategy over time.
Easy? No… but with the time frame provided by Portfolio123 (15 plus years) is possible to test our strategy and trying to beat our worst enemy: ourselves.

Best regards,
Miguel Barbosa

Hi Miguel,
thanks. Yes you are right we are our greatest enemy.

So if we believe, that Value and Momentum (and therefore also O’Shaughnessy’s strategies) still work, then we should get a great overperformance soon with in the next few years, after this bad period from 2010 to 2015.

Regards,

Toby

WWOWS in an intriguing book, despite it’s having what may be the single-worst title in the history of financial publishing (substantively speaking; from a marketing POV, it was brilliant).

The title leads one to expect to receive specific formulas for winning in the market, and makes it seem data mining is the way to go.

In fact, O’Shaughnessy is anti-data-mining and says so in the book. And the book’s strength is not necessarily his conclusions but the idea, pioneering when he wrote the first addition, of translating well-known stock market theory into language that can be understood and processed by computers. So in a sense, he’s a spiritual father of all we do here.

Perhaps the one thing I really disagree with in his books is his quest for robustness in the context of the largest possible historic sample. That’s great for discovering big-picture academic truths. But it;s not for us. The market ebbs and flows. Gotta keep this short (recovering from carpal tunnel surgery), but if you Google “Sampling Methods” or “Stratified Sampling,” you’ll get a better sense of the approaches I think are more relevant to non-acadmicians who can afford to bypass universal truths and just want to make a buck in the market.

Toby, Thank you for giving this to the community. It is great work that shows a rare diligence. WWOW was one of the books that led me to P123. Transaction costs and taxes make such a difference to real world results, as does the market impact of trading illiquid stocks.

P123 is a great tool for exploring factor strategies. By combining strategies into Books and applying some form of timing, I believe that individuals can outperform indices, (though I am struggling to prove it at the moment).

Hi Shaun,

in my ports I used variable slippage and 0,5 cents per share commission. In the screens I have used 0% slippage just for better comparison with O’shaughnessy.

I think quite a few people are “struggling to prove it at the moment” since all sort of value and momentum strategies got hit hard in the last few months.

That is why the long term perspective (5 to 10 year rolling averages) are so important.

O’Shaughnessy has got his “Five-year average annual compound excess (deficient) return” charts to prove that.
Those are the charts that I love most in his book. They show that any factor has its ups and downs and can underperform for a number of years, but if you keep sticking with it, it will revert to its longterm mean.

overvalued stocks sometimes have a few years in a bubble where they outperform undervalued stocks, but eventually they burn and value thrives :slight_smile:

I have also run quite a few of O’Shaughnessy “Five-year average annual compound excess (deficient) return” charts. His run all the way up to 31.Dec.2009. (shown in gray)
My charts in blue run from 1999 until today. The overlap from 1999 to 2009 is to check that O’Shaughnessy and I respectively P123 use the similar Data and formulas, processing orders, etc…


taking screenshots and uploading them is incredibly time consuming


six month momentum had a very hard time :slight_smile:


EBITDA TO EV was better


O’Shaughnessy’s Value Composite VC1 also did not go well in the last 5 years.

Remember, if the blue chart is negative at the end (Sept. 2015), then that means, that the strategy has underperformed the last 5 years.


I like the rolling charts but by seeing the whole time series the brain jumps to an holistic conclusion and does not suffer the emotional roller coaster of what the moves from a peak to through entail, which is a pretty large drawdown. I built some animations of equity curves through time and it gives a real different feeling than seeing the whole curve at once. When a system under performs a benchmark or negatively, it causes ‘regret’, which cumulates over time as ‘doubt’.

Remember through most of the WWOW period, the discount rate has been falling so the present value of all cash flows has risen. That is THE big macro trend, and the short-term credit cycles have interacted with Fed policy and risk sentiment to create asset valuation fluctuations. I’m working on “What Works When” by creating indicators and models to time weights to strategies.

Taking each screenshot one by one is taking too long.

So here are all on one desktop.
As you might see almost all factors had a hard time the last 5 years.


Tobias,
Great work! Thanks!! An awful lot to think about! Enough that I have few or no answers.

One thing I believe is that these authors publish stuff that has worked but they do not plan to use in the future: they already have moved on or plan to move on. I can’t prove that this is always the case but there are some anecdotal stories that support my believe–a little. If I am correct about this, it is an argument for developing your own systems at P123.

@Marc. I don’t disagree but I wonder what it is that makes O’Shaughnessy’s work not data mining. I would say that maybe there is not a lot of data mining in his work because he does not use a lot of factors, his factors make financial sense and because he uses what we at P123 call rank performance for determining whether a factor has significance. Of those, I think using rank performance may be the most important. A rank performance is a type of linear regression and a tight linear regression for every stock in the universe over many years is very convincing.

BTW, Marc: I hope for a quick recovery and even more typing in the future.

Regards,

Jim

If anyone is interested in the original open office spreadsheet files of all the data and charts of the
O’Shaughnessy’s
Five-year average annual compound excess (deficient) return charts from 1999 until today.

You can download them here. https://drive.google.com/open?id=0ByVZr84-T8N4M055aHpwT1QyX1k

Some of O’Shaughnessy’s portfolios might be overfit,

but his single factors (Taking the top decile of sales2price or the top decile of EBITDA2EV) is definitely not overfitting. It just demonstrates that the concept of value works. Or the concept of size or momentum.
Those are the only three factors that O’Shaughnessy uses. Maybe a little bit of quality (financial strength etc…)

But the shocking thing shown in the 5 year rolling excess return charts is, that the all had a hard time the last 5 years.

Does that mean that the market is getting to efficient, with meanstream use of online screener and sites like P123, stockopedia, etc…
and with factor ETFs and all professional mutual funds doing computerized screening for the main factors (value, momentum, size)

or is it just one of those periods where the factor unterperforms for a few years, to then have a great come back to revert to its overperforming longterm mean?

We shall see.

Try running these on just the russell 3K as the universe.

I have used the Russel 2000 for all of O’Shaughnessy’s small stock and microcap portfolios
and the Russel 1000 for all of his Large stock portfolios
and the Russel 3000 for all of his All Stock portfolios.