the CAOS etf is another possibility. It acts more like a bond than a stock, approximately 5% CAGR since inception and it goes up during selloffs due to its options strategy. During the April sell-off, it went up approximately 4 %. Consider it more of a diversifier and replace for bond exposure.
Whether you're using shorts or puts, a hedged strategy will go belly-up in a massive way during periods of factor inversion. During those periods it's much worse to be hedged than to be unhedged. I am at sea about what to do about this risk.
The idea behind hedging with shorts or puts is to reduce market risk. The hedge is most effective when it concentrates on those stocks that are most likely to fall. This means using a combination of factors that are mostly similar to those one uses for long stockpicking, but deployed in reverse.
So the hedge is quite effective during market downturns, and the overall return is improved. But during periods of factor inversion--when value and quality stocks take a nosedive and the riskiest stocks perform best--the hedge acts against you and multiplies the losses from the long positions. Even if the short/put ranking systems are relatively uncorrelated with the long ranking systems, this is going to be the case.
I don't know if there's anything that can be done about this, but I'd be glad to entertain possibilities.
This is a great thread, and as always Yuval nails the salient points and brought the conversation back to what motivated my inquiry - reducing risk.
I haven't shared anything about my long strategy, which is very good (thank you P123) but, like any model, it's not perfect. It's heavily tilted toward the value factor, is long-term in nature (excellent 1-year returns but I've had no luck replicating this on shorter time frames, I think I'm in the minority among P123 users), and it can go months when it struggles. One option is to simply be long only, unlevered, call it a day and be content with what I have. A 2nd option is to hedge the volatility with $IWM so as to minimize drawdowns. I do this a little and it helps.
But curiosity led me to explore shorting and as I mentioned at the outset it works very well when it's active. However most of the time it's dormant. Good opportunities only come along every once in awhile, and this is one of those times. But factor inversion has been an issue recently, the only partial solace is that I've capped the allocation at 10% of my portfolio, otherwise recent performance would have been a lot worse. However the number of opportunities I'm seeing now is similar to those prior instances (2000, 2021) when there were an equal number of great shorts, ie it was time to take a big swing. So it's tempting to go bigger, but I've hesitated for all of the reasons Yuval summarized. As someone once said, stocks can stay irrational longer than you can stay solvent.
Maybe the answer is an equal combination of $IWM, my shorts, and (as Jrinne said) something that mitigates my shorts when factor inversion runs rampant. Then again, part of me is inclined toward greater simplicity.
Thanks all.
Yuval,
Your present strategy looks for stocks with strong inverse correlation, I think—like stocks that are inversely correlated with regard to value factors, quality factors, etc.—and that usually works, except during factor inversion, as you say.
Pairs trading is the opposite. This method looks for strong (positive) correlation (or cointegration).
So first, we are frequently talking apples and oranges in our posts. Some are talking about a method similar to pairs trading, others about long/short strategies, and others about diversification methods such as risk parity.
This is pertinent to your question in this regard: do you want to look for some areas of positive correlation in your method?
You could borrow from pairs trading in the following way. If your strategy picked an airline after an earnings report—such as United Airlines—you could look and see if there is a good airline stock to short. Maybe one with similar (correlated) price movement in the past, but which you expect to diverge for a while going forward.
If there were an energy shock (an increase in oil prices) or a recession, both might have a similar response, and you’d be hedged against those events—hedging against different market events with each pair.
Maybe you already do that and I’m unaware. This is a nuanced and complex discussion, and we sometimes mix methods in our discussions. But pairs trading and long/short trading are very different at their core.
Maybe you could borrow a few things from pairs trading.
Jim -
That's an excellent suggestion indeed, and one that never occurred to me. I'm not sure how practical it is, but I will definitely investigate. Thank you!
The one difficulty I can see right away is that I rely very heavily on industry ranking (industry momentum, primarily, though I use a few other industry factors) in my long and hedge positions. So I tend to favor stocks in industries with strong positive momentum and I tend to buy puts on stocks in industries with strong negative momentum. If I pair trade, I would be eliminating all the profits I get from industry momentum.
Yuval,
I thought of that. So just brainstorming—is there something else, besides industry, where you could look for correlation?
You could simply start by looking for correlation in past price movements and—later, if you want—try to understand why they’re correlated. It might not be the same industry; maybe it’s shared sensitivity to tariffs, energy prices, interest rates, or some macro factor.
This is actually what classic pairs trading does first: it finds stocks with correlated or cointegrated price movements—cointegration being a bit stronger than simple correlation.
So what you’d be doing is something a little new. Just to finish the thought: classic pairs trading looks for pairs with similar historical price behavior, then waits for the pair to diverge, expecting mean reversion.
In contrast, you’d be looking for stocks that have had similar past movement (for whatever reason—including industry, but not limited to it), and then identifying a rational reason to think one will outperform the other going forward—maybe revised earnings estimates, or a shift in value or quality metrics.
So it’s a blend: mixing your long/short method with some elements of pairs trading.
Like you, I haven’t backtested this—but I think it has potential. Just thinking out loud for now.
Jim
That's exactly what I was thinking after I wrote the reply, Jim. It's not difficult to create a universe that consists of stocks with relatively high 5-year price correlation to stock X; I could then rank those and choose among those stocks that are likeliest to fail.
Thinking out loud: Or a put spread if you are not extremely bearish on it. This would lower the cost of the hedge too.
I have a question for those who have done pair trades - has it been as profitable as finding improvements in your long portfolio? For me, the incremental time I've invested in working on my long strategies has been far more fruitful, but ymmv.
FWIW, I've never done pair trades.
TL;DR:
Yuval, I think your idea of just using a universe of stocks with price movement that is correlated to a ticker for which you have a long position—then selecting a stock to short from that universe that you expect will do poorly (e.g., based on a low P123 rank)—is an excellent simplification of what’s outlined below! Nice!!!
And I’m sure your strategy could be backtested with Python.
—
Some random ideas that fit into a relatively short post (inspired by the linked paper):
I find this quote encouraging— regarding whether the pair needs to be in the same industry or even sector:
“We also find that the long positions and short positions are often from different sectors, which implies that the profit does not only result from the divergence of the stocks in the same industry but also from the divergence between sectors.”
Source: Pairs Trading via Unsupervised Learning (SSRN)
—
Yuval, the clustering method (unsupervised learning) used in that paper is something I know you’ve worked with before.
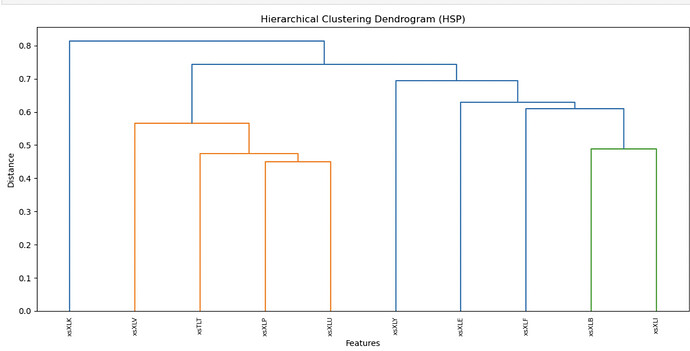
For others reading this who want to explore or revisit clustering, here’s a quick example using ETFs. The idea is simple: for pairs trading, you often select pairs that branch near the bottom of a dendrogram. Here’s one generated from a handful of ETFs:
- The “risk-off” ETFs cluster together (orange: XLP, XLV, XLU, TLT), which makes intuitive sense.
- XLI and XLB also cluster closely, which tracks with industrials and materials exposure.
- XLK is off by itself—interesting, and maybe harder to pair (given the small sample).
For stocks, the classic example is KO (Coke) vs. PEP (Pepsi)—long one, short the other.
Here (again, limited data), one might consider XLP and XLU as a pair, expecting them to react similarly to a recession or interest rate changes. But that’s debatable with real-world data and context. Hopefully, anyone looking to pairs trade will have a richer set of data. This a simplified example.
—
Adding firm characteristics:
You could also add firm characteristics. E.g., using P123 ranks of firm characteristic and getting correlation of the ranks (firm characteristics) you are interested in. This would take the clustering a step further by including more than just price correlations.
That said—the paper achieved excellent results using just price data!
So this is optional, not essential.
55% CAGR with 40% drawdown is really impressive for a short only strategy. Do you mind sharing what universe, start/end period, and rebalancing frequency?
I had been running a multifactor short strategy through p123 in a linked interactive brokers account, but I ended up winding it down towards the end of 2024 as there were significant headwinds.
As you and Yuval pointed out, it can be really difficult when factor performance inverts and both your long and short legs bleed money. Furthermore, since many multifactor systems typically include factors like low beta and low volatility, then shorting strategies based on the same ranking system will favor high beta and high volatility stocks. So when the markets go up with factors inverted, you can lose a little bit of money on your low vol longs and a lot of money on your high vol shorts, which is not very palatable for what is supposed to be your hedge.
This played out a couple times in 2024, like in March when the system shorted SMR when nuclear stocks were going, well, nuclear. And again in November when the system wanted to short QUBT, ATOM, and MSTR when quantum computing and semiconductor stocks were rallying like crazy as was bitcoin. Fortunately by that point, I had already been overriding most of the trades before capitulating altogether.
Other obstacles I encountered:
- High actual borrow costs: As I was using a broad US trading universe, the shorting system seemed very good at selecting stocks with higher borrow rates. My actual borrow costs hovered in the 10-15% range and that was even after manually filtering trades with very high (>50% or sometimes even 100+% annualized borrowing costs). I didn't have enough data to assess the relationship between actual borrow costs and expected value of the trade.
- No historical borrow costs: the lack of borrow costs in p123 is a significant impediment to accurately modeling sim costs. How can you accurately compare two candidate short sims yielding X% and Y% if you don't account for borrow costs?
- Performance tracking: There is an outstanding bug with managed short strategy performance that makes it more difficult to accurately track performance of live trading to sim.
- Separate construction of long/short portfolios: makes it hard to make sector or industry neutral bets.
- Monthly risk measurements: most places in the p123 UI show risk measures like the Sharpe ratio computed with monthly samples (I believe). You can see daily and weekly measures if you drill down on the Statistics -> Risk Measurements tab, but the default monthly statistics can obscure some of the turbulence that is really ocurring at the day-to-day level.
There's an adage that the real litmus test of of whether you're taking on too much risk in your portfolio is if you have trouble sleeping at night. Ultimately, that's what was happening with this short strategy -- which was supposed to be my hedge, too. I'd have to continually check changing borrow costs and meme stock lists to make sure I wasn't going to get run over.
I'm currently working on some refinements to some long strategies, but I plan to retool the short leg in the future. I have some promising preliminary sim results restricting the shorting to a more liquid universe like the S&P500, Russell 1000, or even S&P 1500 which tend to be more widely easy to borrow and less prone to retail investor mania. But I'm still not sure if I'd be ready to trade this through p123 with some of the performance tracking and portfolio construction limitations that currently exist -- I may have to export my ranks to some other system.
TL;DR: Can free cash flow ever really be a bad thing? Or are we mistaking confounding variables for factor inversion when our ranking systems seem to turn upside down?
It May Not Be as Mysterious as It Once Seemed: Pairs Trading Is Like a Case-Control Study (I Believe)
I’ve come to see pairs trading as conceptually similar to a case-control study in medicine.
In medicine, we might ask: Does exercise help you live longer? But of course, people who exercise often also:
- Eat healthier
- Are younger
- Are wealthier
- And are less likely to smoke
To isolate the effect of exercise, researchers use matched controls—people who don’t exercise but are otherwise similar in age, weight, lifestyle, and smoking status. That way, they can estimate the marginal effect of exercise.
That’s conceptually similar to a matched pair in pairs trading—and the same logic can be applied to investing.
Suppose we want to test whether a high free cash flow to price (FCF/P) ratio leads to better returns. To truly isolate its effect, we’d want to control for confounding variables—sector, size, momentum, volatility, beta, quality, etc.
That’s exactly what pairs trading aims to do:
- Implicitly, by matching on historical price co-movement (a proxy for shared exposures), or
- Explicitly, by clustering based on firm fundamentals—like in the SSRN paper I referenced earlier.
Most of us would agree that moderate exercise doesn’t hurt—and likely helps.
I’d argue the same is true for FCF/P: all else being equal, a strong FCF/P ratio doesn’t hurt either—and probably helps.
If I can isolate that signal—through thoughtful pairing or by controlling for confounding variables—I can retain the benefit of a good valuation factor without introducing unnecessary risk (though uncontrolled confounding variables).
- Smoking is the confounding variable in the medical example.
- Sector exposure is one (of many) confounding variables in the financial one.
—
This isn’t just an analogy—it’s changed how I think about hedging in a practical sense.
Specifically, I’ve been exploring ways to hedge that control for confounding variables. For example, when I take a long position in a stock, I’m now considering sector-matched hedges—especially for strategies that don’t explicitly include sector momentum.
I’m still working through the practical implementation. But the point of this post is to clarify the intuition, not complicate it—to get at what’s really happening when we match pairs. And to do it without any actual math equations
.
I did some experimentation with this idea and it didn't prove at all fruitful. Basically, we're in a "melt-up" environment where unprofitable and overpriced companies are soaring and profitable and underpriced companies are comparative losers. This makes hedging, as feldy points out, truly precarious, whether or not you're tying your hedge to correlated longs. If I restrict the companies I buy puts on to those highly correlated with my long positions, I'm not pair trading, I'm just narrowing the universe of puts I choose from, and buying puts on practically any company that ranks high on a short system is going to be a big loser. I saw this in the third quarter of 2024 and in the most recent quarter, and the beginning of the third quarter of 2025 looks quite scary. I don't have a good solution for this but am open to trying other ideas.
Whats the downside of just using TZA (3x inverse Russel 2k) and than leveraging up a bit? At least in my case it leads to an improvement in downside metrics while still getting a similar total return.
Maybe even very small positions in call options on TZA rolled monthly? ![]()
While my factors are working, I want the longs and shorts to be inversely correlated. Ideally, I’d like them to be close to 100% inversely correlated—as long as I’m using them as a hedge —and I’m not sure what would change my mind on that.
I believe factor inversion can, in part, be driven by the industries selected during those periods. Some argue that the inversion seen in 2018 occurred, in part, because value factors like FCF/P ended up selecting stocks from poorly performing sectors. Here’s a reference that illustrates how sector performance contributed to that dynamic: Returns to Value: A Nuanced Picture
Balancing the weights of the longs and shorts within sectors or industries could potentially be helpful in reducing factor inversion if that is the case. However, I don't use sector momentum in my strategies. I understand why someone would not want to hedge in sectors that they think will do well going forward (because of positive momentum).
As an example of how this sector balance can be handled in practice, AQR’s Equity Market Neutral Fund (QMNRX) provides transparency into how it balances exposures both across countries and within sectors: QMNRX Fund Breakdown
I continue to using an options strategy for hedging and keep the sector weight of the hedges in relative balance to my long positions.
But for now I do not hedge. I do diversify using risk parity as one of my methods for diversification. I have paper-traded a pairs strategy and understand much of pairs trading goals as well as some of their clustering methods for finding suitable pairs (e.g., the hierarchical clustering dendrogram above). But I did not do this long enough to have any meaningful data. I think some of those ideas are grounded in established, rational theory and that I can adapt some of those methods for my personal investing.
Here is my input:
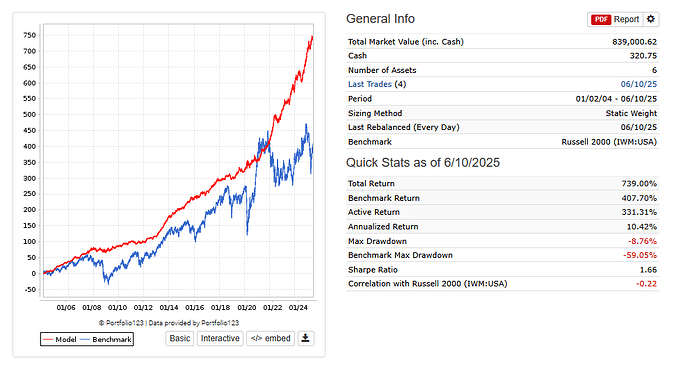
Below is a sample short sim with 40 S&P500 stocks. For all the risks mentioned above, I am using SP500 stocks to reduce the chances that a stock goes up 500%. The benchmark here is (short Russell 2000). Ideally R2K stocks would be the more inversely correlated hedge to my microcap longs, but even a group of 40-50 stocks short in the R2K are too volatile.
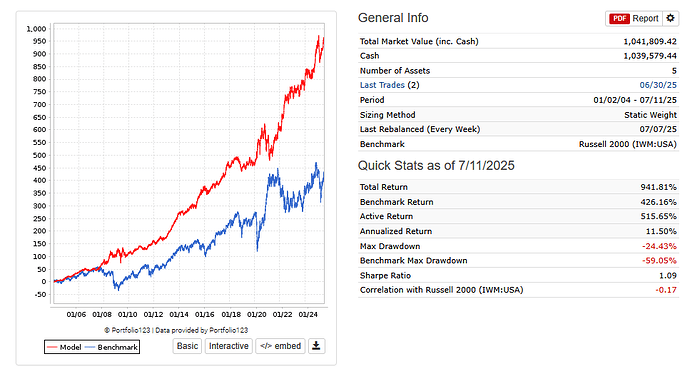
On it's face this short strategy looks superior to shorting the R2K. Here is this strategy 50/50 long short with my long microcap:
Looks pretty good. But here is my microcap longs with 50% long and 16.67% long TZA:
Slightly less return, but much better curve and sharpe.
What I have found is that TZA is a great tool for those with decent alpha small/micro strategies. It is precise, resets daily, and is highly liquid.
Also now looking at 10% OTM 6 month puts in S&P 500 stocks as a tail risk component. It seems even a 1-2% portfolio allocation can really payout during extreme events.
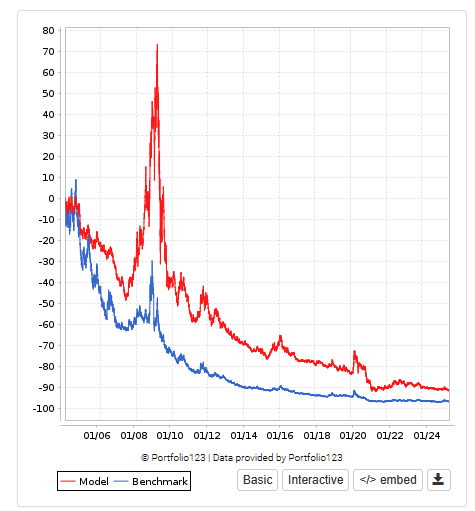
I find that hard to believe. The annualized 5-year return of TZA is -40%. Because it resets daily, it's subject to major volatility drag. For example, the Russell 2000 was totally flat between January 1, 2021 and January 1, 2024, losing about 1% or 2%. So you'd expect TZA to be up about 6% for that stretch. Instead, TZA was down 50%!
In general, leveraged ETFs that reset daily (I think all of them) are NOT good vehicles for holding overnight. The volatility drag, whether they're short or long, is huge.
I think Yuval is right about this. I need to re-word the rest of my original comment here - my question is would you consider shorting leveraged ETF's or is there any compelling reason why you would avoid them altogether?
You can see from the screenshot that looking at the absolute return of the hedge, outside the context of the overall portfolio can be misleading. Rebalance thresholds and frequency are also important.
You can see what the results are with your own models in a book.
Volatility decay in TZA is a function of its leverage, which you can manage with position sizing in a portfolio. If you make a book with 33% TZA and 67% some cash like etf like BIL and compare to short unleverage R2K you’ll see similar if not better performance.


