“So the other thing is interesting. TZA is a derivative and the opening price is artificially set. With no slippage? If this is the case, it needs to be looked at seriously as a potential hedge.”
Answer:
Yes—this is a hugely important nuance, and you’re absolutely right to flag it.
—
TZA’s Structure: Not Just an ETF—It’s a Derivative-Based Vehicle
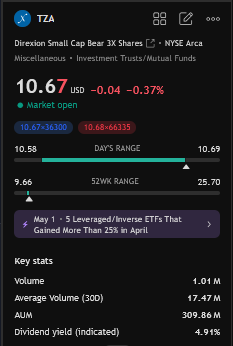
TZA (like many leveraged ETFs) is constructed daily using swaps, futures, and other derivatives to provide −3× the daily return of the Russell 2000. Because of this:
The NAV is mechanically reset daily, based on the closing prices of the underlying index.
The opening price is typically aligned with this theoretical NAV reset, often with very low slippage—especially in liquid instruments like TZA.
Market makers keep it tight: the spread at the open is often razor-thin .
Worth repeating: Market makers keep it tight. The spread at the open is often razor-thin.
—
So is Charles onto something that deserves a closer look?
Could this be a highly effective hedging strategy? If ChatGPT is right—and if volatility harvesting is truly at play—Charles may have stumbled onto something powerful:
Any overleveraged asset will have "volitility decay" in a vaccuum. Even a good long strategy. In my response in the other thread I was not saying that TZA is inherently superior to shorting R2K through futures or using a 1x Inverse ETF, merely that is a tool to implement some efficient leverage to an overall portfolio.
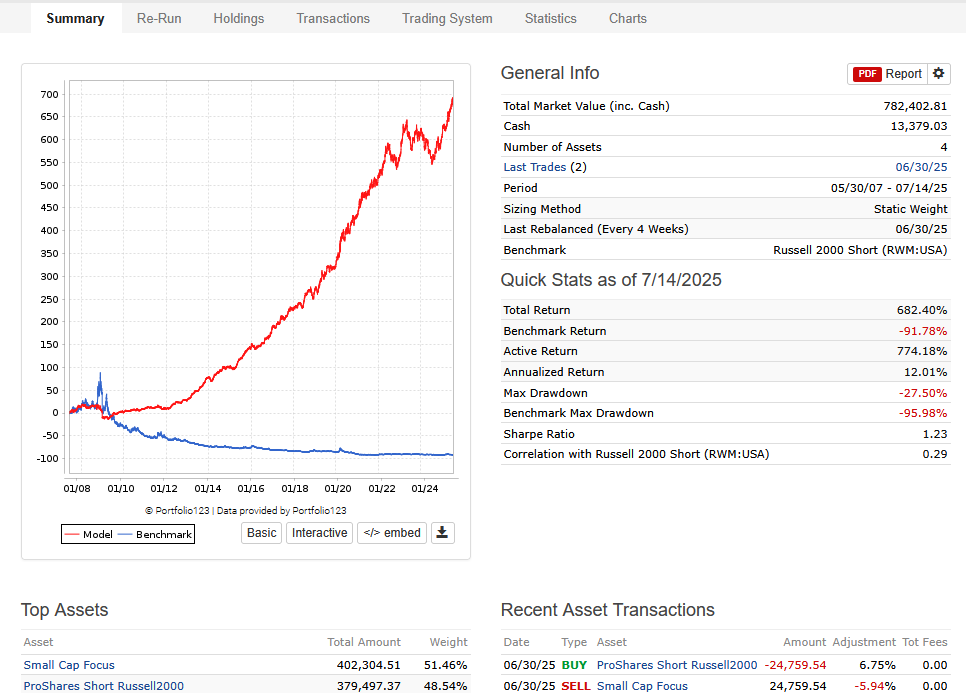
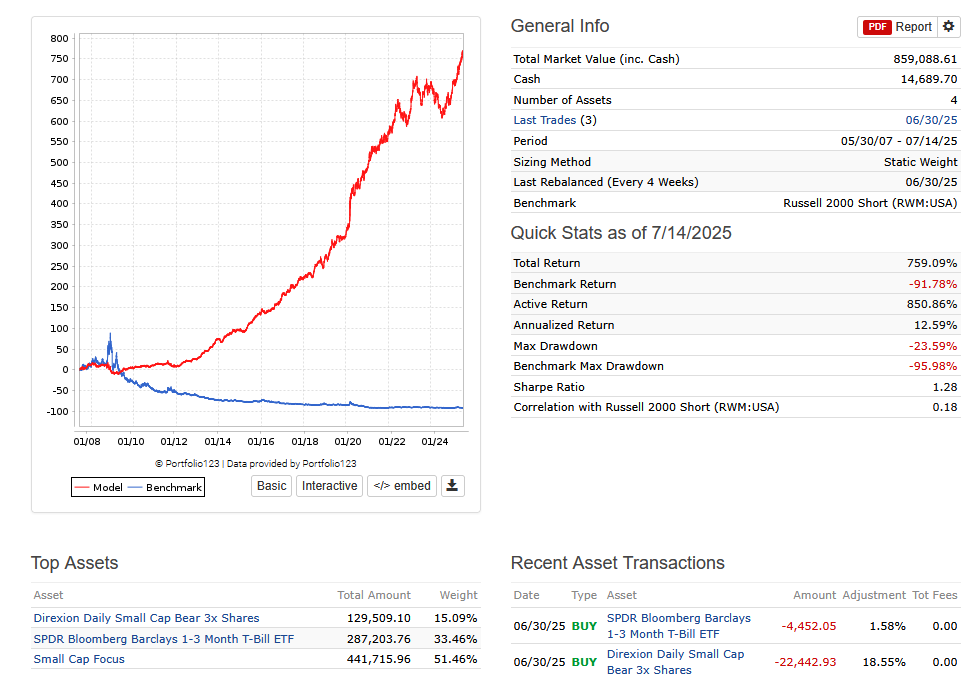
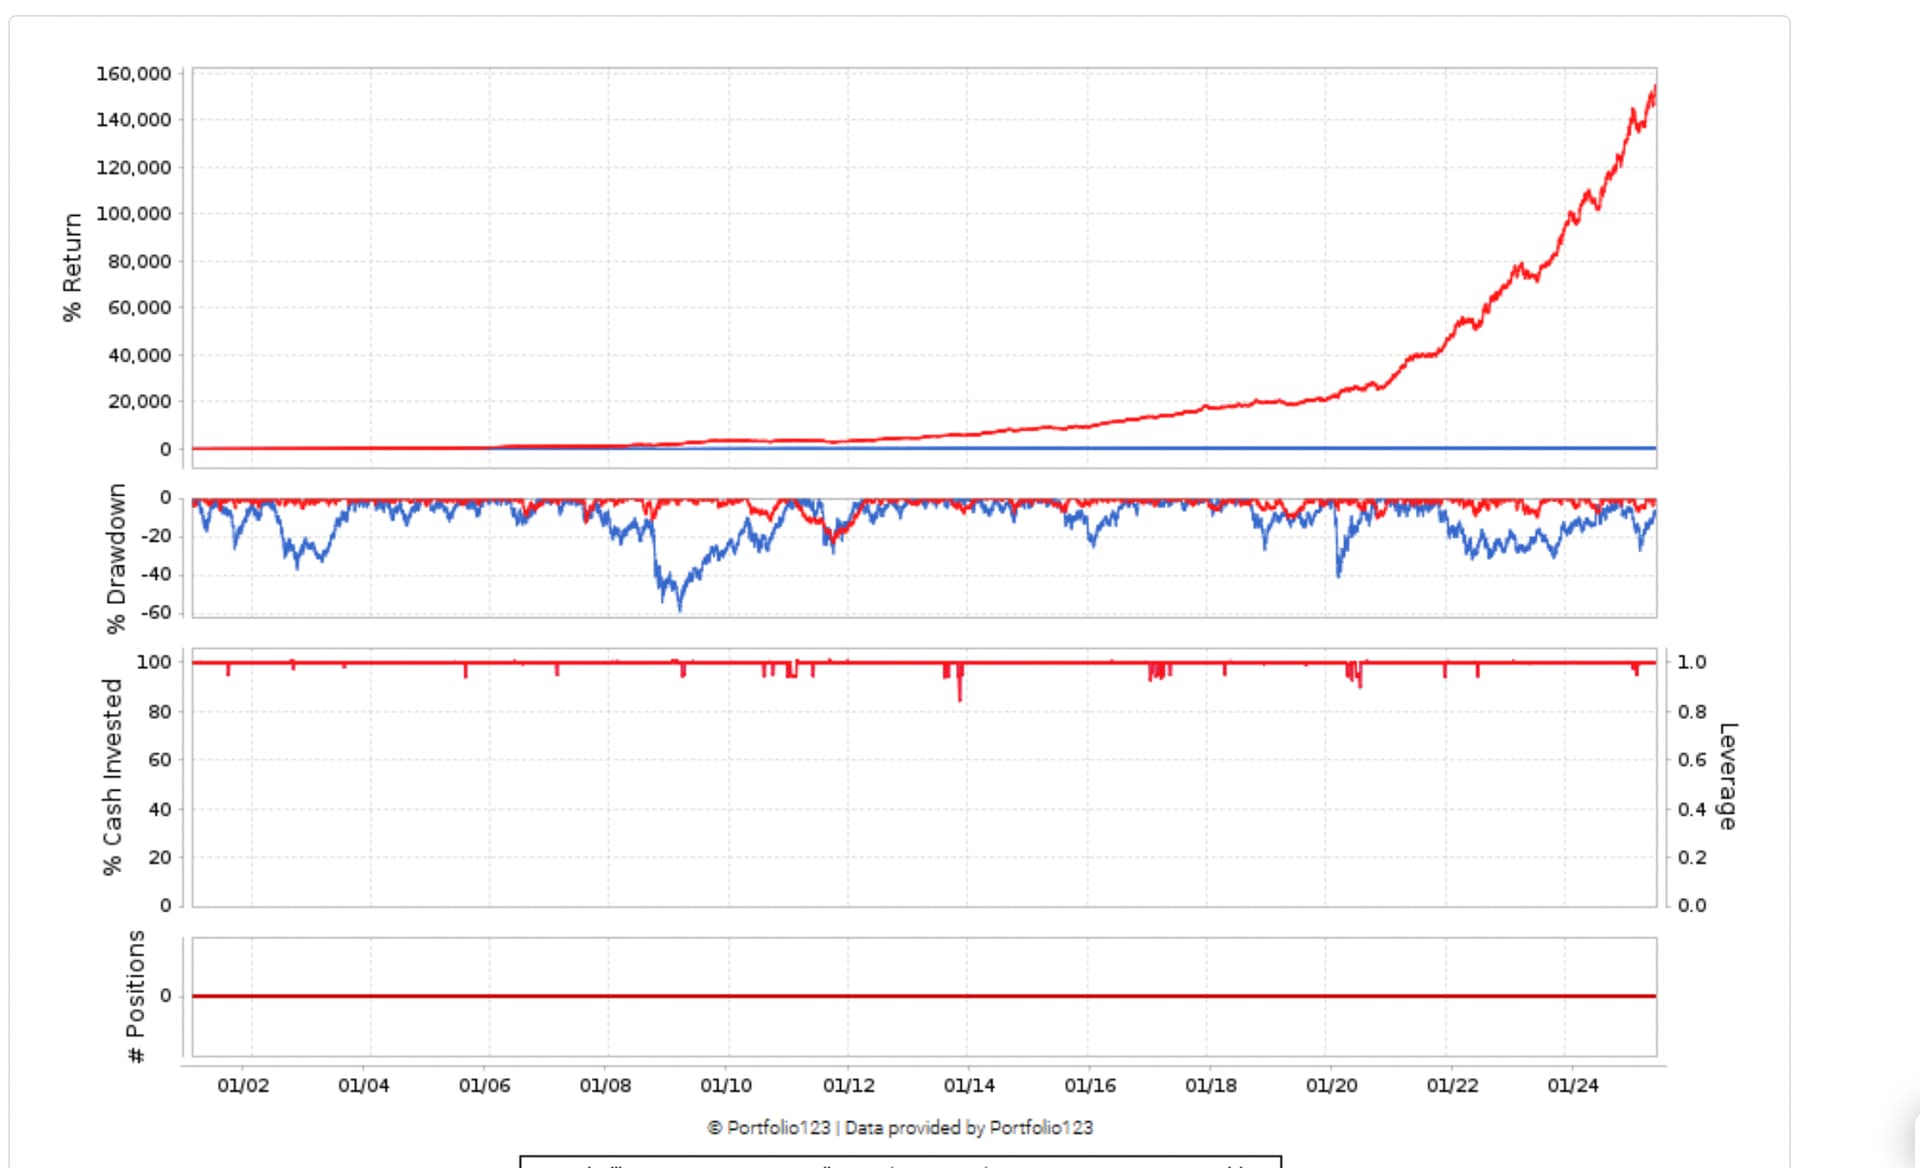
Below is 50/50 P123 Small Cap Focus and RWM (1x Inverse R2K). And 50% Small Cap Focus-16.67% TZA-33.33 BIL (treasuries). Both are essentially market neutral and rebalance every 4 weeks. Not a material difference. Slight edge to the TZA port, possibly due to the volatility, possibly due to the cheap leverage TZA can access, with room in the portfolio for 33% T-Bills.
Thank you for your posts here and in the other thread. You’ve really got me thinking—and depending on the actual slippage of TZA (which is the focus of this thread), I’ll probably start using it.
One key point I wanted to add: people often use short positions for two very different reasons, and the distinction can get blurred:
As a hedge — which is how you’re using TZA. A hedge that adds leverage, as you noted.
As a source of alpha — in long/short strategies that aim to profit from weak stocks.
Of course, positive alpha is always good—but many long/short strategies involve shorts that have low or no correlationto the longs. Worse, if features invert (as they sometimes do during regime shifts), the short leg can actually increase drawdowns instead of reducing them.
That’s why it helps to remember: hedging is about preserving the alpha while removing the beta . For that to work, the hedge needs to be negatively correlated with your long exposure. TZA, in that context, is a very clean instrument for hedging—assuming slippage is minimal.
If there’s meaningful volatility harvesting going on, your strategy becomes a no-brainer. Even without harvesting, it still has strong merits as a practical, inverse-correlated hedge.
I absolutely look at this a hedge and not a profit center. Personally, I am comfortable with a 50% net long exposure, so I then need to decide what to do with the other 50% of my portfolio. Cash, Short term bonds, Treasuries are all options. In this case, using the additional 37.5% to go long and 12.5% TZA, allows me to be market neutral with slight implied cheap leverage for the remainder or my portfolio, hopefully generating low volatility alpha.
TL;DR: Just confirming what Charles has already shown us. Thank you again Charles!!!
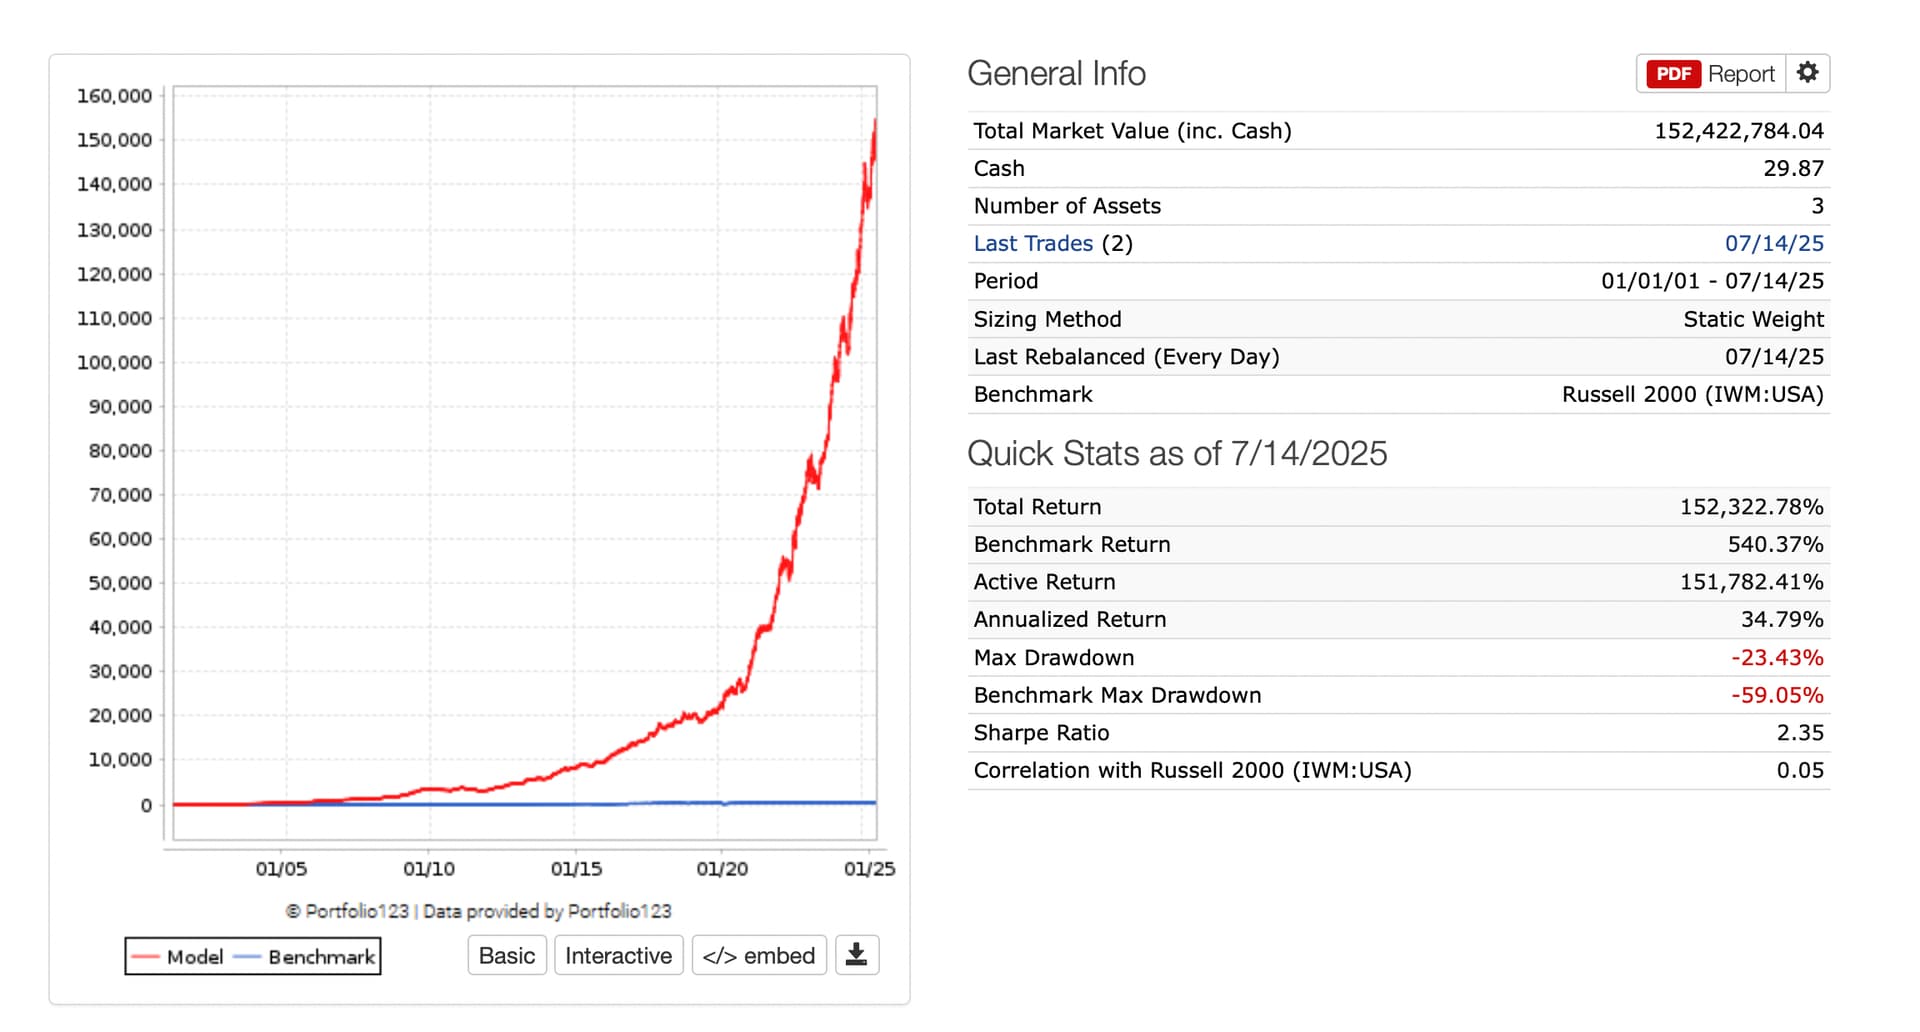
So the sim is a backtest of course. But maybe we can get close to market neutral. Notice 25% TZA and 75% Sim did great with the 2008 drawdown and COVID too. Seems the 2 assets got a little less than 100% inversely correlated in 2010. But maybe these do not have to be a member's only 2 holdings—potentially lowering the drawdowns more.
Correlation with the Russell 2000 is 0.05. So a step towards market neutrality.
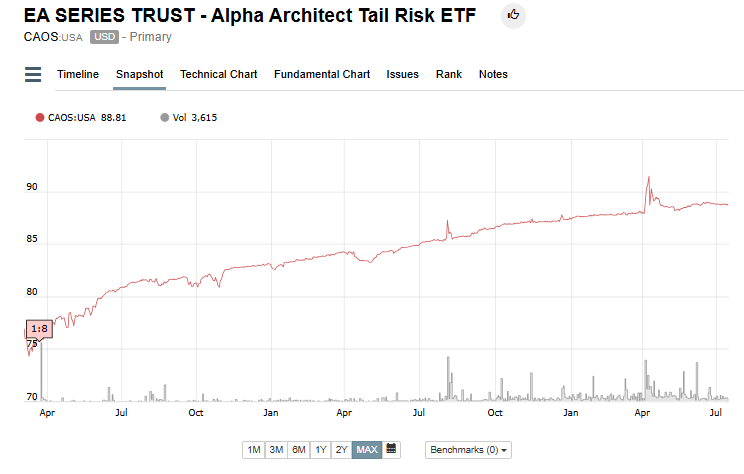
Would also be interesting if you substituted T-Bills allocation with with Alpha Architect's CAOS Tail Risk ETF. The product is a bit opaque (obligatary know what you own disclaimer), but my understanding is They buy and hold for otm spy puts by selling closer to the money put spreads to avoid insurance drag. Over the long haul it's returned T-Bill like annual returns (~4%) but with large spikes on high vol big moves like we saw in April. The reason it's not risk free is, as far as I can tell, is in a situation where there is a long slow grinding spy decline it loses money because the short spreads lose and the long tails don’t generate enough volatility to pay (no free lunch, as they say). But maybe combined with a pure short ETF they compliment each other.
 TZA’s Structure: Not Just an ETF—It’s a Derivative-Based Vehicle