Does anyone use correlation tables or mean-variance optimization to determine position sizing within their portfolios? Or, for that matter, Thorp’s method based on the Kelly Criterion? If so, what has been your experience using complex position-sizing methods?
Yuval,
I use MPT on the book level but not on the port level for individual stocks.
One might consider, also, making each stock holding beta equivalent. So the (amount or total value of one ticker) * (beta of that ticker) is the same for each holding. This is commonly done for pairs trading so that the short and long positions will average out as far as their impact on the portfolio.
This could be considered for the stock holdings in a long only portfolio so that one holding does not have too much of an effect due its beta. I am too lazy to do this or anything else you mentioned.
Best,
Jim
Yuval, I use MaxCorrel as a criterion in buy rules for new positions in concentrated (20-stock) portfolios, but I don’t understand how I could use correlation to determine weightings in P123. I consider correlation-based diversification an investing “free lunch,” so anything that could be readily implemented through P123 (without a separate optimization) would be attractive.
On the subject of weightings, I have wanted to implement an active weighting scheme in large-cap accounts (to give holdings equal weights in excess of their benchmark weight), but could not figure that out. Is this possible?
Unfortunately,
Correl(1 , 62 , #Equity)
doesn’t work since #Equity isn’t a valid series for that function. I’m unsure why that’s the case. It would be a nice enhancement that I think would address correlation based sizing.
Walter
Does not MaxCorrel work? Probably not for this scenario but maybe it could work?
Yuval,
This turns out to be a better question than I realized when you asked it. I understood the importance of this as I said above. I have been doing this at the port and ETF level for a while. But I had not tried this for individual stocks (within a port) until today because it is a little difficult to test.
But I was playing with InteractiveBrokers’ backtester and I thought I would share what I found.
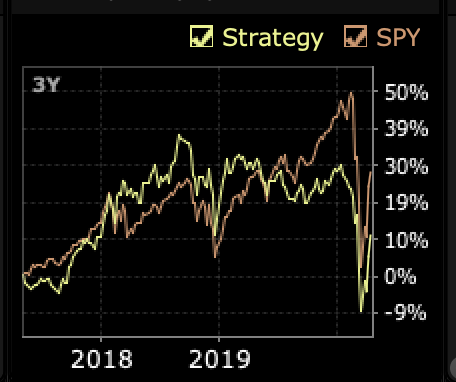
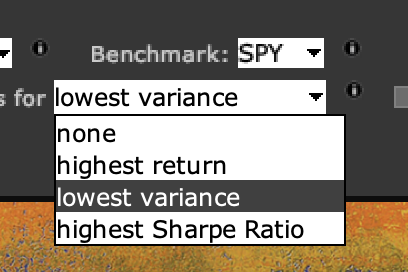
The backtester gives a few options for weighting stock positions that include the option of weighing the positions equally and creating a portfolio with positions sizes that minimum variance.
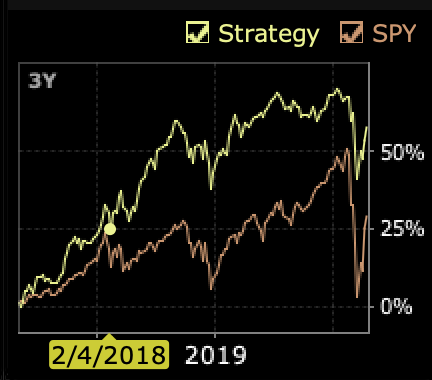
The first image is the backtest with equal weights. The second image is the options to be selected. The final is with the backtest with ‘Lowest Variance’ option (with no other changes).
It seems it CAN make a HUGE difference. In other words, you ask a good question that people may want to look at more closely for their own portfolios.
Unfortunately I only have the paper trade level at IB because I was only using it to paper trade a pairs trading strategy. So my ability to backtest this at the stock level is limited to 3 years. What people find with longer backtests of their own strategies may differ.
Best,
Jim
Low volatility did very well over the past few years. Mean variance optimization over-weights low volatility stocks which rides this phenomenon.
A minimum variance portfolio can do well long term over multiple market regimes.
Any backtest can be prone to data snooping. For example, I keep adding QQQ to my backtests. Why? Well, because I know it did well. Should I add GDX (the gold miners) to my backtests? Uh,…let me look back and see how it did first.
Perhaps this problem is minimized by sticking with SP500 stocks and using the SP500 as the benchmark. Decide for yourself. I use just the sector SPDRs that have been around for a long time. That would excluded XLRE and XLC. Specifically that is XLE, XLU, XLK, XLB, XLP, XLY, XLI, XLV, XLF.
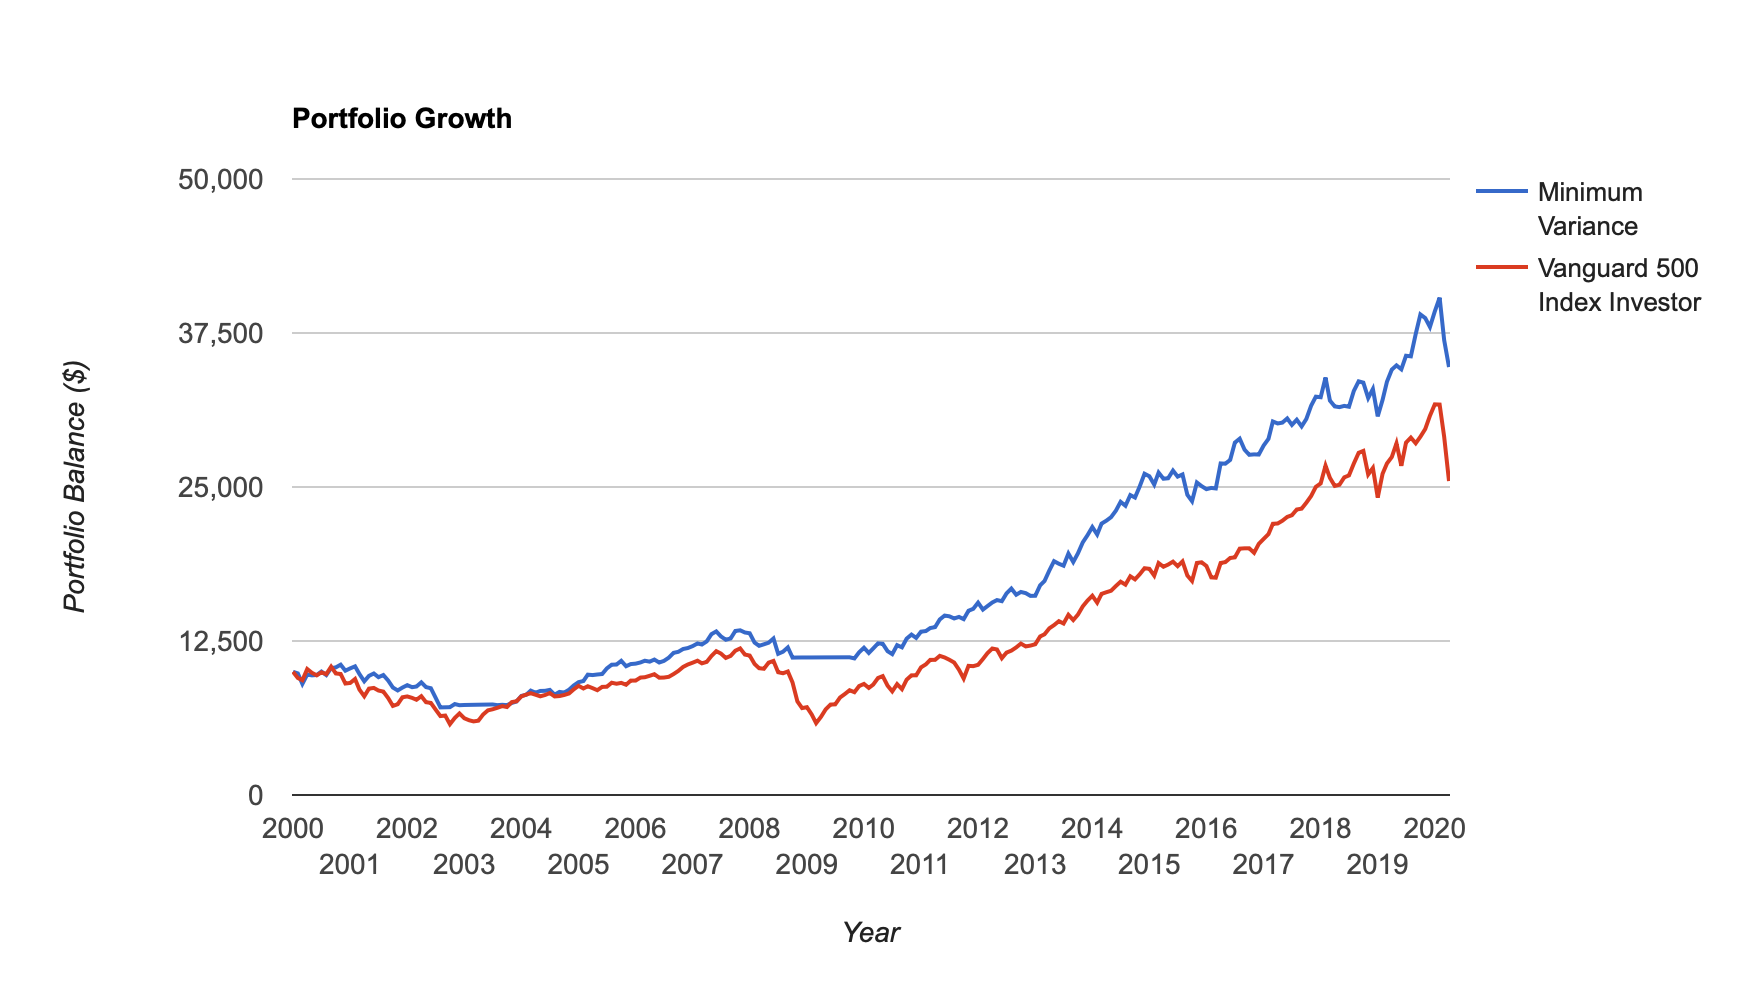
So, the program looks back at the last year’s volatility and correlation then selects the minimum volatility portfolio for the next month and buys that. The next month it does the same thing—rebalancing the portfolio every month. So, this is out-of-sample but with some hindsight bias.
Below are the results with all of the above mentioned weakness (and more). At least I did not add QQQ (or GDX) this time which I am prone to do.
Note, the program goes into cash in 2008 and 2003 even though I did not list cash as an asset. I have not tried to call support and ask why. But I think the program just cannot sort out the volatility during that time and find a solution.
Anyway, minimum variance seems to do well in all time periods.
I think this is because the stock market is much more persistent with regard to volatility, and perhaps correlations, than it is with regard to mean or expected returns.
Indeed, volatility may be the only thing that persists if you believe in EMH (the efficient market hypothesis) for stocks in the SP500. There are a lot of analysts looking at the SP500 and RenTec is constantly trying to arbitrage away any inefficiencies. Even the average retail investor can short, use options and has access to decent pairs trade software.
This can be done with your sims at P123. The daily price action of your sims can be uploaded into programs to find optimal portfolios (including your ports) with various risk methods. I am a big fan of expected shortfall or conditional value-at-risk (this week).
I used PortfolioVisualizer for this.
Best,
Jim
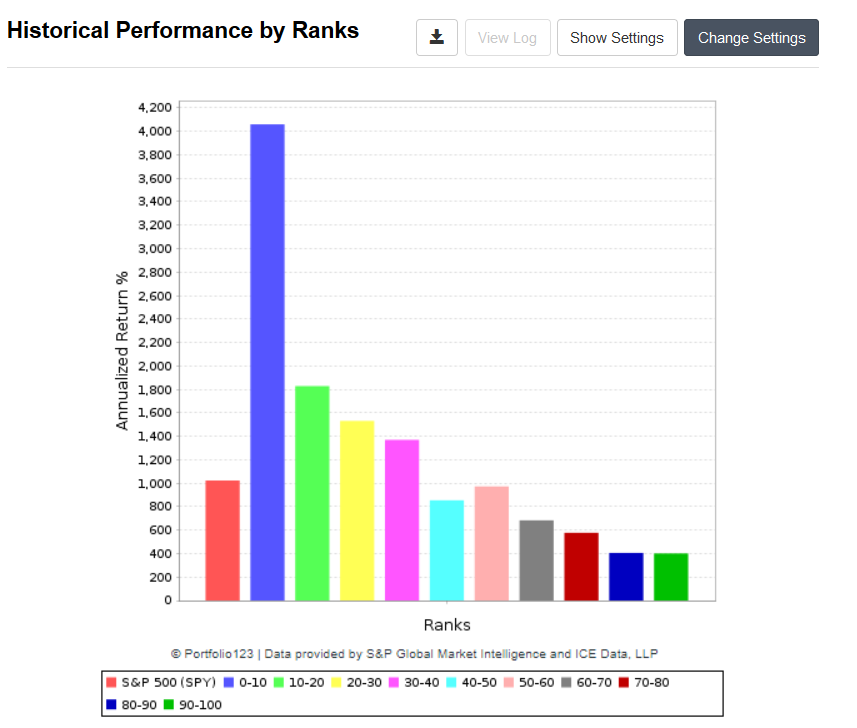
Low volatility is a good factor that works most of the time. Exception? After a crash. Here is the performance of the low volatility ranking system since the most recent market bottom about a month ago.
In other words, this chart tells me that while mean variance optimization may be good, and research on it is good, but now is not the right time to start using it if you believe that the market has already bottomed.
Chaim,
Absolutely agree and I could add nothing to what you say.
If you can identify the bottom or even a while after coming out from the bottom it is smart to switch to pure risk-on.
I got lucky and switched to near 100% QQQ and XLK at this recent bottom. Temporary bottom? I do not know and I do not think my speculation on this would add much to the discussion.
But you are 100% right.
Best,
Jim
low volatility = bond like, If you look its mostly Utilities, REITs and that kind of things. They benefit when interest rates are CUT , like we have from over the years. Going forward, it becomes a tougher call withi nterets rates at 0, how much lower it can go?.
Da,
That is basically correct. Although when I run this with VNQ it seldom becomes part of the portfolio for some reason.
In addition to XLU, XLP and XLV are often overweighted. If TLT is added it is inversely correlated so you are right about bonds often being part of the portfolio if added as an asset to be optimized.
But you would be surprised at times. It is not just the volatility but the correlations the program uses. So the correlation may results in more risk-on assets than you would expect. And expected shortfall (conditional variance-at-risk) often picks 100% risk-on assets that have not had much downside recently (and therefore, not thought to have tail-risk by the program).
Anyway, just to basically confirm what you have said I added the image of the asset allocations that goes with the above (if you are interested). And if anyone happens to be really interested the site is mostly free (I have not paid).
The program allows one to limit the amount of assets (e.g., bonds) or specify a constant amount.
Best,
Jim
