If i may ask for your guidance once more. What is the quickest way to see the actual number behind a factor? For example, i am curious to see what SpcItem is and i do not have access to factset.
I thought of using showvar in a screener, but i would need to add each time the same lines to each screen. Given that i want to see many variables i believe this would be very time consuming.
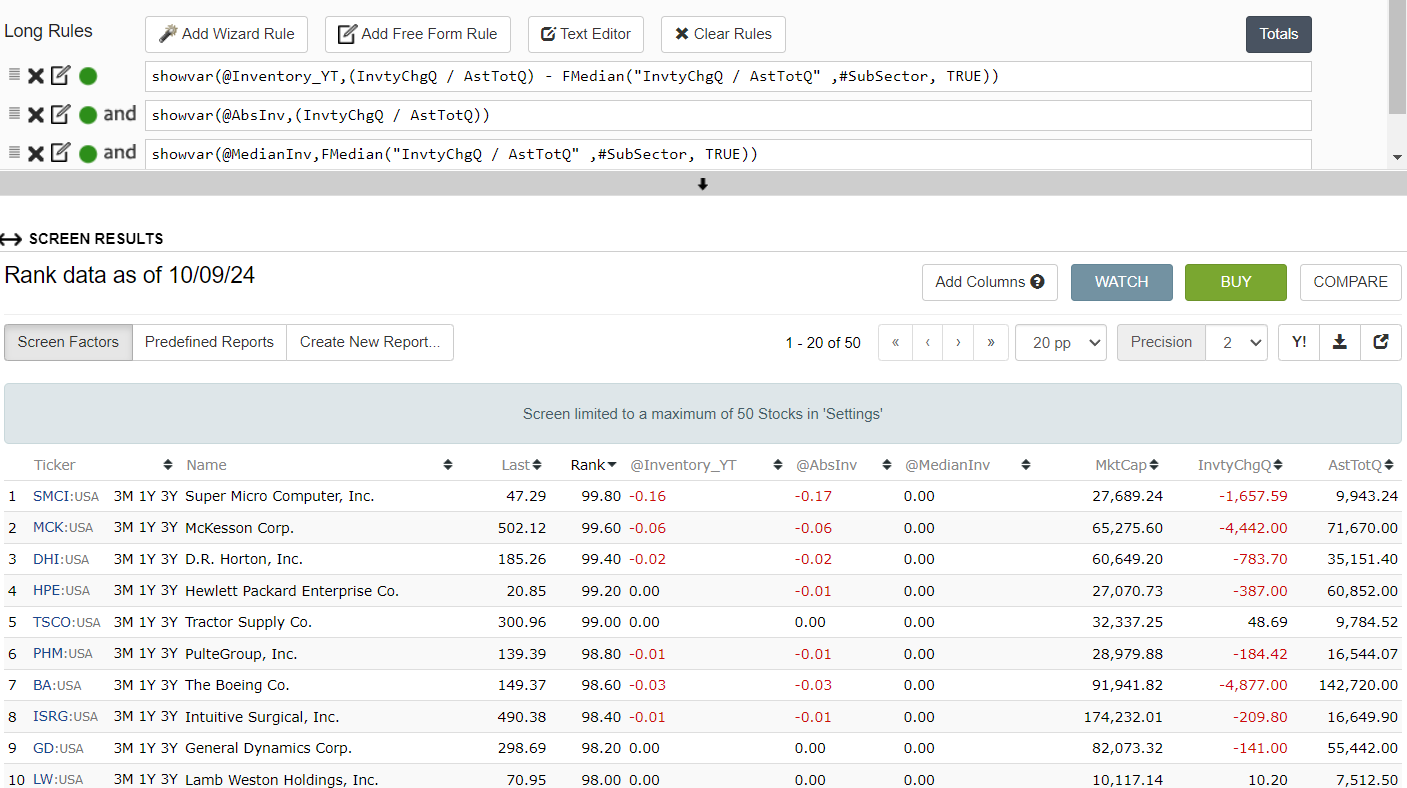
@yuvaltaylor I am trying to get acquainted to P123 synthax and I tried to hard code the inventory change factor formula you mentioned above. Is this in line with what you meant? I'm not really sure of what the TRUE,FALSE at the end does thou.
my 2 cent is to go first with the stuff that already has been created by P123 and P123 Users:
A beginner will need a ton of time to come up with a better ranking system for small caps than "Small and Micro Cap Focus" Ranking System or for mid and big caps a better one than "Core: Sentiment".
I am standing of the shoulder of giants and 70% of what I am using comes from P123 or P123 Users, my grain of salt comes into the buy and sell rules, daily rebalance of certain strategies (the ones that catch small cap break outs) and the combination of stuff that has been created by P123 / P123 Users.
Yes, everything can be improved, but why start from scratch?
In general, my best factors are:
Value (but not stand alone, only in combination with the below stuff)
Momentum (Industry, Stock)
EPS Rate of Change up --> I would say most important as a kicker in buy and sell rules, EPS Estimates and EPS Actual Factors
Size combined with lower liquidity
Quality (much less though, good total return, but hard to swallow capital curves)
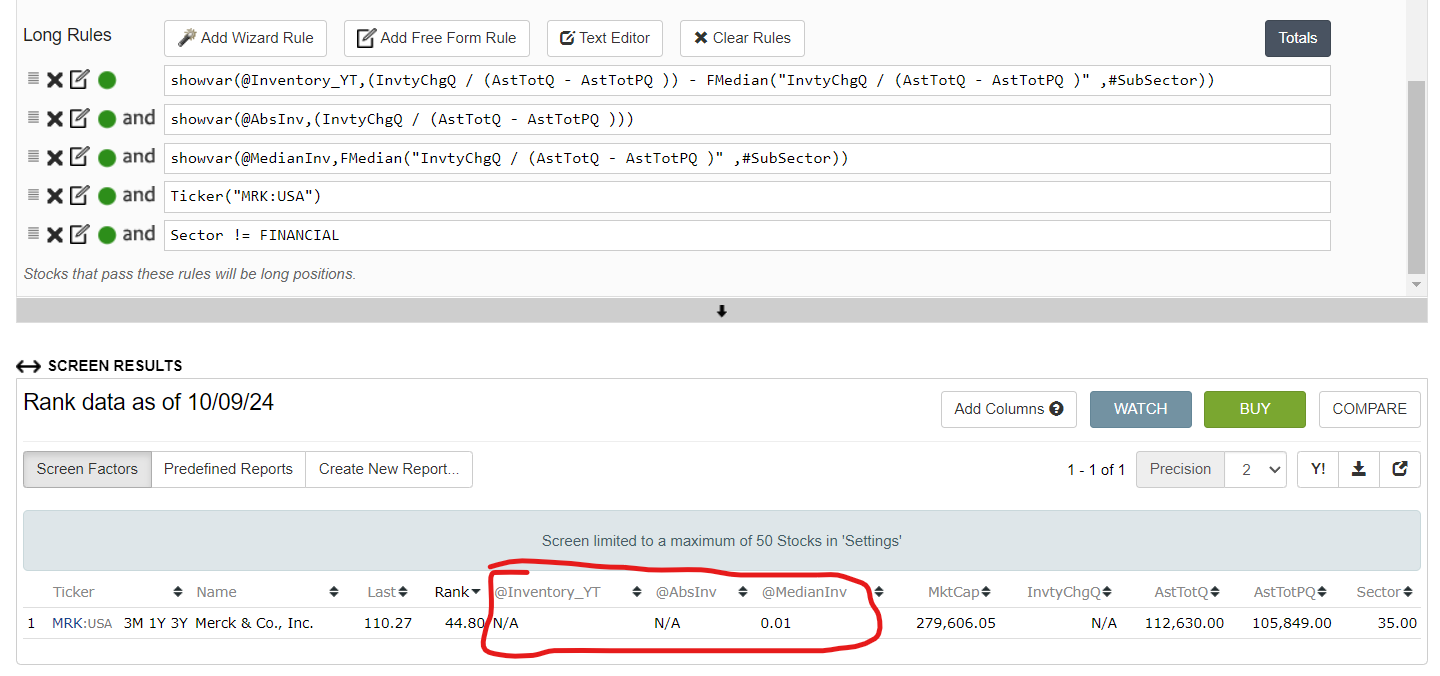
P123 doesn't report Inventory data. Either this or the past quarter is missing.
I checked on the actual 10Q.
LastQ 6.469 bn
PrevQ 6.510 bn.
Using the total asset change from P123 i would have asset change of (yes i amended the formula slightly as this one makes also sense in my mind) 6.781bn.
Assets increased by 6.4%
Inventory decreased. The formula would have shown a negative number and probably would have made it into the ranking. I'm not saying it should be there, I'm debugging the issue.
Merck is a big company, who is not reporting the data?
Okay, so it turns out you didn't/don't know what was in the factor list before, so you didn't realize that what I had said before exactly includes what you were trying to say.
There are many more factors in the list than in the system's default models, so this is not a duplication.
And it doesn't actually require any invention. I just directly copy something someone else invented.
I love plagiarization Integrity doesn't pay. Fama and French also publish famous papers based on their plagiarization of other reseachers' factors.
Historically, innovators have not ended up well. See, for example, how the discoverers and conquerors of the "New World" took great risks and then quickly lost their fortunate position, power and wealth, or, as in the case of Magellan, died in the adventure.
Merck has inventory data for the all the last quarters (matching your numbers) using Inventory(), I don't understand why InvtyChg is na. When I check all the companies in Russell 1000, about half have NAs for InvtyChg, but only 10% have NAs using Inventory().
I mean, it is not a big problem as i can always substitute the formula and use the components. But it is annoying, especially because the user may not realize what is messing up his ranking or screen.
InvtyChg is reported in the cash flow statement. It is not simply this quarter's inventory minus last year's. It's a separate line item. If it's not in the cash flow statement, it's not available, even if the actual figures for inventory are. Merck reports its change in inventory only on an annual basis, so InvtyChgA is available while InvtyChgQ and InvtyChgTTM are not. What gets reported on the cash flow statement can vary considerably from what's on the balance sheet.
I see you're using ShowVar, which is my preferred way to see the actual value of a factor. I think you're doing the right thing here, except that InvtyChg is hard to work with unless you're using annual numbers. If you're looking at quarterly numbers (InventoryQ - InventoryPYQ) is a better way to go. To add the same lines to different screens use the text editor and copy and paste. FactSet is Portfolio123's default data provider for fundamental items, so if you are looking for FactSet data, that's what you're seeing. Lastly, you're correct that the TRUE parameter with FMedian should not give you a median of 0. The problem is that you're only looking at 2 digits. Set the "precision" to 4 and you'll see the numbers. The median is very close to 0 and just shows up as 0.00. Inventory change is usually a tiny fraction of total assets.
You can't put Dan's list into a ranking system because it's 1460 items long. It has to be curated. It also includes only one financial stability factor. I found out the hard way that investing in companies whose sales vary widely from quarter to quarter doesn't pay off, and the same goes for many other items. See Why Low-Variability Investing Works - Portfolio123 Blog